


Introduction to Flowcharts: A Visual Tool for Process Improvement
Flowcharts are powerful visual tools that allow you to map out and understand complex processes, making them easier to manage and improve. By providing a step-by-step diagram, flowcharts help you visualize the sequence of steps, decisions, and actions involved in a process. This visual representation is particularly effective because humans are primarily visual learners, enabling us to grasp information more efficiently than through written or verbal descriptions alone.
Why Use Flowcharts?
Flowcharts serve multiple purposes across various fields, including software development, business process management, and engineering. They are invaluable for:
- Documenting a Process: Clearly outlining the steps involved in a process for better understanding and communication.
- Planning a Project: Mapping out the sequence of tasks and decisions to ensure a smooth workflow.
- Analyzing an Existing Process: Identifying areas for improvement, such as unnecessary steps, gaps, or barriers.
- Standardizing or Redesigning a Process: Ensuring consistency and efficiency in how tasks are performed.
- Finding Areas for Improvement: Pinpointing inefficiencies, such as unnecessary steps, delays, or communication breakdowns.
Types of Flowcharts
Flowcharts come in various types, each suited for different purposes:
- High-Level Flowcharts: Provide a panoramic view of a process, showing major blocks of activity or system components. These are especially useful in the early phases of a project.
- Detailed Flowcharts: Offer a close-up view of the process, typically showing dozens of steps. These are useful for identifying rework loops and complexity in a process, especially after pinpointing issues or when making changes.
- Swimlane Flowcharts: Also known as cross-functional flowcharts, these divide the process into different “lanes” or categories, making it easier to see who is responsible for each step.
- Opportunity Flowcharts: Focus on identifying opportunities for improvement within a process.
- Deployment Flowcharts: Show the physical layout of a process, helping to optimize the arrangement of equipment and workstations.
Benefits of Using Flowcharts
Flowcharts offer numerous benefits, including:
- Common Understanding: Facilitate a team’s common understanding of the steps in a process, making it easier to collect data, identify problems, and focus discussions.
- Process Improvement: Help identify steps that add value to the internal or external customer, as well as areas for improvement, such as delays, needless storage, and unnecessary work.
- Comparison: Enable comparison of the actual process with the planned or ideal flow, helping to identify discrepancies and areas for improvement.
- Basis for Design: Serve as a basis for designing new processes and understanding whether a process occurs in one or multiple ways.
Elements of a Flowchart
Flowcharts use standardized symbols to represent different types of steps or actions:
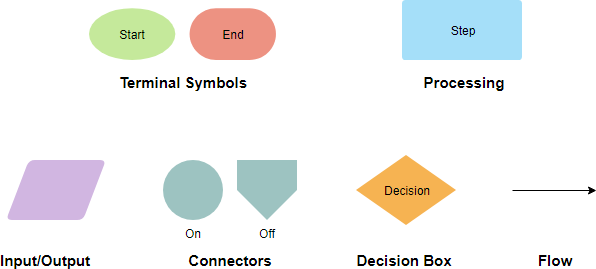
Flowchart symbols
- Terminal Symbols: Indicate the start and end points of a process.
- Input/Output Symbols: Denote any input or output functions in the process.
- Process Symbols: Represent arithmetic and data movement instructions.
- Decision Symbols: Indicate points where decisions are made, leading to different paths based on the outcome.
- Flow Lines: Show the sequence of steps with arrows.
- Connectors: Used in complex flowcharts to indicate continued flow across multiple pages or sections.
Six Steps for Creating a Flowchart
- Identify the Goal: Determine the purpose of the flowchart and the level of detail required.
- Assemble the Team: Involve people with knowledge of the process to outline the steps.
- Define the First and Last Steps: Establish the beginning and end of the process.
- Document the Process Steps: Record the steps in sequence, using symbols to represent actions and decisions.
- Validate the Flowchart: Ensure the sequence of actions and decisions is accurately represented.
- Identify Areas for Improvement: Analyze the flowchart to find opportunities for process improvement and redesign.
Stepwise Refinement in Flowcharts
Stepwise refinement is a systematic approach to breaking down complex processes into simpler, more manageable components. This method is particularly useful in flowcharting, where it helps to clarify and simplify the representation of intricate workflows. By progressively refining each step, you can create a detailed and accurate flowchart that is easier to understand and analyze.

Understanding the Figure
The attached figure illustrates the concept of stepwise refinement in flowcharts. Let’s break down the process depicted in the figure step by step:
High-Level Flowchart
- Go Home: The process begins with the action “go home.”
- Leave: The next step is to “leave.”
- Drive Home: Following that, the action is to “drive home.”
- Arrive: The final step in this high-level flowchart is to “arrive.”
This high-level flowchart provides a broad overview of the process, showing the major steps involved without delving into the details.
First Level of Refinement
To provide more detail, the high-level steps are refined further:
- Leave: This step is broken down into two sub-steps:
- Leave: The initial action remains the same.
- Radio: The next action is to turn on the radio.
- Take Best Route: After leaving and turning on the radio, the next refined step is to “take the best route.”
- Arrive: The final step remains “arrive.”
This refinement adds more detail to the “leave” and “drive home” steps, providing a clearer picture of the actions involved.
Second Level of Refinement
Further refinement is applied to the “take best route” step:
- 580 Backed Up?: A decision point is introduced to check if the 580 route is backed up.
- If Yes: The action is to “take I3.”
- If No: The action is to “take 580.”
- Arrive: The final step remains “arrive.”
This refinement introduces a decision point, adding complexity and detail to the process. It shows how the choice of route depends on the traffic conditions on the 580 route.
Benefits of Stepwise Refinement
- Clarity: Stepwise refinement helps to break down complex processes into simpler, more manageable steps, making the flowchart easier to understand.
- Detail: By progressively refining each step, you can add more detail to the flowchart, providing a comprehensive view of the process.
- Accuracy: Refining steps helps to ensure that all necessary actions and decisions are included, improving the accuracy of the flowchart.
- Flexibility: Stepwise refinement allows you to adjust the level of detail as needed, making the flowchart adaptable to different audiences and purposes.
Conclusion
Flowcharts are essential tools for visualizing and understanding processes. By breaking down complex workflows into simple, standardized symbols, flowcharts enhance clarity, communication, and efficiency. Whether you are documenting a process, planning a project, or analyzing an existing workflow, flowcharts provide a clear and concise visual representation that helps you manage and improve processes effectively.
Stepwise refinement is a powerful technique for creating detailed and accurate flowcharts. By breaking down complex processes into simpler steps and progressively refining each step, you can create a clear and comprehensive visual representation of the process. This approach enhances clarity, detail, accuracy, and flexibility, making flowcharts an invaluable tool for process analysis and improvement.
Reference
- Online Flowchart Tool – Visual Paradigm’s online flowchart tool is described as the easiest and most powerful in the world, allowing users to create diagrams quickly and collaboratively. It supports creating flowcharts from scratch or using templates.
- Flowchart Tutorial (with Symbols, Guide and Examples) – This tutorial provides a step-by-step guide on how to draw flowcharts using Visual Paradigm. It covers the basics of flowcharts, their symbols, and examples to help users understand and create flowcharts effectively.
- Free Online Flowchart Maker – Visual Paradigm Online offers a free flowchart maker with an intuitive drag-and-drop editor. It includes extensive built-in templates and allows users to create professional flowcharts quickly and easily.
- Flowchart Templates – This resource provides a variety of free online flowchart templates and examples. Users can sign up to create a free online workspace and start designing professional flowcharts using Visual Paradigm’s online flowchart maker.
- Flowchart Tutorial – This tutorial covers what a flowchart is, how to create one, and when to use it. It includes flowchart examples and tips, helping users learn about flowcharts and how to draw them step-by-step using Visual Paradigm.
- Easy-to-Use Flowchart Maker – Visual Paradigm is highlighted as an intuitive and powerful flowchart software, ideal for users who need a reliable and easy-to-use tool for creating visually appealing flowcharts quickly.
- Free Online Flowchart Editor – Visual Paradigm Online features a state-of-the-art online flowchart editor that allows users to create flowcharts flexibly and simply. It supports various diagram types, including mind maps, org charts, UML, ERD, and floor plans.
- Web-Based Free Flowchart Maker – This web-based flowchart maker by Visual Paradigm Online supports creating professional and beautiful flowcharts online. It offers drag-and-drop functionality, alignment tools, grouping, and formatting tools for easy diagramming.
- The Flowchart is an Online Visual Paradigm – Yonyx – This article discusses flowcharts as an online visual paradigm that promotes ideation, investigation, revision, experimentation, and deep visualization. It explores how flowcharts can be used to model processes and develop new concepts.
- Free Flowchart Tool – Visual Paradigm Online offers a free flowchart tool that allows users to create exceptional flowcharts online. It supports inserting text, external graphics, and links, making flowcharts rich in content and visually tidy.
This post is also available in Deutsche, Español, فارسی, Français, English, Bahasa Indonesia, 日本語, Polski, Portuguese, Ру́сский, Việt Nam, 简体中文 and 繁體中文.
