


Process Improvement Through Flowcharting: A Guide to Streamlining Business Processes
Problem Description
ABC Company is a manufacturer of electronic devices, such as smartphones, tablets, and laptops. They receive raw materials from various suppliers, including components such as processors, memory chips, batteries, and screens. To ensure the quality of their products, ABC Company has implemented a rigorous inspection process for incoming materials and finished products.
When raw materials arrive at the warehouse, they are checked for damage, defects, and other issues. The inspection team uses various tools and tests to verify the quality of the materials, such as visual inspection, electronic testing, and chemical analysis. If the materials meet the quality standards, they are labeled and stored in the inventory.
When it’s time to assemble a new batch of products, the materials are retrieved from the inventory and transported to the production line. The assembly team follows a set of instructions and procedures to assemble the components into finished products, such as smartphones or tablets. After the assembly is completed, the finished products are inspected again for any defects or malfunctions.
If the products meet the quality standards, they are labeled with a unique identifier and packed in a box. The shipping team then moves the boxes to the designated area for shipping, where they are prepared for delivery to customers. However, if the products do not meet the quality standards, they are sent back to the rework area for further inspection and repair. The rework team tries to fix the issues and bring the products up to the quality standards. If the rework is successful, the products are labeled and packed as usual, and if not, they are disposed of according to the company’s waste management policy.
In some cases, the incoming materials may not meet the quality standards, such as if they are damaged during shipping or if they fail to pass the inspection. In this case, the materials are rejected and returned to the supplier, and ABC Company orders replacement materials to maintain their production schedule.
By implementing a strict quality control process, ABC Company ensures that their products meet the high standards of performance, safety, and reliability that their customers expect. This helps them build a reputation as a trusted and respected brand in the highly competitive market of electronic devices.
Creating Structure Text to Develop the Flowchart
Developing structured text from a business scenario can be helpful in the development of a flowchart process because it provides a clear and concise description of the steps involved in the process. The structured text can be used as a reference for developing the flowchart, ensuring that all the important steps and decision points are included in the visual representation.
- The structured text breaks down the business scenario into a series of logical steps that can be easily translated into a flowchart. By writing out the steps in a structured way, it is easier to identify the inputs, outputs, decision points, and process flows involved in the business scenario. This can help to ensure that the flowchart accurately represents the process and is not missing any critical steps or decision points.
- Additionally, structured text can be used to validate and test the flowchart. By comparing the flowchart to the structured text, it is possible to identify any discrepancies or errors in the flowchart, such as missing steps or conflicting decision points. This can help to refine the flowchart and ensure that it accurately reflects the business scenario.
- Overall, developing structured text from a business scenario can provide a solid foundation for developing a flowchart process, ensuring that the flowchart accurately represents the process and can be used as a tool for process improvement and optimization.
Structured Text for Flowchart Development
Receive raw materials;
Inspect quality of raw materials;
If quality is acceptable, then:
Move materials to production line;
Assemble components;
Inspect finished products;
If products meet quality standards, then:
Package and label products;
Move to shipping area;
If products do not meet quality standards, then:
Rework products;
Inspect again;
If products meet quality standards, then:
Package and label products;
Move to shipping area;
If products still do not meet quality standards, then:
Dispose of products;
If quality is not acceptable, then:
Reject materials;
Order replacement materials;
Stop.
Now Develop The Flowchart based on the Structured Text
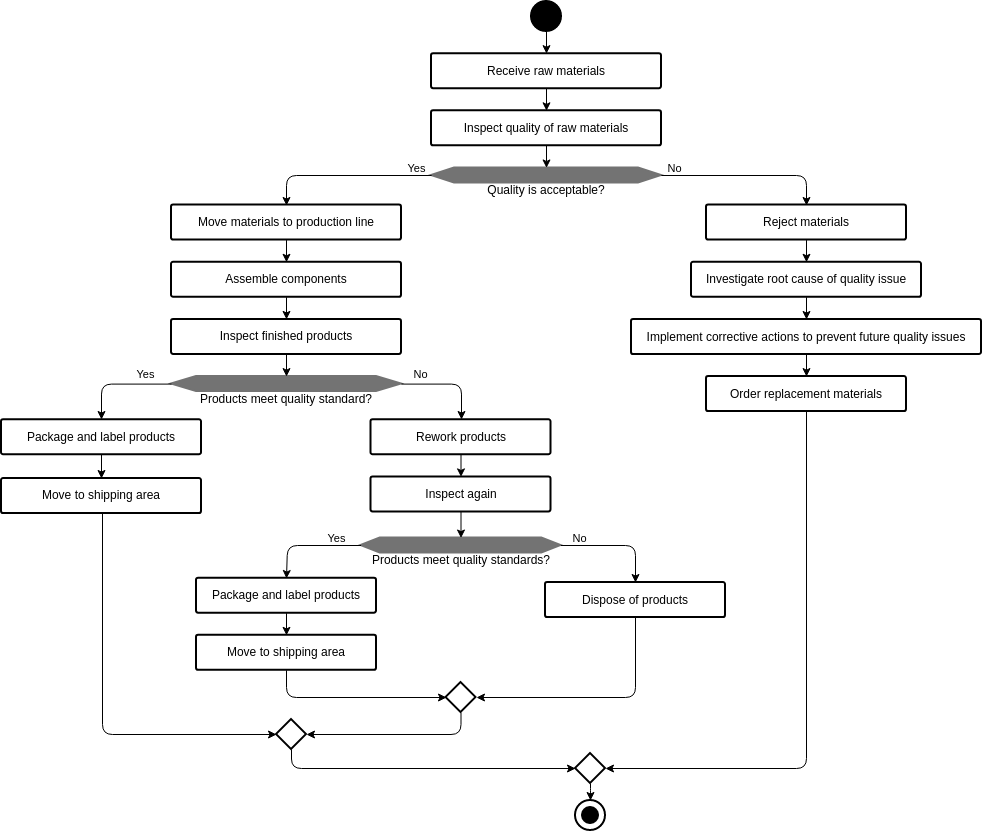
This flowchart represents a quality control process for a manufacturing company that produces products using raw materials. The process begins with the receipt of raw materials and an inspection of their quality. If the quality of the raw materials is acceptable, they are moved to the production line, where components are assembled and finished products are inspected.
If the finished products meet the quality standards, they are packaged and labeled for shipment. If they do not meet the quality standards, they are reworked and inspected again. If the reworked products meet the quality standards, they are then packaged and labeled for shipment. If they still do not meet the quality standards, they are disposed of.
If the quality of the raw materials is not acceptable, they are rejected, and replacement materials are ordered. The process ends with the stop symbol, indicating that the quality control process is complete.

Flowcharts for Process Improvement using Gap Analysis
Visualizing a process using a flowchart can make it easier to understand the sequence of steps involved and identify areas for improvement. By reviewing the existing process and identifying areas that could be improved, a new flowchart can be developed to reflect the updated process. Comparing the two flowcharts can then help to identify the gaps between the current and target processes, which can inform improvement initiatives or proposals. This can be especially helpful in team environments where multiple people are involved in the process and can collaborate on identifying and implementing improvements.
Process improvement using gap analysis is a structured approach to identify areas of improvement in a process by comparing the current state of the process (source process) with the desired future state (target process). This approach involves developing two flowcharts, one for the current process and one for the target process, and then identifying the gaps between the two.
The gap analysis involves comparing the steps, decision points, inputs, and outputs in the two flowcharts to identify areas where the target process deviates from the current process. This can help to identify areas where improvements can be made to streamline the process, reduce waste, increase efficiency, or improve quality.
Once the gaps are identified, improvement initiatives can be formulated to address them. These initiatives could involve changes to the process steps, changes to the decision criteria, changes to the inputs or outputs, or changes to the resources or tools used in the process.
By using a structured approach like process improvement using gap analysis, organizations can make targeted improvements to their processes that can result in significant benefits such as increased productivity, reduced costs, improved quality, and increased customer satisfaction.
Step-by-Step Guide to Performing Gap Analysis for Process Improvement
Here’s an example of a gap analysis based on the business scenario described earlier:
Current Process (Source Process)
- Receive raw materials
- Inspect quality of raw materials
- If quality is acceptable, then: a. Move materials to production line b. Assemble components c. Inspect finished products d. If products meet quality standards, then: i. Package and label products ii. Move to shipping area e. If products do not meet quality standards, then: i. Rework products ii. Inspect again iii. If products meet quality standards, then: 1. Package and label products 2. Move to shipping area iv. If products still do not meet quality standards, then: 1. Dispose of products
- If quality is not acceptable, then: a. Reject materials b. Order replacement materials
- Stop
Target Process
- Receive raw materials
- Inspect quality of raw materials
- If quality is acceptable, then: a. Move materials to production line b. Assemble components c. Inspect finished products d. If products meet quality standards, then: i. Package and label products ii. Move to shipping area e. If products do not meet quality standards, then: i. Rework products ii. Inspect again iii. If products meet quality standards, then: 1. Package and label products 2. Move to shipping area iv. If products still do not meet quality standards, then: 1. Dispose of products
- If quality is not acceptable, then: a. Reject materials b. Investigate root cause of quality issue c. Implement corrective actions to prevent future quality issues d. Order replacement materials
- Stop
Gap Analysis
- Gap: The current process does not include an investigation of the root cause of quality issues when raw materials are rejected.
- Recommendation: Include an investigation of the root cause of quality issues when raw materials are rejected, and implement corrective actions to prevent future quality issues.
- Resulting Benefit: Improved quality of raw materials and finished products, reduced waste and rework, increased customer satisfaction.
Revised Flowchart: Improved Process Flowchart with Root Cause Analysis and Corrective Actions
The flowchart is very similar to the original process flowchart, but with the addition of steps to investigate and address the root cause of quality issues when raw materials are rejected.
Understanding GAP Analysis and Its Relationship to Flowcharts
GAP analysis is a technique used to identify the difference between the current state and the desired state in a process. It involves comparing the current performance of a process with its desired performance and identifying the gaps or discrepancies that exist. This technique can be used to identify areas where process improvements can be made.
Flowcharts are often used in GAP analysis to visualize the current process flow and the desired process flow. By comparing the two flowcharts, the gaps or discrepancies between the two can be identified and addressed. The modified flowchart can then serve as a blueprint for process improvement initiatives. In this way, GAP analysis and flowcharts are closely related and can be used together to improve processes in an organization.
Benefits and Features of Visual Paradigm Online for UML Diagramming
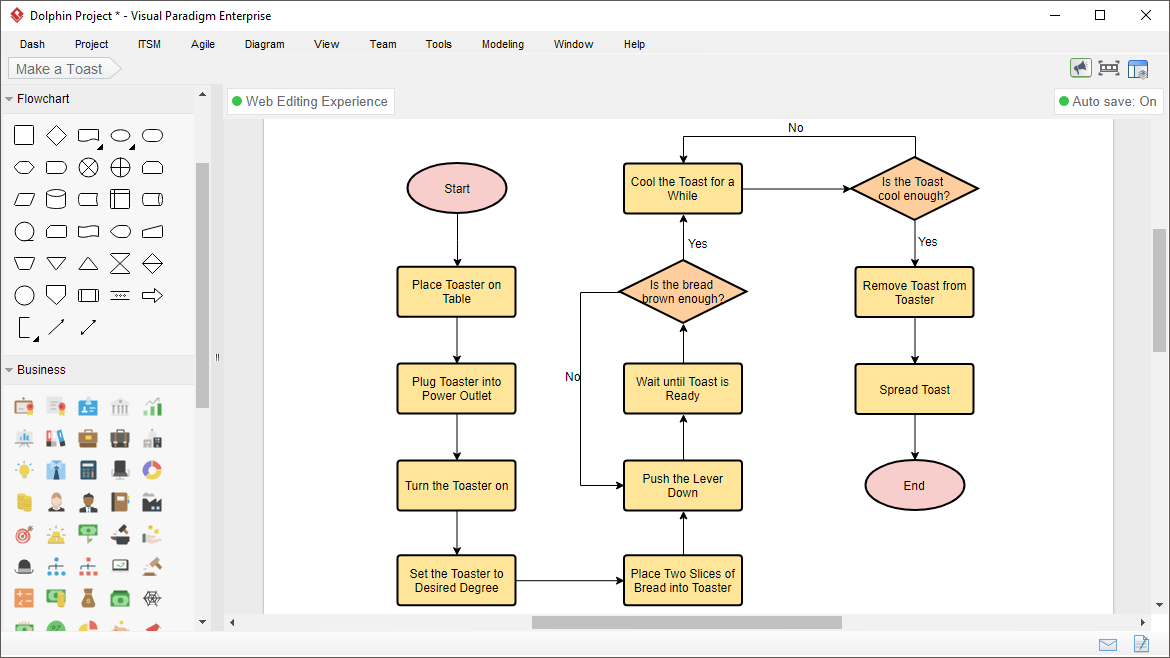
Visual Paradigm Online is a free and powerful online UML diagram tool that allows users to create and share diagrams quickly and easily. With Visual Paradigm Online, you can create a wide range of UML diagrams, including use case diagrams, class diagrams, sequence diagrams, activity diagrams, and more.
One of the biggest advantages of Visual Paradigm Online is its ease of use. The interface is intuitive and user-friendly, making it easy for beginners to create high-quality diagrams without any prior experience. Additionally, Visual Paradigm Online is web-based, so you can access your diagrams from anywhere with an internet connection.
Visual Paradigm Online also offers a range of collaboration features, which make it easy to share your diagrams with others and collaborate on projects in real-time. You can invite team members to view or edit your diagrams, leave comments, and track changes, ensuring that everyone is on the same page.
Overall, Visual Paradigm Online is an excellent choice for anyone looking for a free and easy-to-use UML diagram tool. Its powerful features and collaborative capabilities make it an ideal choice for individuals and teams alike.
Conclusion
Flowcharts are a powerful tool for improving business processes. They can help organizations visualize their current process flow, identify inefficiencies and bottlenecks, and develop an improved process flow that can increase efficiency and productivity. By using flowcharts in conjunction with GAP analysis and other process improvement techniques, organizations can achieve significant improvements in their operations. However, it’s important to remember that creating a flowchart is just the first step in process improvement. Organizations must also be committed to implementing the necessary changes to realize the full benefits of the improved process. By incorporating flowcharting into their process improvement initiatives, organizations can improve their competitive position and achieve their strategic goals.
This post is also available in Deutsche, Español, فارسی, Français, English, Bahasa Indonesia, 日本語, Polski, Portuguese, Ру́сский, Việt Nam, 简体中文 and 繁體中文.
