


Sankey Diagram: How to Change the Tooltips of Links?
A Sankey diagram is a type of flow diagram that is used to depict the flow of data or materials through a system. It is composed of nodes, which represent the different sources and destinations, and links, which represent the flows between them. The thickness of the links represents the quantity of data or material flowing from one node to another. This value is commonly referred to as the weight or flow strength of the link.
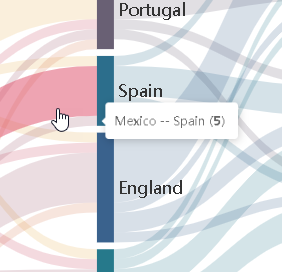
Visual Paradigm Online’s Sankey diagram maker provides a user-friendly interface for creating Sankey diagrams with ease. As you hover over the links, you can view the source, target, and weight of the link, which helps you gain a better understanding of the flow. However, you have the option to customize the information displayed while hovering over the link. In this article, we will guide you through the steps to change the information displayed when you hover over a link in a Sankey diagram.
Elements of a Sankey diagram
Here are the major elements that form a Sankey diagram:
- Source(s): The source node in a Sankey diagram represents the starting point of a flow. It is the point from which materials or data begin to flow.
- Target(s): The target node in a Sankey diagram represents the endpoint of a flow. It is the point to which materials or data ultimately flow.
- Value: The weight of a link in a Sankey diagram represents the amount of material or data that is flowing between two nodes. The thickness of the link is proportional to its weight.
- Link comment: A description or explanation that can be attached to a link. It provides additional information about the relationship between two nodes and the flow of materials or data between them. This can help to provide context and aid in analysis of the Sankey diagram. To learn more about how to set link comments, here click.
How to Change the Tooltip of Links?
Let’s take a look at the steps to write comments for links in a Sankey diagram using Visual Paradigm Online:
- Select the Sankey diagram that you want to edit.
- Open the Settings pane on the right side of the screen and click on the Chart tab.
- To customize the information displayed when hovering over a Sankey link in Visual Paradigm Online, navigate to the Link Tooltip section located lower on the settings pane. This section allows you to select or deselect specific information that you want to be displayed when hovering over a link.
- Click on the diagram background to finish editing.
Creating Sankey Diagram with Visual Paradigm Online
Visual Paradigm Online features a chart maker that supports many different charts, including Sankey diagrams. Its Sankey diagram maker allows you to create professional Sankey diagrams quickly and easily. Click here to try creating your own Sankey diagram today.
This post is also available in Deutsche, Español, فارسی, Français, English, Bahasa Indonesia, 日本語, Polski, Portuguese, Ру́сский, Việt Nam, 简体中文 and 繁體中文.
