


Sankey Diagram: How to Edit Link Comment
A Sankey diagram is a type of diagram that visualizes the flow of data or material through a system. It uses nodes and links to show the movement of resources, and the width of the links represents the quantity of flow. Sankey diagrams are great for analyzing and understanding complex systems, such as energy usage, water management, or financial transactions.
What are Links in a Sankey diagram?
Links in a Sankey diagram are the connections between nodes. They represent the flow of data or material between the nodes, and their width represents the amount of flow. By analyzing the links, you can identify the strongest and weakest points in the system, as well as areas for potential optimization.
Writing Comments for Links
Link comments are additional textual descriptions that you can attach to a link to explain the linkage between nodes. They can provide additional context and information to aid in the analysis and interpretation of the diagram. By writing clear and concise descriptions, you can help users better understand the relationships and connections between nodes.
Why do you need to write a link comment?
Writing link comments can help to provide additional information about the flow of data or material between nodes. This information can be critical for users who are analyzing the diagram and trying to understand the system. It can also help to clarify the meaning of the links and ensure that users are interpreting the diagram correctly.
How to write a link comment
Let’s take a look at the steps to write comments for links in a Sankey diagram using Visual Paradigm Online:
- Select the Sankey diagram that you want to edit.
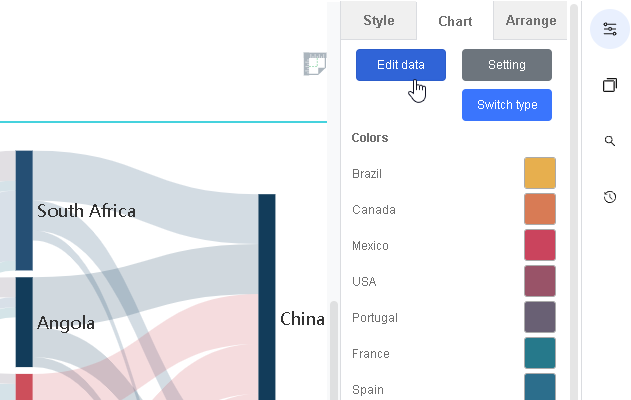
- Open the Settings pane on the right side of the screen and click on the Chart tab.
- click on the “Edit Data” button.
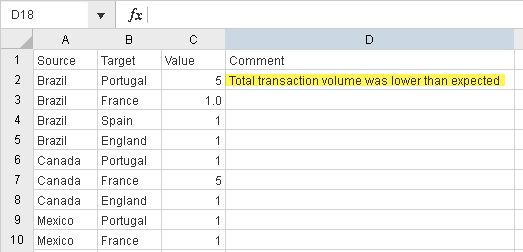
- You can add or edit links by opening the spreadsheet editor. In this editor, each row represents a link, with the first and second columns specifying the source and target of the links, and the third column specifying the weight of the links. To add comments to the links, simply edit under the fourth column with the header “Comment”. Enter your comments in the corresponding rows.
- Click on the diagram background to finish editing.
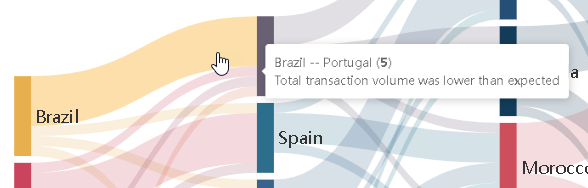
Now, if you hover over the links, you can see the comments of the links.
If you want to hide the comment, follow these steps:
- Select the same Sankey diagram.
- Open the Settings pane and click on the Chart tab.
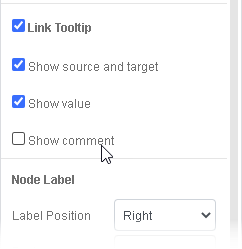
- Scroll down and disable “Show comment“. This will hide the comments of the links upon hovering.
Best practice of Writing Link Comments
When writing a link description, you should aim to be clear and concise. Start by identifying the source and target nodes for the link, and then describe the type of data or material that is flowing between them. You can also include additional information, such as the quantity or frequency of the flow. Be sure to use terminology that is familiar to your audience and avoid jargon or technical terms that may be confusing.
Creating Sankey Diagram with Visual Paradigm Online
Visual Paradigm Online features a chart maker that supports many different charts, including Sankey diagrams. Its Sankey diagram maker allows you to create professional Sankey diagrams quickly and easily. Click here to try creating your own Sankey diagram today.
This post is also available in Deutsche, Español, فارسی, Français, English, Bahasa Indonesia, 日本語, Polski, Portuguese, Ру́сский, Việt Nam, 简体中文 and 繁體中文.
