


Sankey Diagram: How to Edit the Weight of Links?
Sankey diagrams are a cool way to visualize the flow of stuff (like energy, water, or money) through a system. They use arrows of different sizes to show how much stuff is moving from one place to another. Think of it like a map that shows how things move around!
The great thing about Sankey diagrams is that they make it really easy to see what’s going on in a system. You can quickly identify the biggest sources and sinks of stuff, and see how different parts of the system are connected. This can be super useful in all kinds of applications.
For example, in energy usage, a Sankey diagram can show how power is generated and distributed throughout a city. In water management, it can show how water is sourced, treated, and used in different areas. And in financial analysis, it can show how money flows through different sectors of the economy.
So, whether you’re a scientist, an engineer, or just someone who’s curious about how things work, Sankey diagrams are a great tool to have in your toolbox. Let’s dive in and learn more!
What are Nodes and Links in a Sankey Diagram?
Nodes and links are the building blocks of a Sankey diagram. They’re the key elements that make it possible to visualize the flow of data or material through a system.
What are Nodes in a Sankey Diagram?
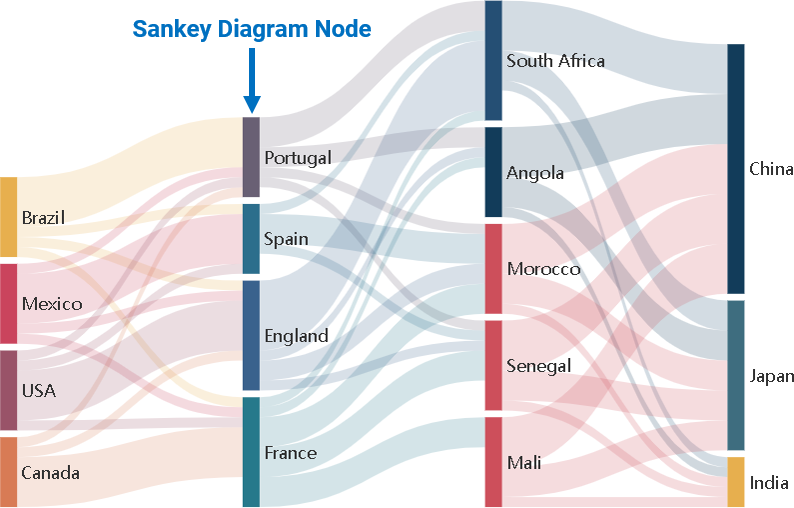
Nodes are the points in the diagram where the flows converge or diverge. You can think of them as the “stations” where the stuff in the system passes through. Nodes are usually represented by rectangles, and they can be different sizes to indicate the magnitude of the flow passing through them.
What are Links in a Sankey Diagram?
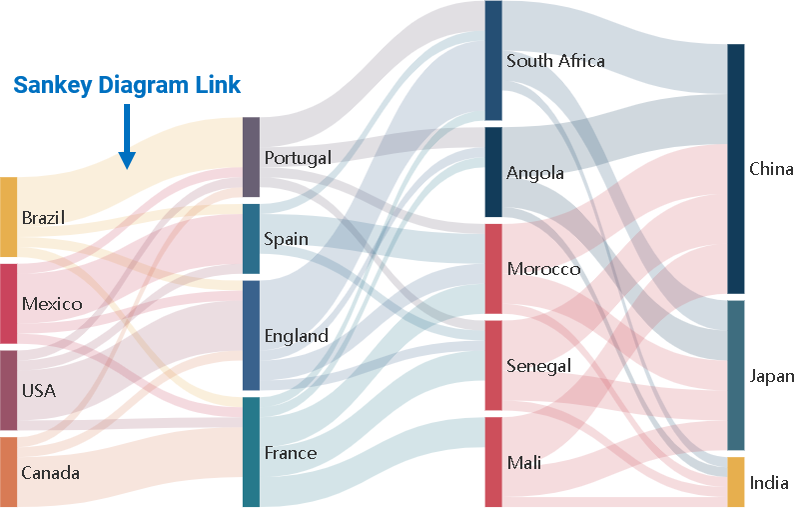
Links are the connections between the nodes, and they represent the flows of data or material. Links are usually represented by regions of different thicknesses. The thickness of the regions is proportional to the amount of stuff flowing through them.
What is the Weight of Links in a Sankey Diagram?
The weight of a link refers to the magnitude or amount of flow that the link represents. This can be thought of as the “thickness” of the link in the diagram. The weight of a link is typically represented by the width of the link. In other words, the greater the flow of data or material between two nodes, the wider the link will be in the Sankey diagram. The weight of a link is an important aspect of Sankey diagrams because it helps to visually communicate the relative magnitude of flows between different nodes in the system being depicted.
How to Edit the Links in a Sankey Diagram?
Editing the links in a Sankey diagram is an important step in creating an accurate and informative representation of data or material flow. Here’s how to add and edit links in a Sankey diagram using Visual Paradigm Online:
- Select the Sankey diagram that you want to edit.
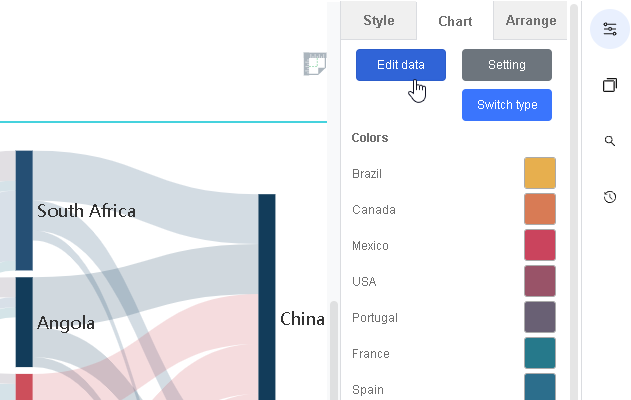
- Open the Settings pane on the right side of the screen and click on the Chart tab.
- To edit the chart data, click on the “Edit Data” button.
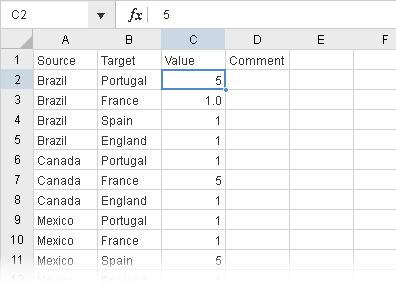
- This will open the spreadsheet editor where you can add or edit links. Each row represents a link and the first and second columns specify the source and target of the links. The third column, “Value”, specifies the weight of the links. Edit the spreadsheet to reflect your desired links.
- Click on the diagram background to finish editing.
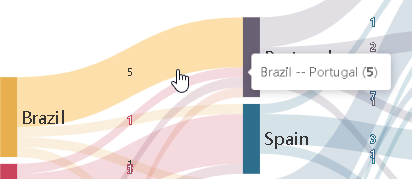
You can click on the diagram background to finish editing. Now, if you hover over the links, you can see the weight of the link.
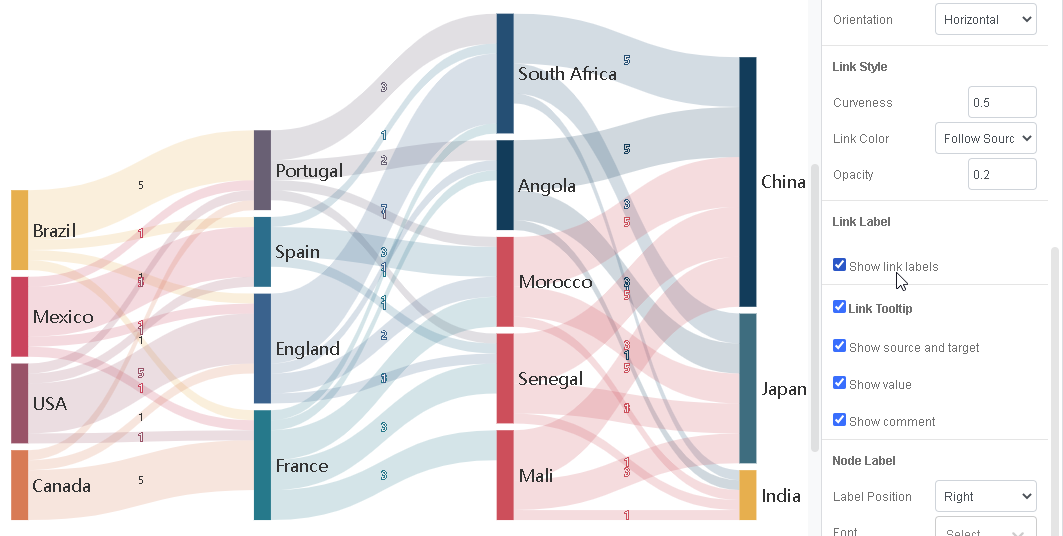
Showing the weight of links of a Sankey diagram can be a great way to provide a more accurate representation of the flow and aid in analysis. To display the weight of the links directly on the link, follow these steps:
- Select the same Sankey diagram.
- Open the Settings pane and click on the Chart tab.
- Scroll down and enable “Show Link Labels”. This will display the value of the link directly on the link in the diagram.
Creating Sankey Diagram with Visual Paradigm Online
Visual Paradigm Online features a chart maker that supports many different charts, including Sankey diagrams. Its Sankey diagram maker allows you to create professional Sankey diagrams quickly and easily. Click here to try creating your own Sankey diagram today.
This post is also available in Deutsche, Español, فارسی, Français, English, Bahasa Indonesia, 日本語, Polski, Portuguese, Ру́сский, Việt Nam, 简体中文 and 繁體中文.
