


Specify minimum & maximum value in gauge chart
Comprehensive Guide to Setting Minimum and Maximum Values for Gauge Charts in Visual Paradigm Online
Gauge charts are a popular visual representation used to display data in a visually appealing and intuitive manner. Visual Paradigm Online provides a convenient and user-friendly interface for creating and editing gauge charts. In this guide, we will explore how to specify the minimum and maximum values for gauge charts in Visual Paradigm Online, allowing you to customize the scale and range of your charts to suit your specific needs.
Accessing the Settings Panel
To begin setting the minimum and maximum values for your gauge chart, you first need to access the settings panel. Here’s how you can do it:
1. Open Visual Paradigm Online and navigate to the project or diagram where your gauge chart is located.
2. Locate the gauge chart you want to edit and select it.
Specifying the Minimum and Maximum Values
Once you have accessed the settings panel for your gauge chart, you can proceed to specify the minimum and maximum values. Follow these steps:
- In the settings panel, click on the \”Chart\” tab. This tab contains various options related to chart customization.

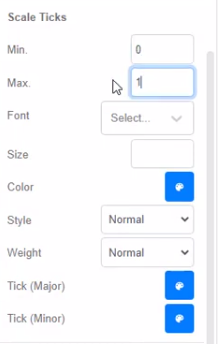
- Look for the \”Scale Ticks\” section within the \”Chart\” tab. Here, you will find the fields to input the minimum and maximum values for your gauge chart.
- Enter the desired minimum value in the \”Minimum\” field and the desired maximum value in the \”Maximum\” field. These values determine the range of your gauge chart.
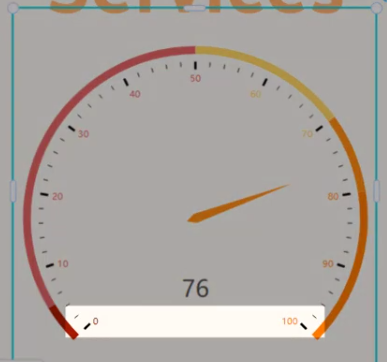
- After entering the minimum and maximum values, the gauge chart will be automatically updated to reflect the new scale and range.
In Visual Paradigm Online, you can easily create a beautiful gauge chart in minutes. With Visual Paradigm Online Chart Maker, you can specify minimum & maximum values in the gauge chart with just a few clicks. In this article, we will show you how to specify minimum & maximum values in a gauge chart with VP Online!
This post is also available in Deutsche, Español, فارسی, Français, English, Bahasa Indonesia, 日本語, Polski, Portuguese, Ру́сский, Việt Nam, 简体中文 and 繁體中文.
