


The Best Flowchart tool for Students in 2022
What is a Flowchart? Why it is still relevant to us today?
A flowchart is simply a graphical representation of the steps. It shows the steps in order and is widely used to show the flow of an algorithm, workflow, or process. Typically, flowcharts show the steps as various types of boxes with arrows connecting them in order. A flowchart is one of the most widely used diagrams that represents an algorithm, workflow or process, showing the steps in different boxes and connecting them in order by arrows. You can create a flowchart from scratch, or start directly from the flowchart template in our flowchart software.
When to Draw Flowchart?
Using a flowchart has a variety of benefits for businesses:
- It helps to clarify complex processes.
- It identifies steps that do not add value to the internal or external customer, including delays; needless storage and transportation; unnecessary work, duplication, and added expense; breakdowns in communication.
- It helps team members gain a shared understanding of the process and use this knowledge to collect data, identify problems, focus discussions, and identify resources.
- It serves as a basis for designing new processes.
Flowchart for Teaching and Learning Programming
When teaching programming to beginners, it is important for your students to understand how to make flowcharts. A flowchart is a diagram that uses shapes, lines, and arrows to arrange steps. It is a visual way to represent the input, output, decision-making and calculation in the program. There are many benefits to having a flowchart as part of the course. Find their educational value and useful strategies that can improve learning.
- When learning how to make a flowchart, it is best to start with a simple program that has only a few steps. It is best if the procedure is a linear process that does not include branches or loops. In addition, the task should be familiar so that students can learn from experience.
- Once students understand the basics of building a flowchart, they are ready for a more complicated task. It is now time to introduce a program that includes decision making.
- Now that students have a solid understanding of how to make a flowchart, they should add a loop. A loop repeats a set of instructions.
Flowcharting helps develop a number of skills in the classroom. Some of these skills include:
- Understanding what a sequence is.
- Understanding the different stages of reaching a goal.
- Understanding the connections between the different stages, and
- Understanding the final goal.
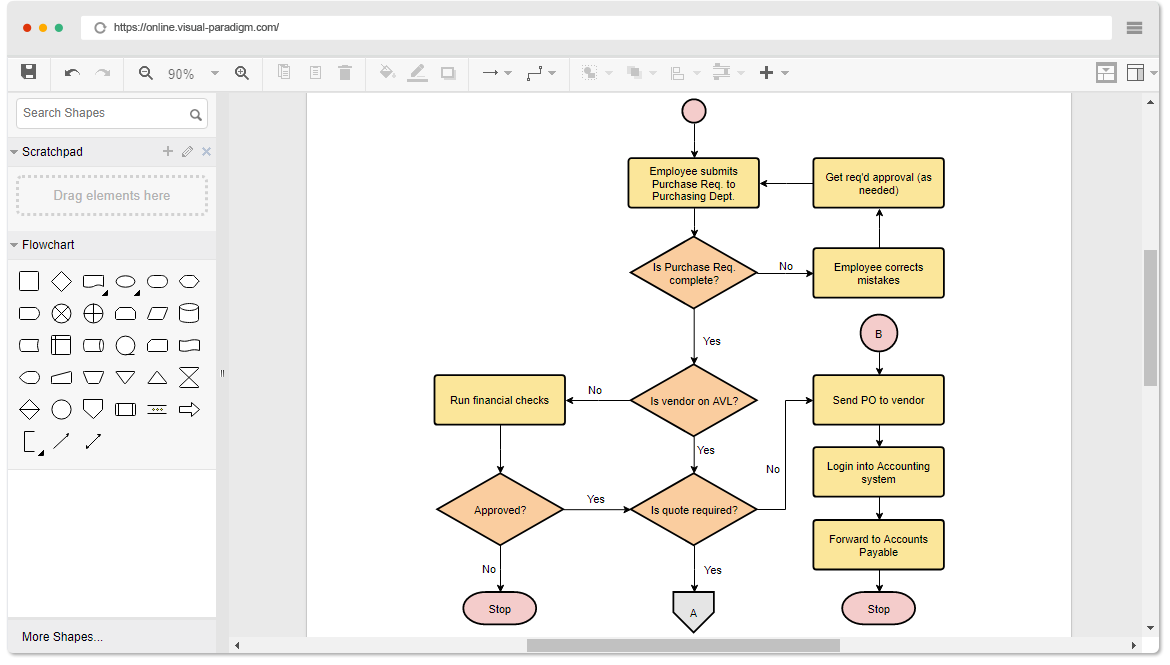
Visual Paradigm Online – The Best Free Flowchart Tool for Students, Schools and Educators
Visual Paradigm Online is an impressive set of lightweight diagramming tools that support a wide range of visualization needs. It features an intuitive user interface and a variety of powerful free flow charting tools that make software design easy and require no learning curve.
![]()
Draw quickly and easily
Online drawing can be easy and fun. Here are some of the editing features included in our intuitive flowchart editor:
- Drag and drop interface
- Connectors attached (no separate apart)
- Format Copier: Instant format copying
- Keep a lib of shape patterns for reusability
- Several hundreds of diagram templates
High-Quality Design
An array of powerful diagram tools are there to support you in creating stunning flowchart:
- Position shape precisely with alignment guide
- Include your own images, URL and text in diagrams
- Full set of shape and line format options
- Rotatable shapes
- Group, align and distribute tools
- Auto. form shape from text list
All-in-One Diagrammer
A full set of editing features are there to assist you in producing high quality result for use in your reports and presentations:
- Alignment guide for precise positioning
- Include images, URLs and text in diagrams
- Formatting options for shapes and lines
- Rotate shapes and text
- Group, align and distribute shapes
- Auto. create shape from text list
Design Collaboratively
Better teamwork with our team collaboration tools:
- Collaborative cloud workspace
- Projects and members management
- Export and share diagrams: PNG, SVG, PDF and more
- Single sign-on (SSO) integrations
- Keep your drawing in Google Drive
Key features and benefits
Try it out for yourself. Just browse through the flowchart example below, then click “Open Diagram” to open and edit it. You’ll see for yourself that it’s everything we said it would be, and maybe even more.
- Unlimited period of access
- Unlimited number of diagrams
- Unlimited number of shapes
- Easy to use: Drag-and-drop based interface, Format Copier, etc.
- Precise shape position with alignment guide
- Rich formatting options – Shape and line formats, 40+ connector types, RTF caption, font options, shadow effect, etc
- Great in printing or sharing: Export to PDF, PNG, JPG, and other formats.
- Cross-platform online flowchart tool. Supports Windows, Linux and Mac OS X.
- Save or share your flowcharts at anytime on your VP Online cloud workspace
- Visio alternative that supports importing Visio drawing and stencil
- Draw your own flowchart with custom shapes.
- Get a quick start by creating a new flowchart based on built-in templates
- Easy to insert notes, comments, external images and hyperlinks
- Integrated with MS products: Embed your diagram in Word and PPT and edit with ease.
- Value-added diagrams: Mind Map, Org. Chart, Floor Plan, UML, ERD, AWS, Google, Azure, etc
But don’t take our word for it
Try it yourself (Here). Just browse the flowchart examples below and click Open Diagram to open and edit. You will see for yourself that it is everything we say it is, or perhaps more.
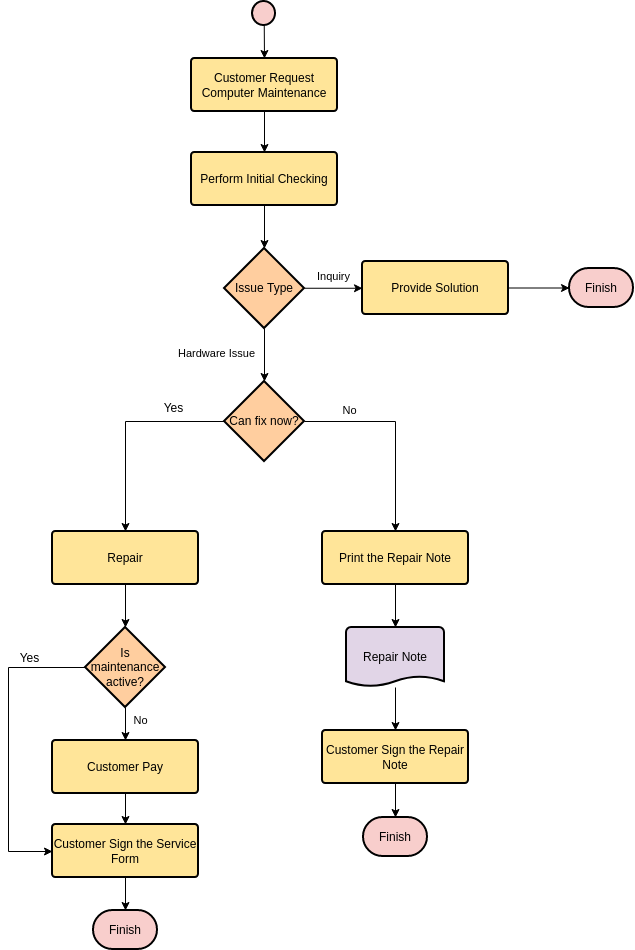
- Computer Maintenance
- Making Toast
- Medical Services
- University Application Process
- Solid Waste Processing
- Vacuum Cleaner
- Car Rental Service
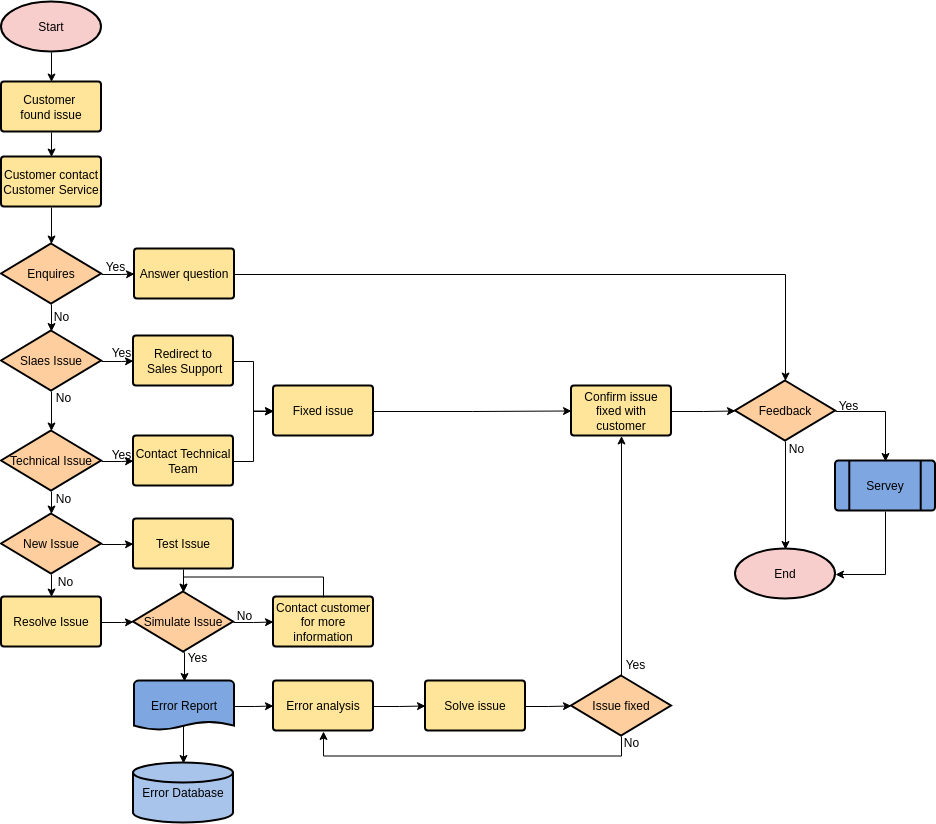
- Customer Service
This post is also available in Deutsche, Español, فارسی, Français, English, Bahasa Indonesia, 日本語, Polski, Portuguese, Ру́сский, Việt Nam, 简体中文 and 繁體中文.
