Uncovering the Power of Causal Loop Diagram
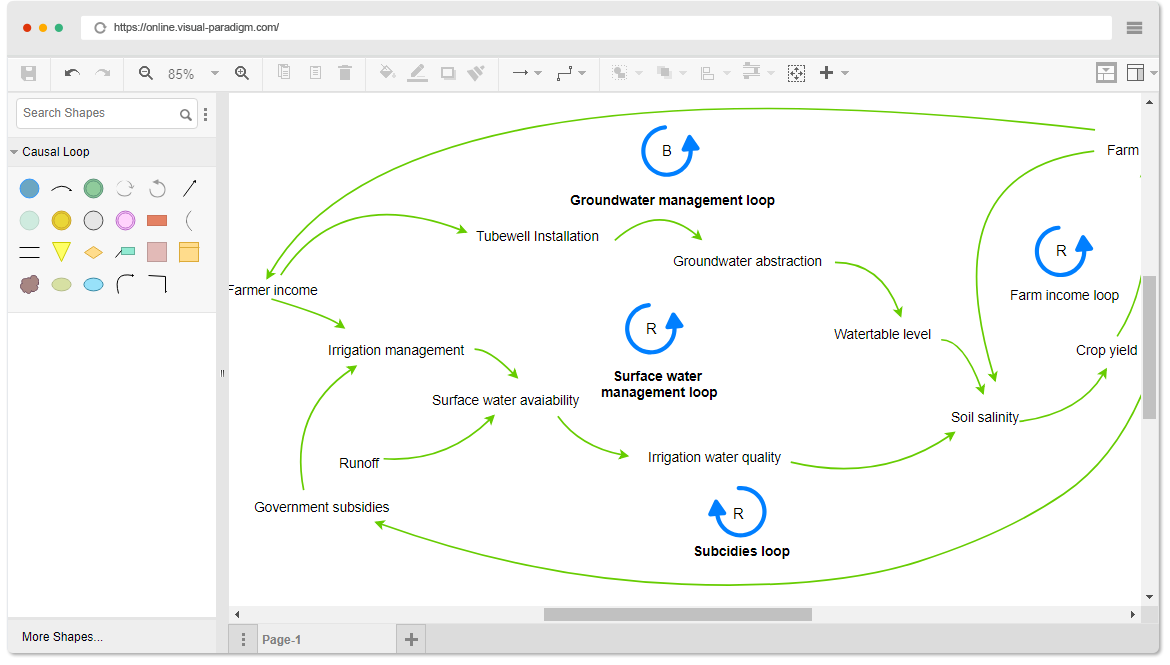
Causal loop diagram is a powerful tool for understanding the interactions of complex systems. It is developed by Jay Forrester, a pioneer in the field of systems thinking. Causal loop diagram provides a visual representation of cause-and-effect relationships within a system, which helps to identify the key drivers of change in a system, and provide greater insight into how different elements of the system interact to produce a particular outcome.

When to use Causal Loop Diagrams
Causal Loop Diagrams are particularly useful in a range of different situations, including:
- Understanding the relationships between different elements of a system
- Identifying the drivers of change in a system
- Modeling the feedback loops within a system
- Improving decision making by identifying the potential unintended consequences of proposed changes
- Communicating complex systems to stakeholders in a concise manner
Visual Paradigm Online: The Causal Loop Diagrams Maker

Visual Paradigm Online is a cloud-based platform that provides a range of tools for creating Causal Loop Diagrams. With Visual Paradigm Online, we can create Causal Loop Diagrams and share them quickly and easily with their stakeholders and team members.
The platform provides a range of symbols and elements to represent the key components of a Causal Loop Diagram, including stocks, flows, and feedback loops. We can also add labels and annotations to our diagrams to provide additional context and detail.
In addition to creating Causal Loop Diagrams, Visual Paradigm Online also supports a range of other diagram types, including flowcharts, UML diagrams, and BPMN diagrams. This makes it an ideal platform for software developers and other stakeholders involved in the software development lifecycle, as it supports the entire development process from requirements gathering to deployment.
Visualize cause-and-effect relationships and help identify the drivers of change in a system with VP Online Causal Loop Diagrams Maker now!
This post is also available in Deutsche, English, Español, فارسی, Français, Bahasa Indonesia, 日本語, Polski, Portuguese, Ру́сский, Việt Nam, 简体中文 and 繁體中文.


