


Unlocking the Power of Infographics with Visual Paradigm Online
Introduction
In an era where information is abundant and attention spans are fleeting, the need for effective communication has never been more crucial. This is where infographics come to the rescue, offering a visually appealing and efficient way to convey complex information. Whether you’re a business aiming to enhance your branding or an individual looking to spice up your resume, infographics have become an indispensable tool.
Understanding Infographics
At its core, an infographic is a visual representation of information or data. It blends imagery, charts, and minimal text to provide a quick and clear overview of a topic. The beauty of infographics lies in their ability to simplify complex concepts and present them in a format that is easily digestible.
The Three Pillars of Infographic Design
Before diving into the creation process, it’s essential to consider three key aspects: Data, Function, and Design. These elements, depicted in a Venn Diagram, form the foundation for crafting an impactful and informative infographic.
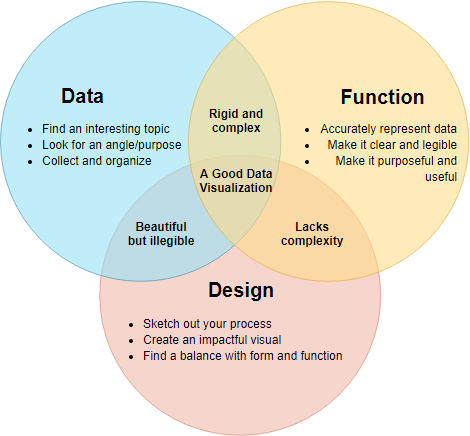
- Data: The information you want to convey.
- Function: The purpose or goal of your infographic.
- Design: The visual appeal and layout of your infographic.
Balancing these three aspects ensures that your infographic is not only visually pleasing but also effectively communicates the intended message.
Elements of Good Data Visualization
Creating an impressive infographic involves understanding the principles of good data visualization. The visual representation should be clear, concise, and relevant to the information being conveyed.
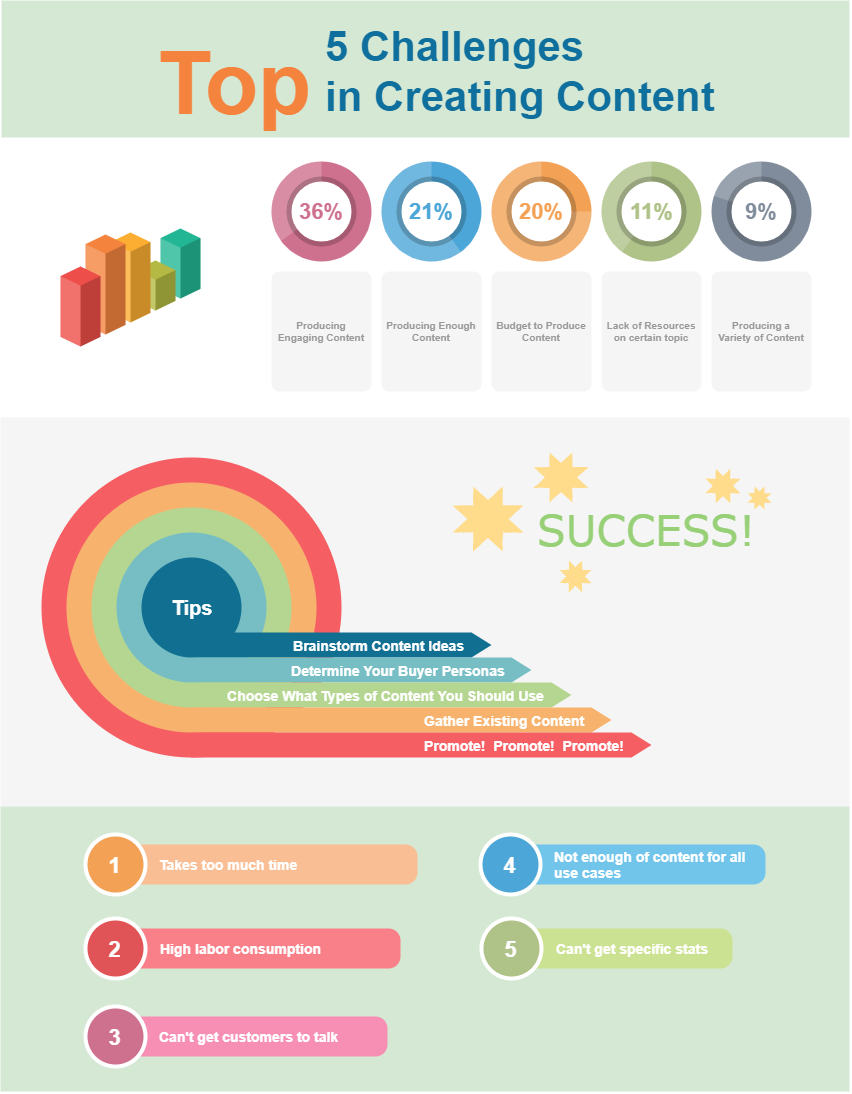
Infographic Example: Overcoming Content Creation Challenges
An illustrative example can be seen in a marketing infographic that addresses the challenges of creating new content. Divided into three compartments, it covers key figures and factors to consider, tips for creating impressive content, and the top five challenges one might face.
5-Step Process for Infographic Development
To guide you through the infographic creation process, follow these five steps:
- Brainstorm Content Ideas: Identify the key points you want to convey.
- Determine Your Buyers Personas: Understand your target audience.
- Choose Content Types: Decide on the types of content that will best convey your message.
- Gather Existing Content: Collect relevant data and information.
- Promote Your Products: Highlight your key messages and offerings.
Visual Paradigm Online: Your Infographic Ally
Creating infographics may seem daunting, but Visual Paradigm Online offers a simple and intuitive infographic maker that makes the process a breeze. Whether you lack design skills or need inspiration, their customizable infographic templates empower you to become an infographic pro. The editor allows you to add icons, images, customize text, and adjust fonts, enabling you to create eye-catching infographics in minutes.
Conclusion
As the demand for effective communication rises, infographics emerge as a powerful tool to convey information quickly and memorably. With Visual Paradigm Online, the journey of creating compelling infographics becomes accessible to everyone, transforming complex data into engaging visuals. Elevate your communication game with infographics and let Visual Paradigm Online be your creative companion in this visual journey.
This post is also available in Deutsche, Español, فارسی, Français, English, Bahasa Indonesia, 日本語, Polski, Portuguese, Ру́сский, Việt Nam, 简体中文 and 繁體中文.
