


Unraveling Complex Issues: The Power of Cause and Effect Analysis with Fishbone Diagrams
Introduction
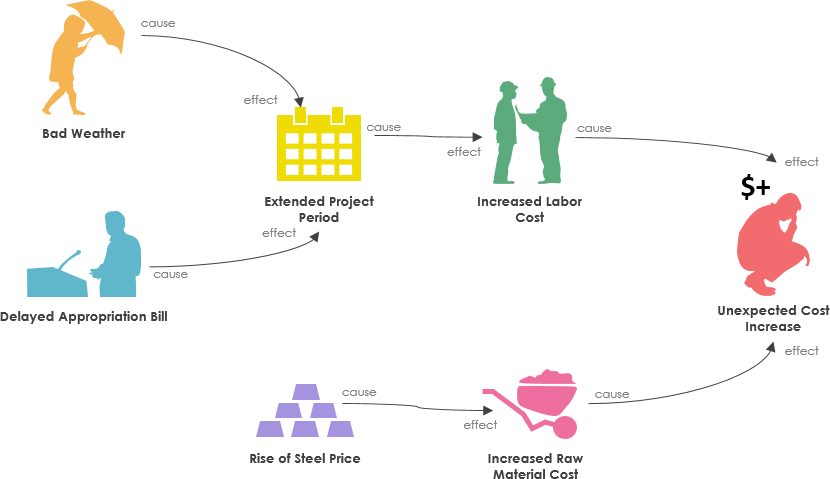
Cause and effect analysis is a powerful tool that allows individuals and teams to understand the intricate relationships between events or elements in a system. At the heart of this analytical approach lies the Fishbone Diagram, also known as the Cause and Effect Diagram or Ishikawa Diagram. This visual representation helps organize information and fosters a comprehensive exploration of potential causes and effects related to a specific problem.
Understanding the Fishbone Diagram
- Purpose and Structure:
- The Fishbone Diagram serves as a visual representation of cause-and-effect relationships.
- It organizes a vast amount of information, showcasing links between events and their potential or actual causes.
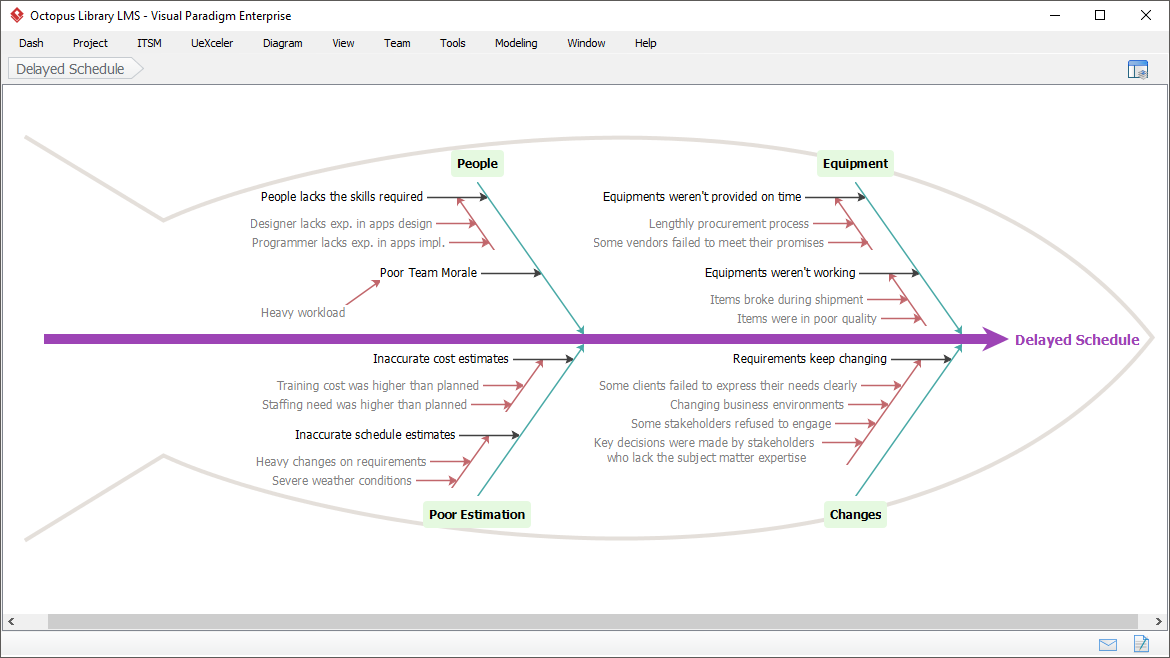
- The diagram consists of a central spine representing the problem, with branches extending outward to depict major categories of causes.
- Fishbone Categories:
- The major categories of causes, represented as branches, include equipment or supply factors, environmental factors, rules/policy/procedure factors, and people/staff factors.
- These categories provide a framework for brainstorming and categorizing potential causes.
- Application:
- It is most helpful in collaborative team processes for brainstorming and generating consensus about causes.
- Useful when identifying possible causes for a problem or understanding contributing factors or causes of a system failure.
Steps for Creating a Fishbone Diagram
- Identify the Problem Statement:
- Clearly articulate the problem at the mouth of the fish.
- Identify Major Categories:
- List major categories of causes as branches from the main arrow.
- Brainstorm Possible Causes:
- Ask “Why does this happen?” and write causes as branches from the appropriate category.
- Explore Sub-Causes:
- Use the 5 Whys technique to drill down into deeper levels of causes, uncovering root causes.
- Consensus Building:
- The diagram allows everyone’s ideas to find a place, fostering consensus about the causes of the problem.
Combining the Fishbone Diagram with the 5 Whys Technique
- 5 Whys Technique:
- An iterative questioning technique to drill down to the root cause of a problem.
- Used in conjunction with the Fishbone Diagram for a more thorough analysis.
- Example:
- If the problem is a car stopping in the middle of the road:
- The 5 Whys lead to the root cause: a lack of skill in “bluffing” during a poker game.
- If the problem is a car stopping in the middle of the road:
Conclusion
Cause and effect analysis, particularly through the Fishbone Diagram and the 5 Whys technique, provides a structured approach to problem-solving. By visually representing and exploring the relationships between causes and effects, teams can gain a deeper understanding of complex issues and identify effective solutions. The collaborative nature of this process ensures that diverse perspectives contribute to a comprehensive analysis, ultimately leading to more informed decision-making and problem resolution.
This post is also available in Deutsche, Español, فارسی, Français, English, Bahasa Indonesia, 日本語, Polski, Portuguese, Ру́сский, Việt Nam, 简体中文 and 繁體中文.
