


Unraveling Genetic Mysteries: The Power of Pedigree Charts in Tracing Traits Through Generations
Introduction
In the intricate tapestry of genetics, the pedigree chart stands as a vital tool, allowing geneticists to navigate through the threads of inheritance, unraveling the story of traits passed down from one generation to the next. Whether applied to humans, show dogs, or racehorses, the pedigree chart serves as a visual roadmap, illuminating the occurrence and appearance of specific genes or organisms and their ancestors. This comprehensive article aims to delve into the significance of pedigree charts, exploring their role in tracing inherited traits, especially in the context of human genealogy.
Understanding Pedigree Charts
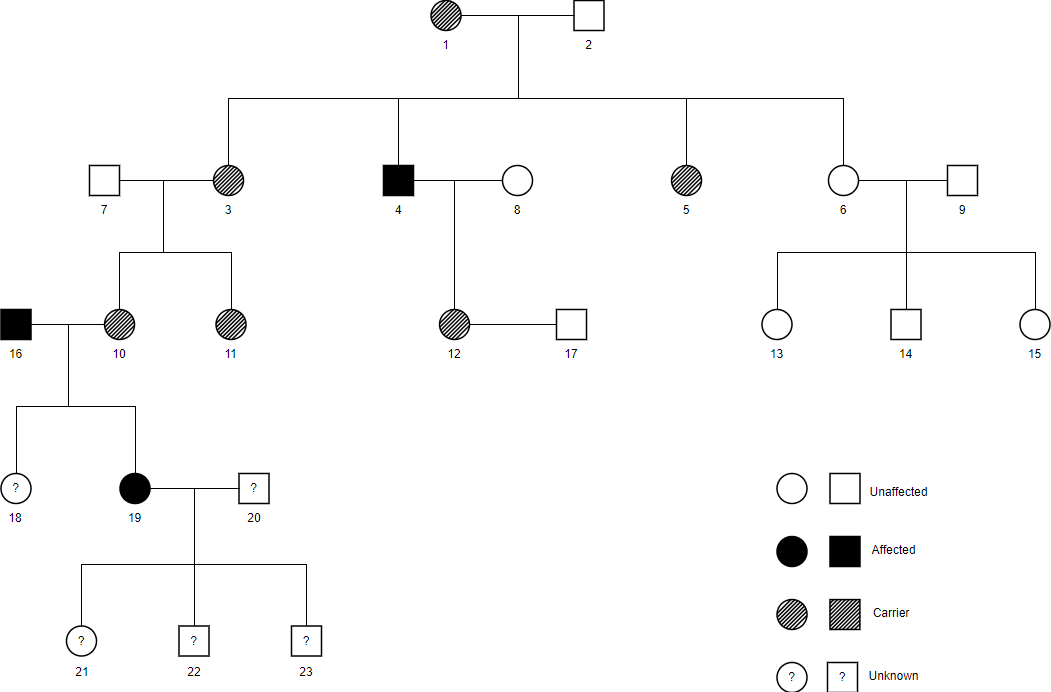
At its core, a pedigree chart is a diagram that captures the genetic relationships within a family or a lineage. It not only depicts the current generation but also provides a historical snapshot by showcasing ancestors and their respective traits. The chart typically uses symbols and lines to represent individuals and their connections, offering a visual representation of the flow of genetic information across generations.
Elements of Pedigree chart
let’s break down the key elements of a pedigree chart based on the information you provided:
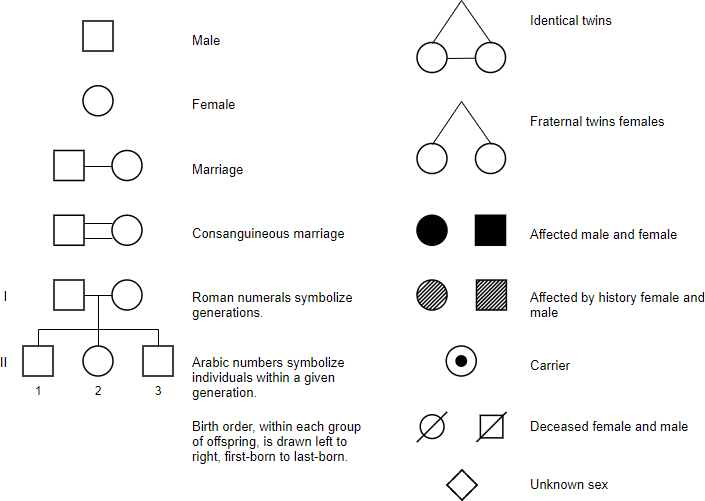
- Symbols:
- Squares: Represent males in the pedigree.
- Circles: Represent females in the pedigree.
- Diamonds: Used when the sex of the person is unknown.
- Phenotype Representation:
- Someone with the phenotype in question is represented by a filled-in (darker) symbol.
- Heterozygotes:
- When identifiable, heterozygotes are indicated by a shaded dot inside a symbol or a half-filled symbol.
- Relationships:
- Relationships in a pedigree are shown as a series of lines.
- Parents are connected by a horizontal line, and a vertical line leads to their offspring.
- Offspring:
- The offspring are connected by a horizontal sibship line.
- They are listed in birth order from left to right.
- If the offspring are twins, they will be connected by a triangle.
- If an offspring dies, its symbol will be crossed by a line.
- If the offspring is stillborn or aborted, it is represented by a small triangle.
These standardized symbols and lines create a visual language that geneticists and researchers can use to interpret the complex patterns of inheritance within a family or lineage. The careful arrangement of symbols and lines on a pedigree chart allows for a systematic representation of genetic information, aiding in the analysis of traits and their passage through generations.
The Human Connection
One of the most common applications of pedigree charts is in human genetics. Geneticists and genealogists alike use these charts to trace the inheritance of specific traits or genetic conditions through multiple generations of a family. By meticulously documenting the presence or absence of traits in individuals, researchers can gain insights into the patterns of inheritance, helping to identify whether a trait is dominant, recessive, or influenced by complex interactions of multiple genes.
The Power of Symbols
Pedigree charts employ a standardized set of symbols to represent different individuals and their characteristics. Squares typically denote males, while circles signify females. Specific symbols indicate traits such as genetic disorders or other significant features. Connecting lines illustrate relationships, offering a clear visualization of familial connections and the passage of genetic information.
Navigating Genetic Complexity
As memories fade and details about earlier generations become uncertain, pedigree charts become invaluable tools for reconstructing a family’s genetic history. They help researchers overcome challenges posed by incomplete records or limited information, offering a systematic approach to unraveling genetic mysteries.
Beyond Humans: Pedigree Charts in Animal Breeding
While often associated with human genetics, pedigree charts find widespread use in animal breeding, particularly in the realms of show dogs and racehorses. Breeders leverage these charts to make informed decisions about pairing individuals to enhance desirable traits and eliminate undesirable ones. The charts serve as blueprints for selective breeding programs, ensuring the propagation of superior genetic characteristics across generations.
Explore more Pedigree Chart templates


Conclusion
In the realm of genetics, the pedigree chart emerges as a powerful tool, bridging the past and present to illuminate the pathways of genetic inheritance. Whether used in human genealogy or animal breeding, these charts provide a structured framework for understanding the complexities of genetics. As technology advances and our understanding of genetics deepens, the humble pedigree chart continues to be an indispensable companion in the journey to unlock the secrets encoded in our DNA.
This post is also available in Deutsche, Español, فارسی, Français, English, Bahasa Indonesia, 日本語, Polski, Portuguese, Ру́сский, Việt Nam, 简体中文 and 繁體中文.
