


Visual Paradigm Online: The Ultimate Diagramming Tool for Businesses and Individuals
Introduction:
Online diagramming tools have become an essential requirement for businesses and individuals in the digital age. These tools help in creating and sharing diagrams, flowcharts, and other visual representations, which are crucial for conveying complex ideas and processes in a simplified manner. In this article, we will discuss Visual Paradigm Online, which is one of the best online diagramming tools available in the market.
Advantages:
Visual Paradigm Online has a host of advantages that make it a preferred choice for many businesses and individuals. One of the main advantages of this tool is that it has both free and commercial editions, which means that it caters to a wide range of users with varying needs and budgets. Moreover, it is cloud-based, which means that users can access it from anywhere, anytime, without the need to download or install any software.
Features:
Visual Paradigm Online offers a wide range of features that make it a versatile and powerful tool. Some of the key features include:
- Diagramming: This tool offers support for a variety of diagrams, including flowcharts, UML diagrams, ER diagrams, network diagrams, and more.
- Collaboration: Users can collaborate on diagrams in real-time with team members, which makes it ideal for remote teams.
- Templates: The tool offers a variety of pre-built templates for different types of diagrams, which saves time and effort in creating them from scratch.
- Customization: Users can customize their diagrams with a range of options, including colors, fonts, shapes, and more.
Versatile Diagram Types Supported by Visual Paradigm Online
Visual Paradigm Online supports a wide range of diagram types, including:
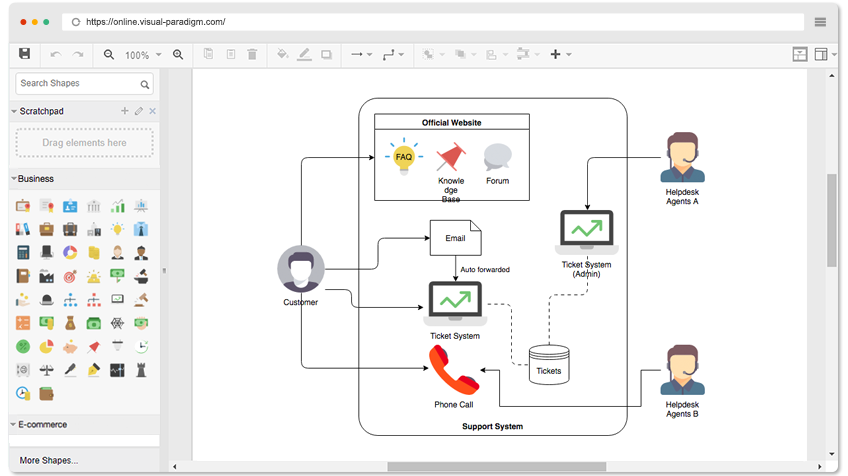
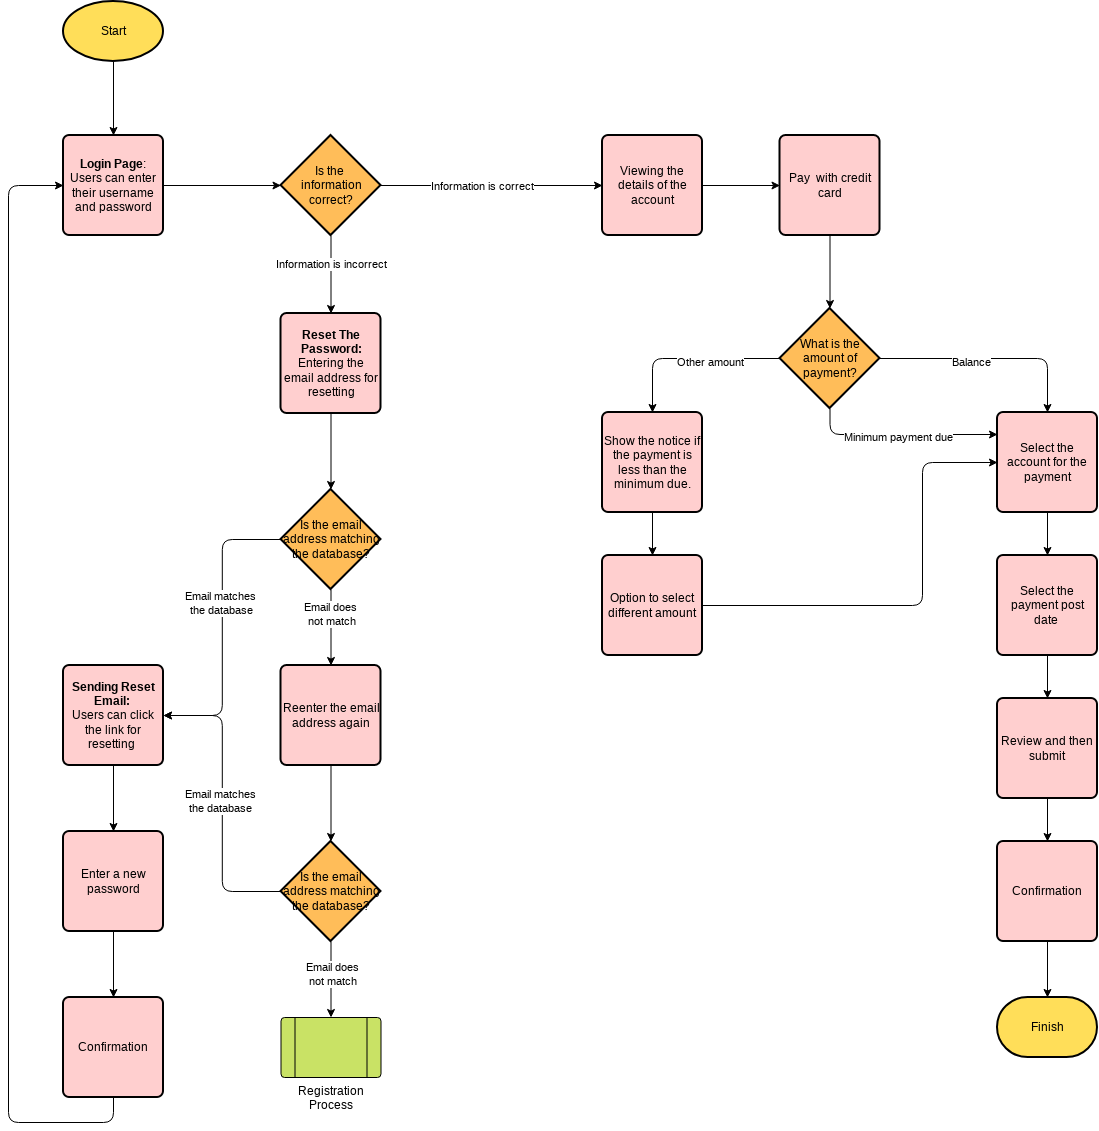
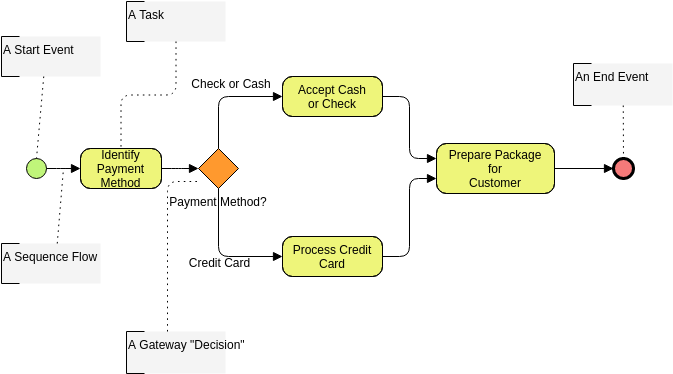
- Flowcharts – A flowchart is a graphical representation of a process or algorithm, showing the steps as boxes of various shapes connected by arrows. The flowchart illustrates the flow of control within a system, and it is often used to describe complex processes or systems.
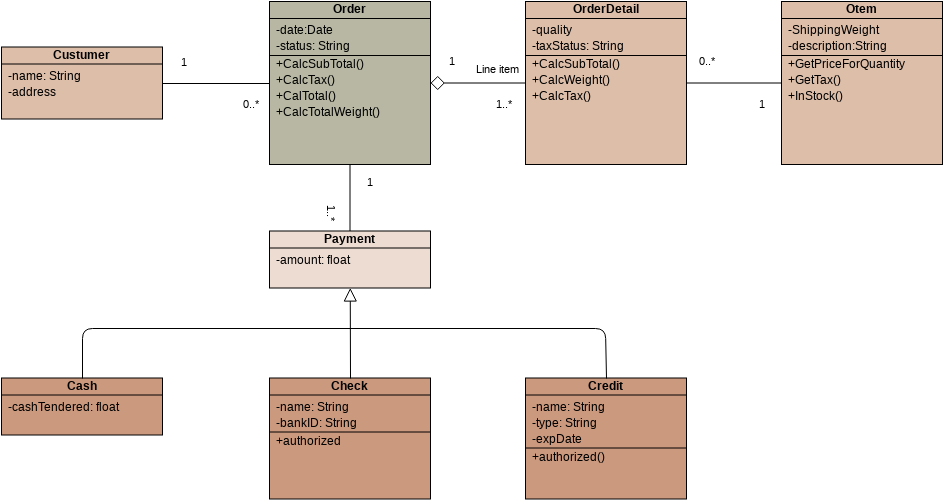
- UML diagrams (class, use case, sequence, activity, state, component, and deployment diagrams) – UML (Unified Modeling Language) diagrams are a standardized way of visualizing and designing software systems. There are several types of UML diagrams, including class diagrams, use case diagrams, sequence diagrams, activity diagrams, state diagrams, component diagrams, and deployment diagrams, each with its own purpose.
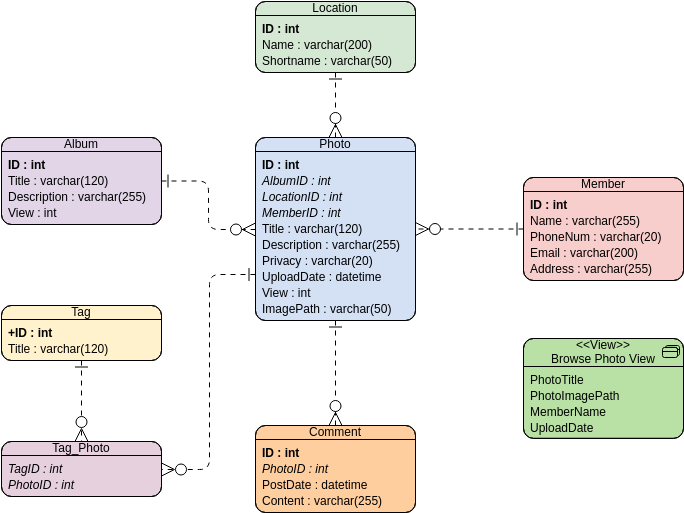
- ER diagrams (entity-relationship diagrams) – An ER (Entity-Relationship) diagram is a type of data modeling diagram used to represent entities and their relationships to one another. ER diagrams are often used in database design to describe the structure of a database.
- Network diagrams – Network diagrams are used to visualize and plan computer networks. They show the devices and connections between them, and they are useful for troubleshooting network issues and for documenting network configurations.
- BPMN diagrams (business process model and notation diagrams) – BPMN (Business Process Model and Notation) diagrams are used to model and analyze business processes. They provide a standard way to describe the steps and interactions involved in a business process, and they can be used to identify areas for improvement and optimization.
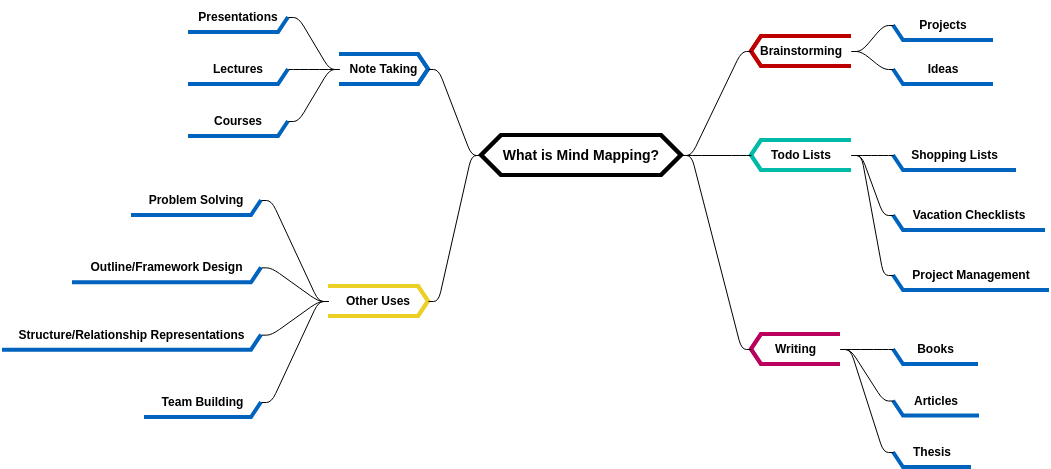
- Mind maps – A mind map is a visual tool used to organize and structure ideas. It consists of a central idea or theme, with related ideas branching out from it. Mind maps are useful for brainstorming, note-taking, and organizing complex information.
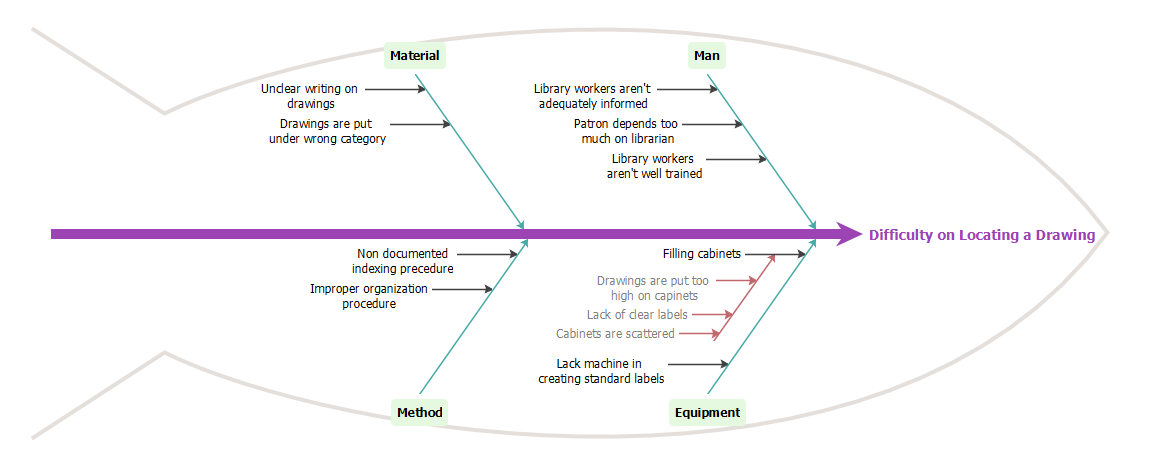
- Fishbone diagrams – A fishbone diagram, also known as an Ishikawa diagram or a cause-and-effect diagram, is a tool used to identify the root causes of a problem or issue. The diagram shows the main causes and sub-causes of the problem, with branches leading to the possible causes.
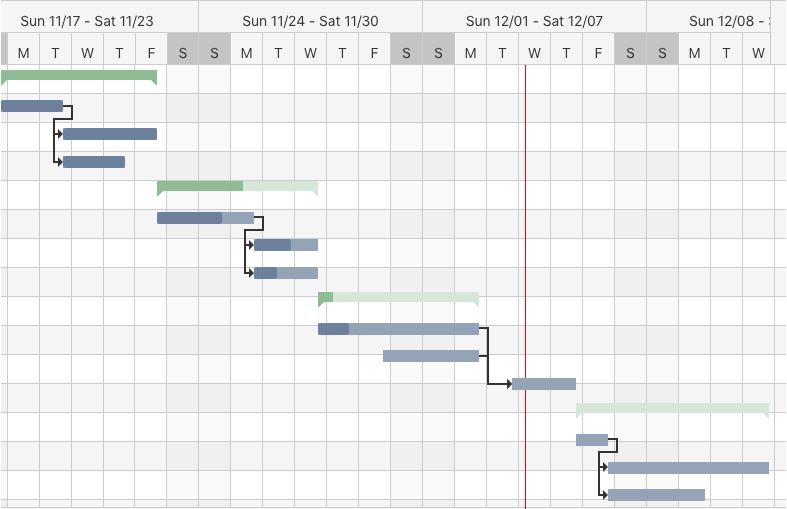
- Gantt charts – A Gantt chart is a type of bar chart used to visualize a project schedule. It shows the tasks involved in a project, their duration, and their dependencies. Gantt charts are useful for project management and for tracking progress against a timeline.
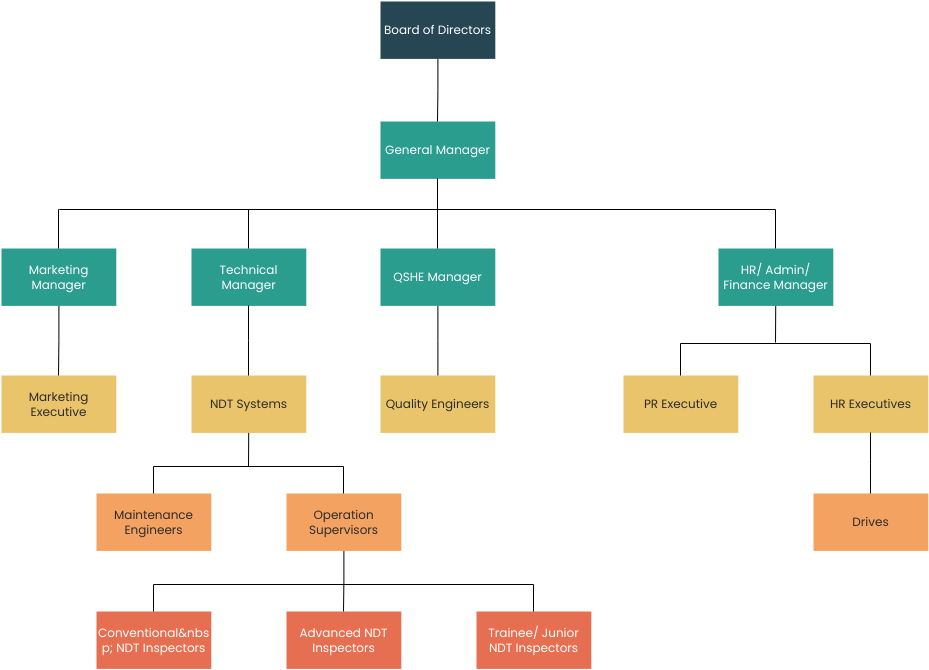
- Organization charts – An organization chart, also known as an org chart, is a diagram that shows the structure of an organization. It typically shows the hierarchy of positions within the organization, with boxes representing employees and lines indicating their relationships to one another.
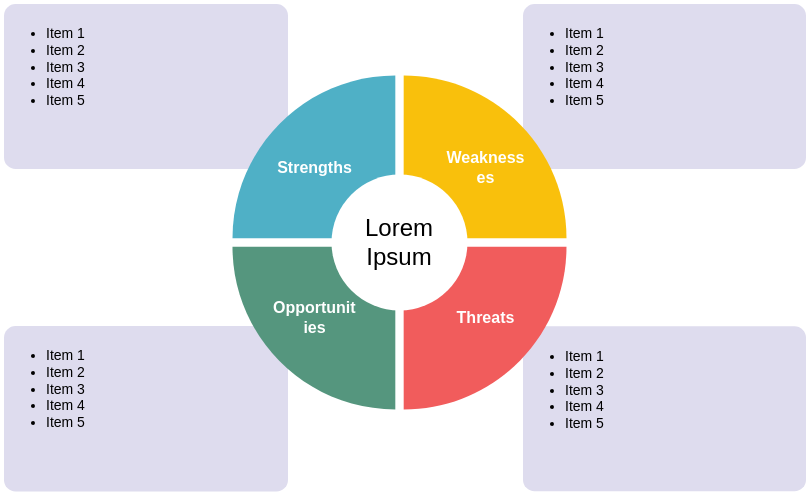
- SWOT analysis diagrams – A SWOT analysis diagram is a tool used to evaluate the strengths, weaknesses, opportunities, and threats of a business or project. The diagram consists of four quadrants, each representing one of these factors.
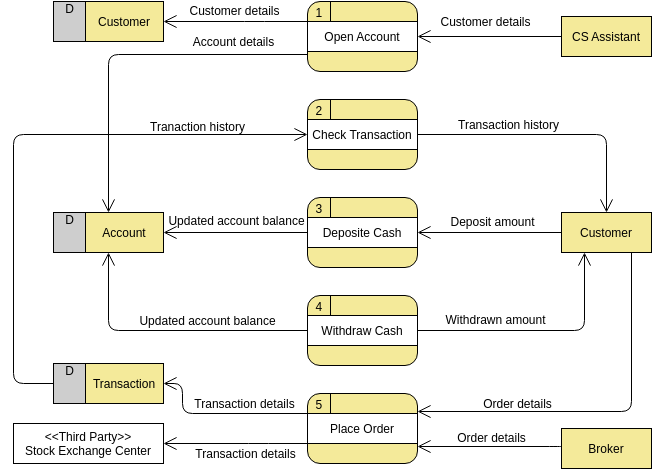
- Data flow diagrams – Data flow diagrams: A data flow diagram (DFD) is a graphical representation of the flow of data through a system. It shows the inputs, outputs, and processes involved in a system, and it is often used in software design and development.
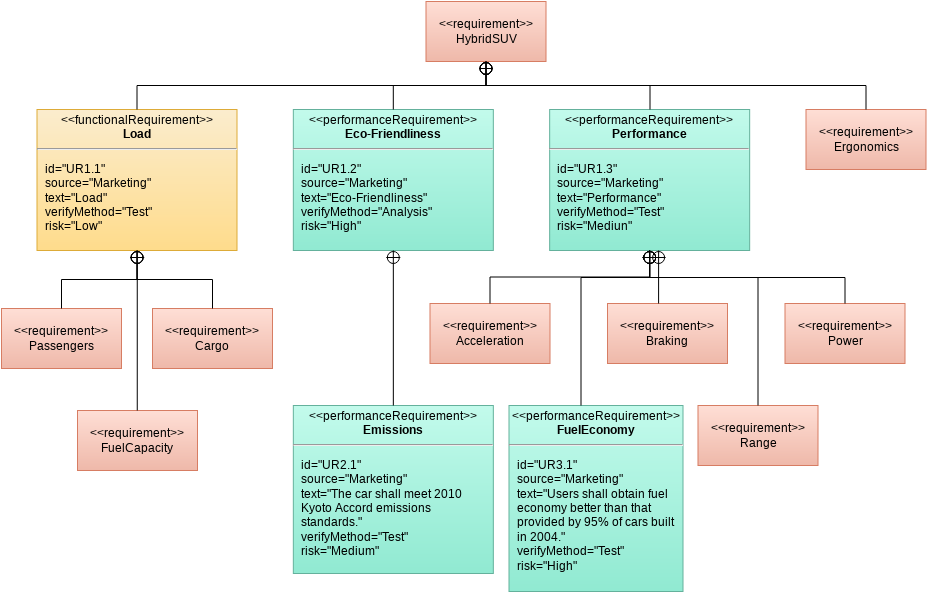
- Requirement diagrams – A requirement diagram is used to define the functional and non-functional requirements of a system. It shows the relationships between the requirements, and it is often used to ensure that all requirements have been addressed and to manage changes to the requirements.
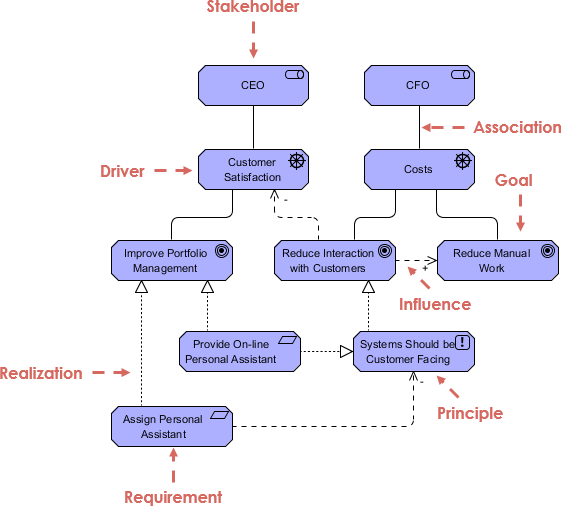
- ArchiMate diagrams – ArchiMate is a language for enterprise architecture modeling. ArchiMate diagrams are used to model the components of an enterprise architecture, including business, application, and technology components.
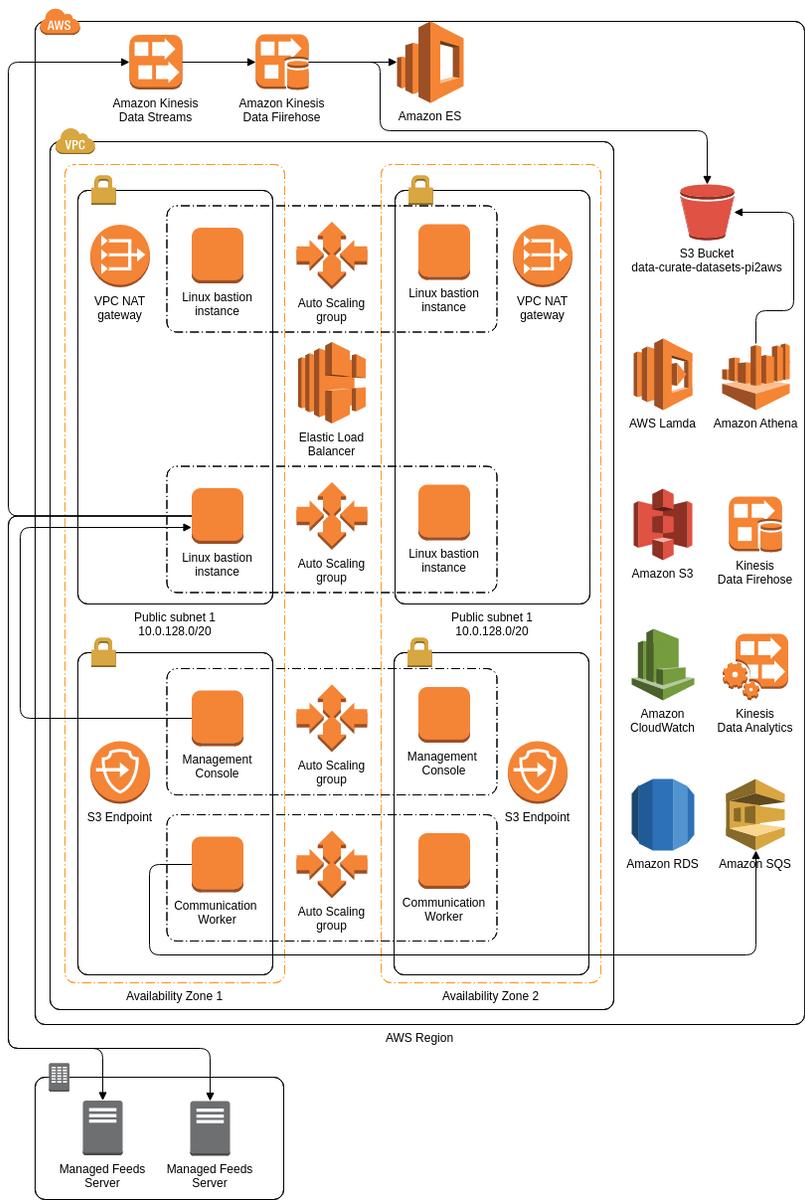
- AWS architecture diagrams _ AWS (Amazon Web Services) architecture diagrams are used to visualize the components and relationships of an AWS-based system. They show the various AWS services and how they are used in the system.
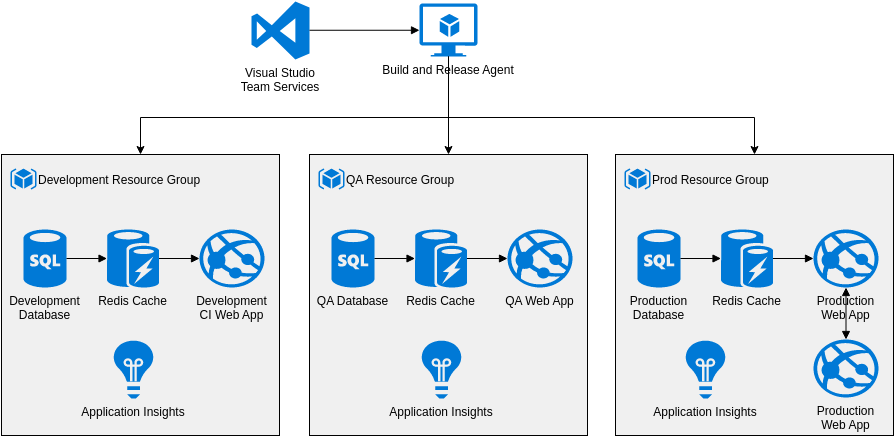
- Azure architecture diagrams – Azure architecture diagrams are similar to AWS architecture diagrams, but they show the components and relationships of a system based on Microsoft Azure.
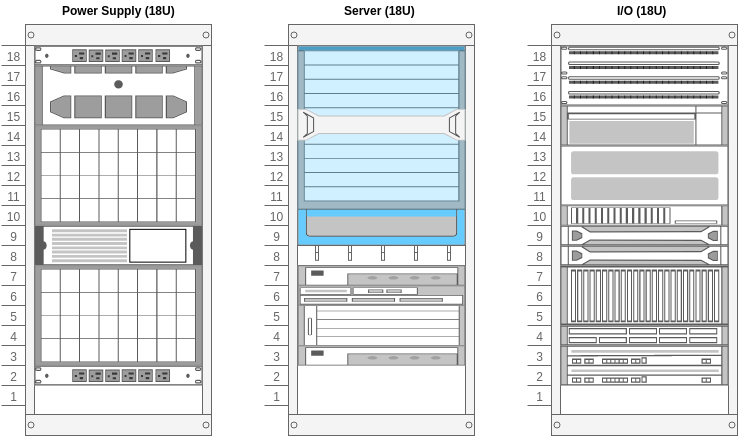
- Rack diagrams – A rack diagram is used to show the physical layout of a computer or network equipment rack. It shows the devices installed in the rack and their connections to one another.

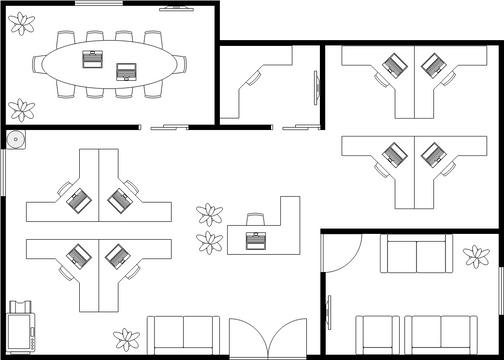
- Floor plans – A floor plan is a diagram that shows the layout of a building or space. It includes the placement of walls, doors, windows, and furniture, as well as other architectural features such as stairs and elevators. Floor plans are often used in architecture and interior design to help visualize and plan the use of space. They can also be used to estimate costs and to communicate design ideas to clients or contractors.
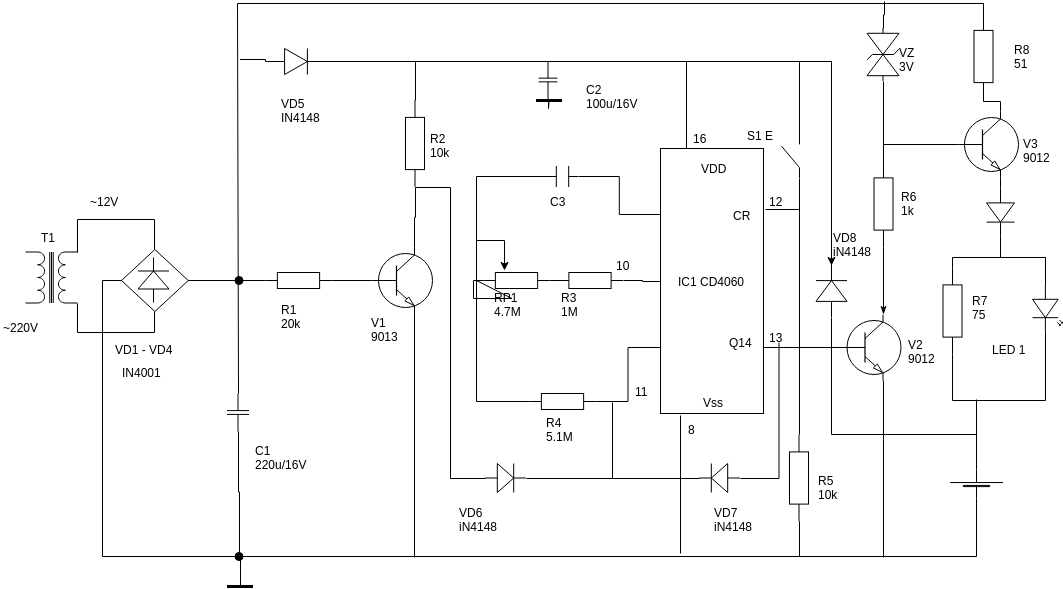
- Electrical diagrams – Electrical diagrams, also known as circuit diagrams or schematics, are graphical representations of electrical circuits. They show the components of the circuit, such as resistors, capacitors, and switches, and the connections between them. Electrical diagrams are commonly used in engineering and electronics to design and troubleshoot circuits.
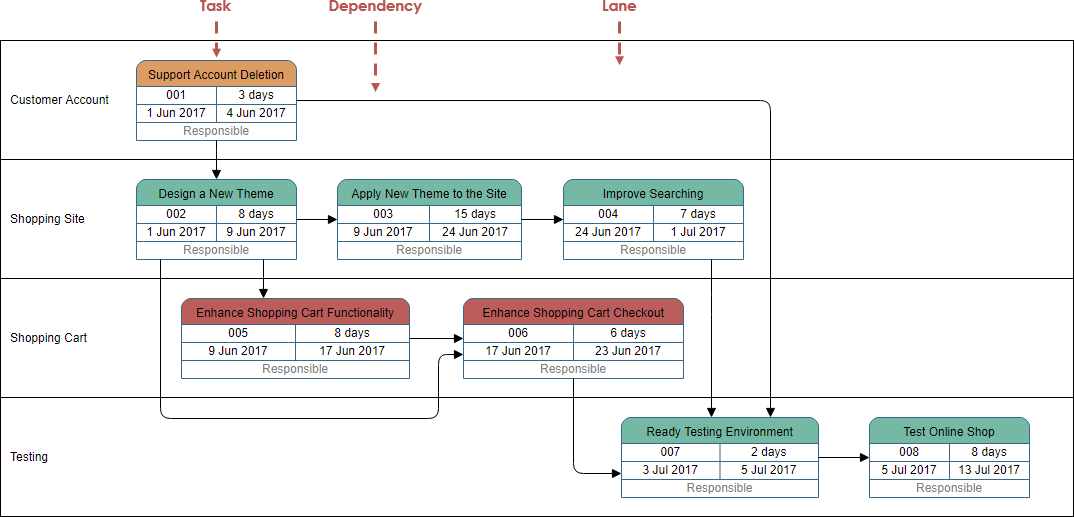
- PERT charts – PERT (Program Evaluation and Review Technique) charts are project management tools used to plan and schedule tasks. They show the dependencies between tasks, the estimated duration of each task, and the critical path of the project. PERT charts are useful for identifying potential delays and bottlenecks in a project and for tracking progress against a timeline.
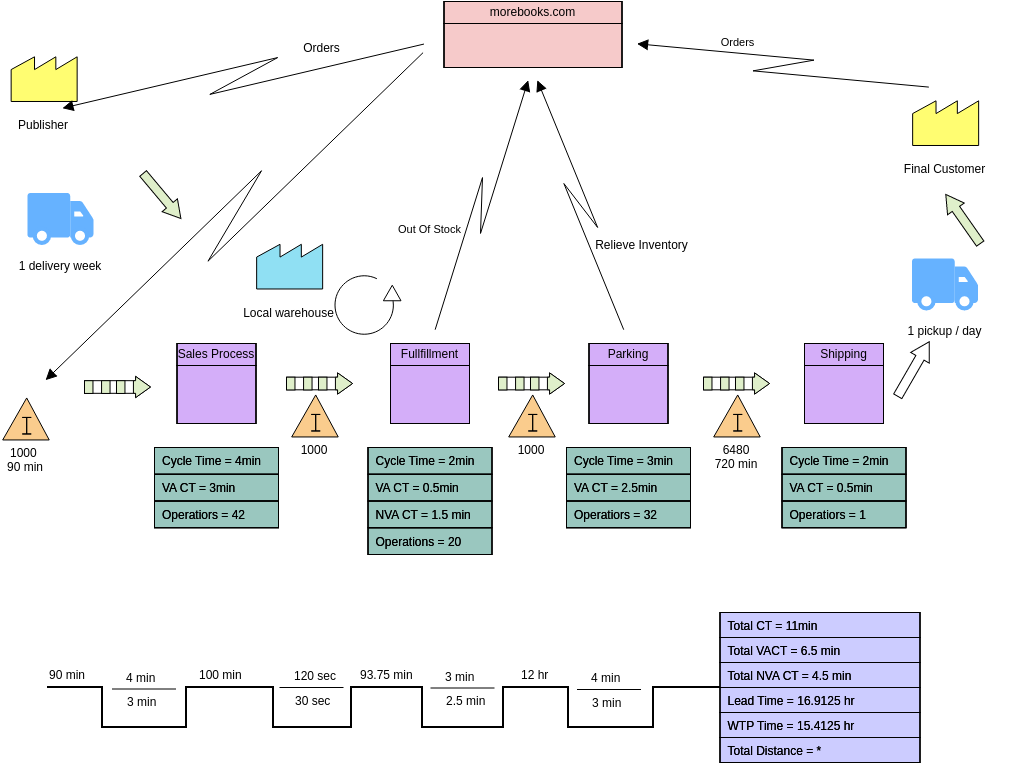
- Value stream maps – Value stream maps are used in lean manufacturing and business process improvement to visualize the flow of materials and information through a process. They show the inputs, outputs, and steps involved in a process and can be used to identify areas for improvement, reduce waste, and increase efficiency.
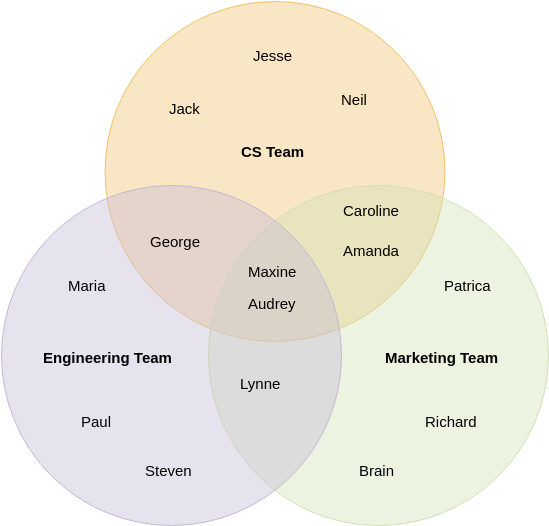
- Venn diagrams – Venn diagrams are used to show the relationships between sets of objects or concepts. They consist of overlapping circles, with each circle representing a set and the overlap representing the intersection between the sets. Venn diagrams can be used to illustrate logical relationships, such as inclusion, exclusion, and overlap, and they are commonly used in mathematics, logic, and statistics.
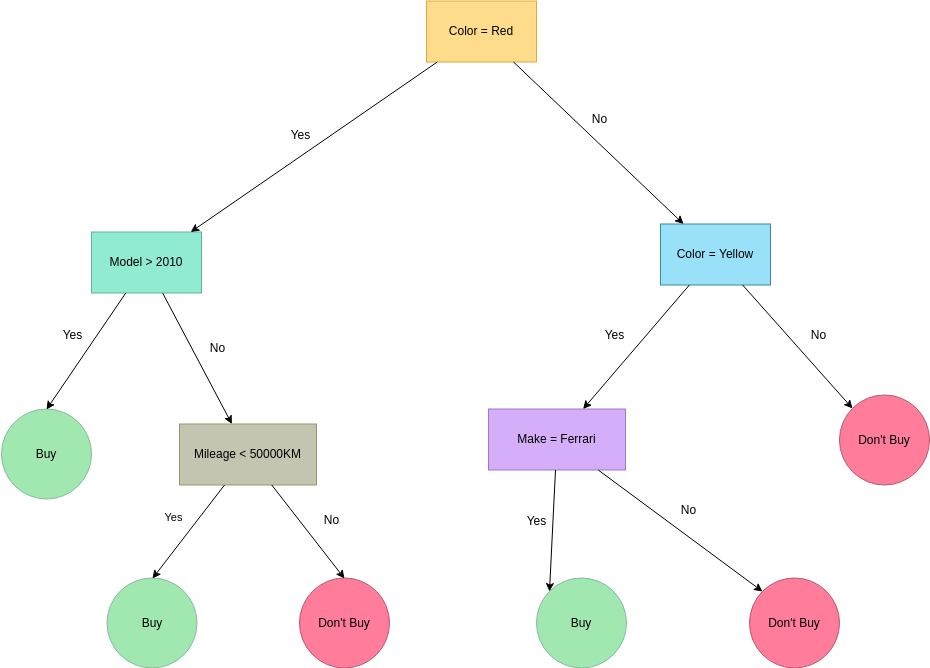
- Decision trees – Decision trees are graphical representations of decision-making processes. They consist of nodes representing decisions or events, with branches connecting the nodes to show the possible outcomes. Decision trees can be used to model complex decision-making processes, such as risk analysis, investment planning, and strategic decision-making.
- Concept maps – Concept maps are graphical representations of ideas and their relationships to one another. They consist of nodes representing concepts or ideas, with lines connecting the nodes to show the relationships between them. Concept maps can be used to organize and structure complex information, to facilitate learning and understanding, and to brainstorm ideas.

These are just a few examples of the many diagram types that Visual Paradigm Online supports.
Why is it the best choice in the market?
Visual Paradigm Online stands out as the best choice in the market due to its comprehensive features, ease of use, and affordable pricing. The tool offers a wide range of diagramming options and templates, making it easy to create professional-looking diagrams quickly. Moreover, its cloud-based nature makes it accessible from anywhere, which is essential for remote teams.
Conclusion:
Visual Paradigm Online is an excellent choice for anyone looking for a powerful and versatile online diagramming tool. With its comprehensive features, excellent support, and affordability, it is a great tool for businesses of all sizes and individuals alike. Whether you need to create flowcharts, UML diagrams, ER diagrams, or any other type of diagram, Visual Paradigm Online has got you covered.
Visual Paradigm Online is a cloud-based platform that offers a comprehensive set of diagramming tools for modeling and development work. It is known for having the largest collection of diagrams supported in the market, making it a versatile and flexible tool for various industries and purposes.
With Visual Paradigm Online, users can access a wide range of diagram types, including UML diagrams, flowcharts, ER diagrams, network diagrams, BPMN diagrams, mind maps, Gantt charts, organization charts, and more. This extensive collection of diagramming tools allows users to choose the most appropriate visualization method for their specific needs.
One of the key advantages of Visual Paradigm Online is that it is an online platform, which means users can access it from anywhere without the need for installation or setup. This makes it easy to collaborate with team members in different locations, as well as to work on projects remotely.
In summary, Visual Paradigm Online is a powerful and versatile diagramming tool that offers a comprehensive set of diagram types, making it suitable for various modeling and development purposes. Its online cloud platform makes it accessible from anywhere and eliminates the need for installation, making it a convenient and user-friendly tool for teams and individuals.
This post is also available in Deutsche, Español, فارسی, Français, English, Bahasa Indonesia, 日本語, Polski, Portuguese, Ру́сский, Việt Nam, 简体中文 and 繁體中文.
