Home » Graphic Design » Page 11
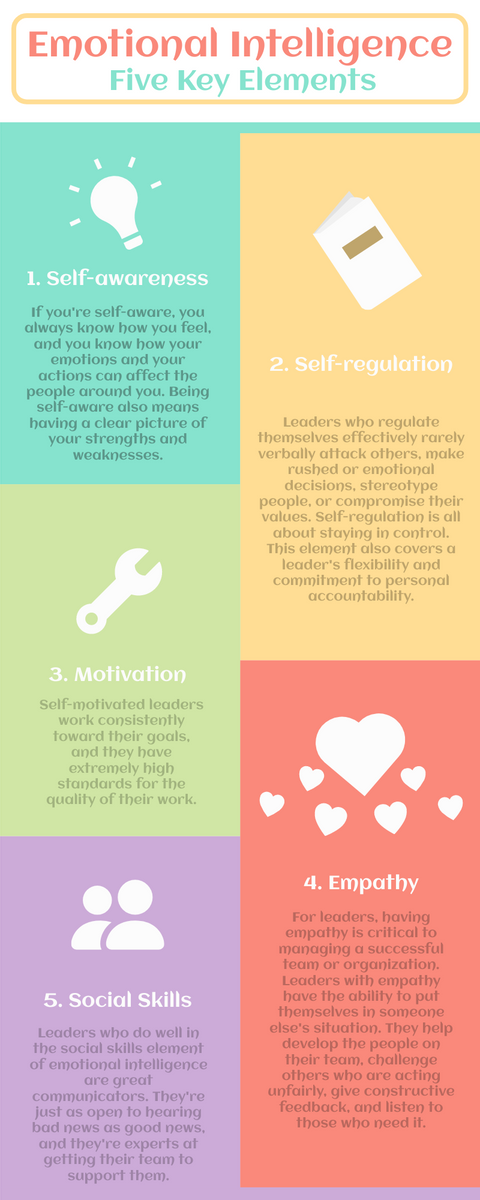
Our "Five Key Elements Of Emotional Intelligence Infographic" is a visually stunning and informative graphic that highlights the essential elements of emotional intelligence. The design is clean and modern, utilizing a color palette that is both visually appealing and easy on the eyes. The theme of this infographic is perfect for businesses and organizations that want to promote a more emotionally intelligent workplace culture. Visual Paradigm Online is a fantastic tool for creating high-quality infographics like this one. With its intuitive interface and user-friendly design, anyone can easily create a professional-looking infographic with…
continue reading →
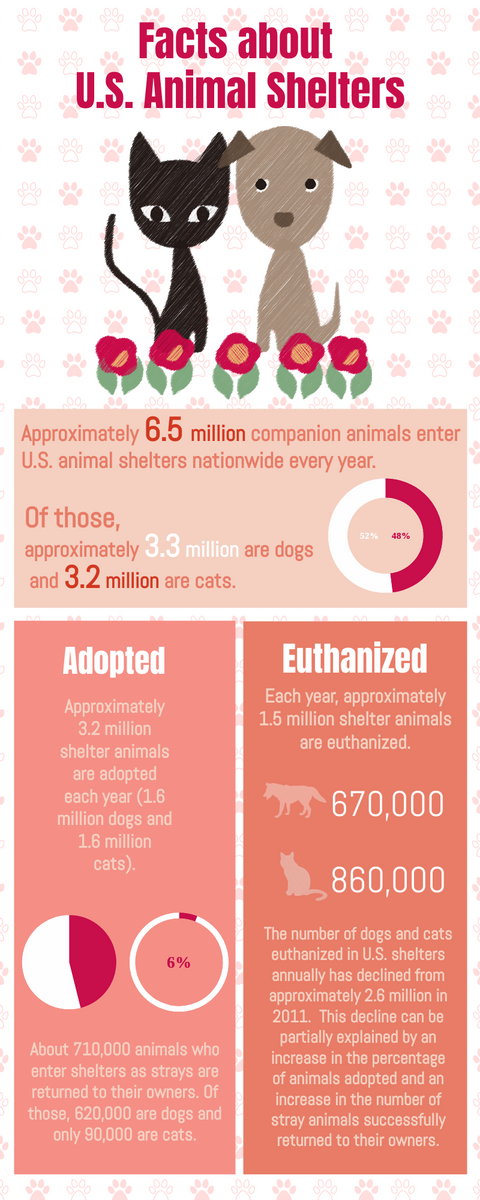
Introducing the "Facts about U.S. Animal Shelters infographic," created using Visual Paradigm Online - an innovative online infographic maker that empowers users to design stunning visuals with ease. This infographic delivers a visually pleasing and informative design that aims to raise awareness about animal shelter facts in the United States. The theme includes data on animal shelter demographics, adoptions, and statistics related to animal care. The infographic is designed with an appealing color scheme, eye-catching icons, and easy-to-read fonts that bring together a professional and modern look. Customize this Infographic Template Visual…
continue reading →
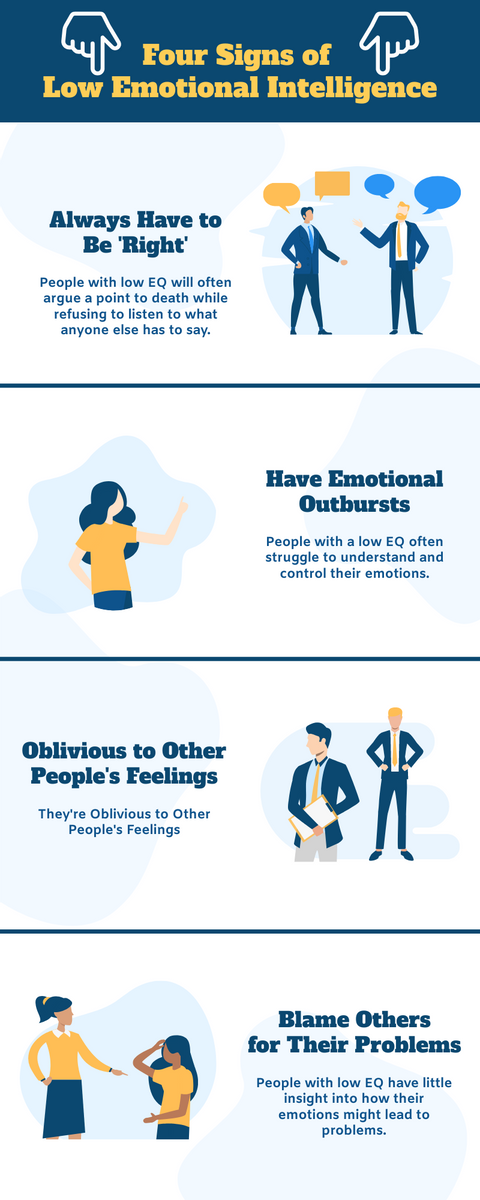
If you're looking for a high-quality infographic to showcase the Four Signs of Low Emotional Intelligence, then Visual Paradigm Online has got you covered. Our team of graphic designers has used our online infographic maker to create a visually appealing design that is both informative and engaging. The infographic highlights the four main signs of low emotional intelligence - lack of empathy, poor communication skills, inability to manage stress, and difficulty with teamwork - and provides tips for improving in these areas. The design is eye-catching and easy to read, with bold colors…
continue reading →
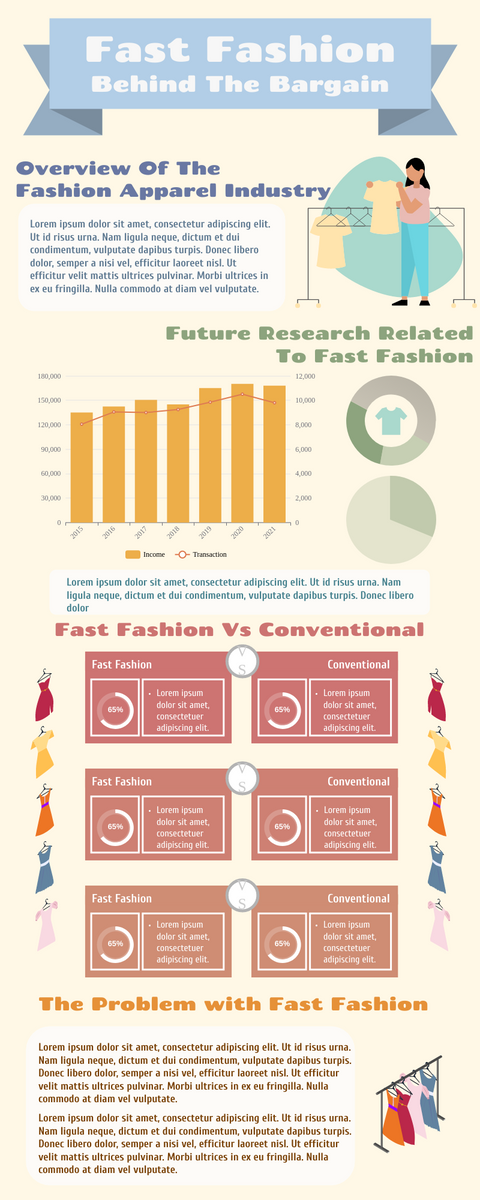
Are you interested in learning more about fast fashion and its impact on the environment? Check out our "Fast Fashion Infographic" created with Visual Paradigm Online. This infographic highlights the negative consequences of the fast fashion industry, including the excessive production of clothing, the use of harmful chemicals in production, and the large amount of textile waste generated each year. Customize this Infographic Template Our infographic was created using Visual Paradigm Online, a powerful and easy-to-use online infographic maker. With Visual Paradigm Online, you can easily create high-quality infographics like this one, using…
continue reading →
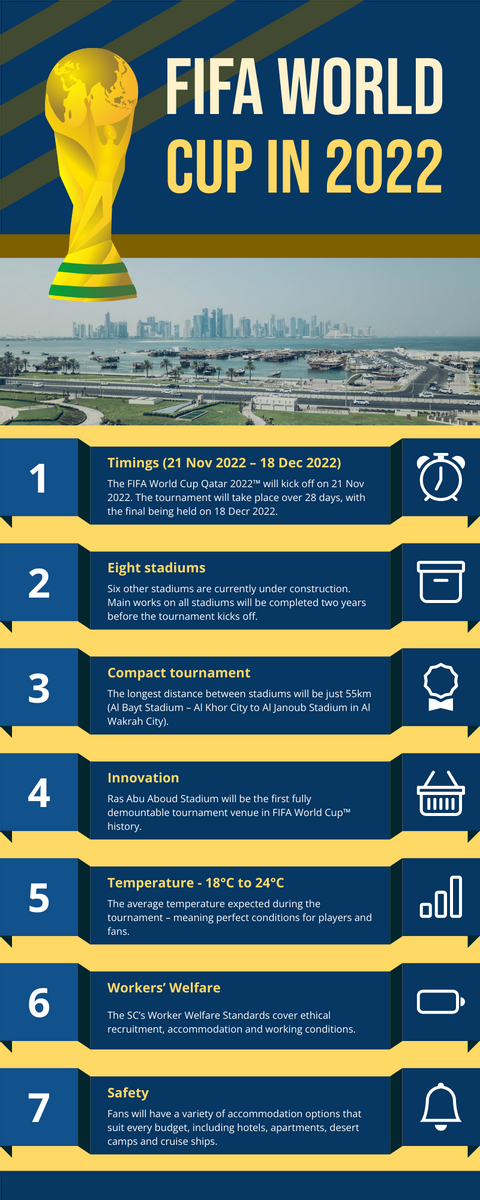
The Qatar World Cup in 2022 is just around the corner, and Visual Paradigm has created a captivating infographic that highlights everything you need to know about this major event. The theme of the infographic is "Qatar World Cup in 2022," and it includes a wealth of information about the tournament, including the history of the World Cup, the venues for the matches, the schedule of games, and more. The design of the infographic is visually stunning, with vibrant colors and eye-catching icons that help to convey the information in a clear and…
continue reading →
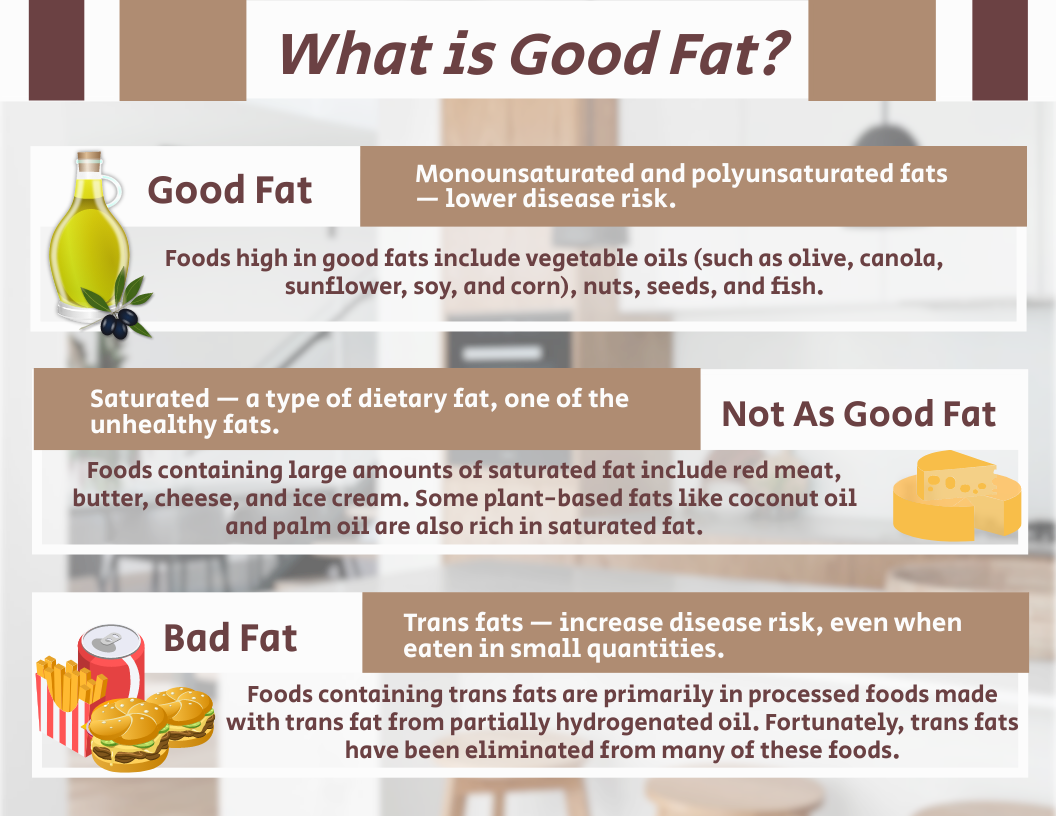
Are you interested in learning about the health benefits of "good fats"? Our "What is Good Fat" infographic created with Visual Paradigm Online is the perfect way to do so. This infographic highlights the importance of consuming healthy fats, such as omega-3 fatty acids, for optimal health. The design features a colorful, eye-catching layout with illustrations of various foods that are high in good fats. Customize this Infographic Template At Visual Paradigm Online, we understand the importance of creating high-quality infographics that effectively communicate information to your audience. With our online infographic maker,…
continue reading →
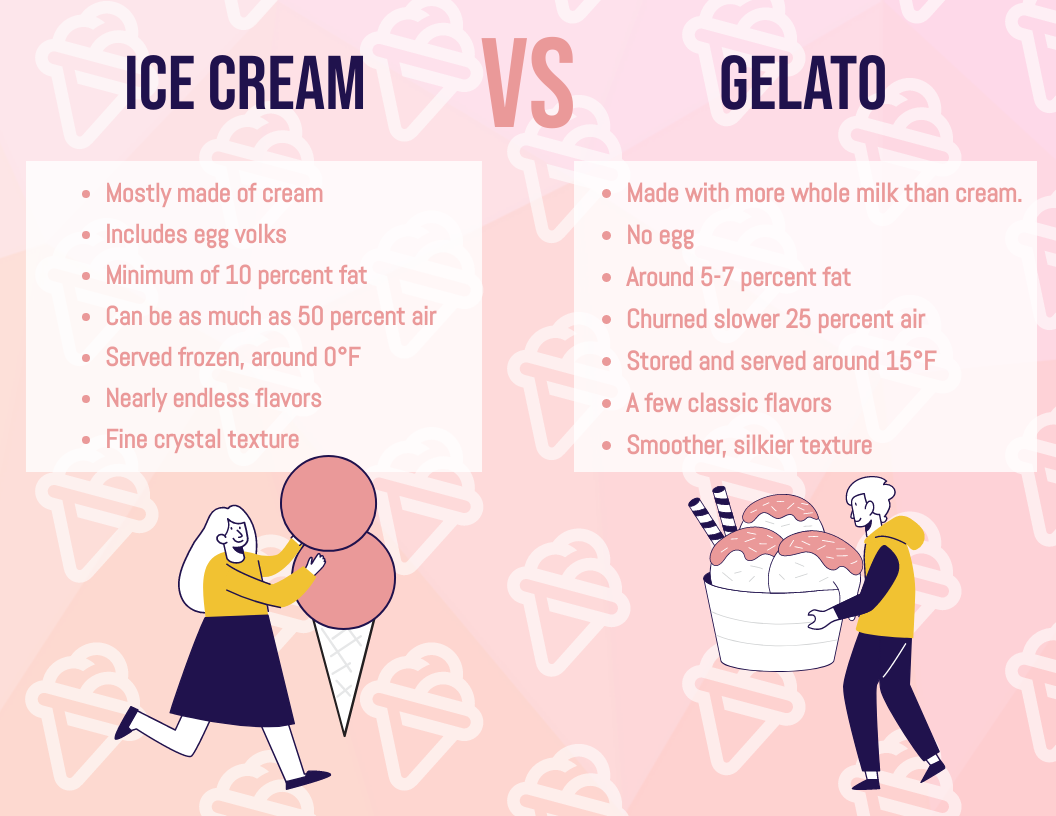
Are you a fan of frozen desserts but don't know the difference between gelato and ice cream? Our "Gelato vs. Ice Cream Infographic" is here to help! This eye-catching infographic breaks down the key differences between these two popular desserts, from their ingredients to their texture and serving temperatures. With vibrant colors and playful illustrations, this infographic is sure to catch the eye of anyone craving a sweet treat. Customize this Infographic Template At Visual Paradigm, we're proud to offer a powerful online infographic maker that makes it easy to create high-quality graphics…
continue reading →
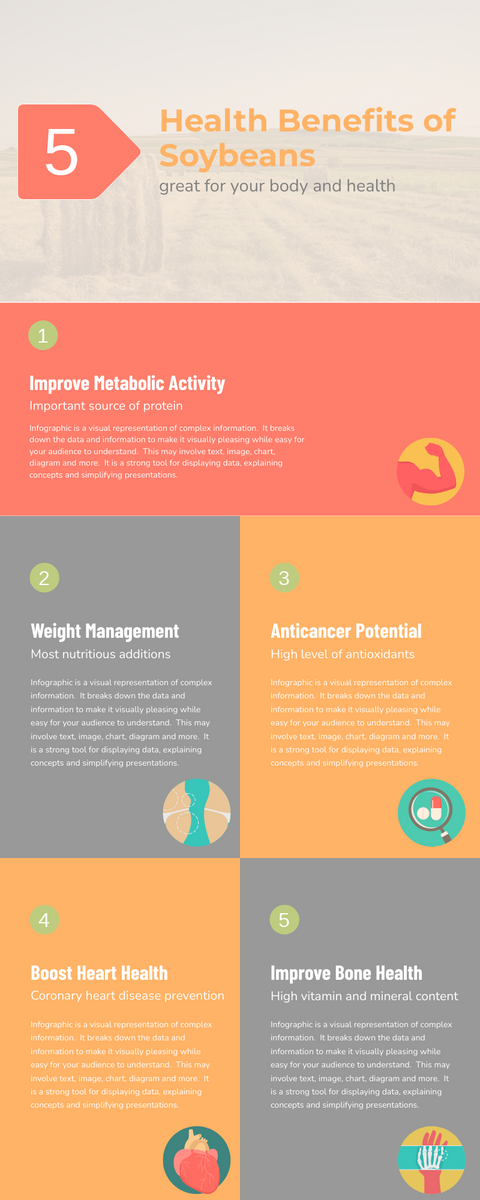
Are you curious about the health benefits of soybeans? Look no further than Visual Paradigm Online, the premier online infographic maker. Our "Health Benefits of Soybeans Infographic" is designed to educate and inform audiences about the numerous benefits of this versatile and nutritious food. The theme of the infographic is centered around the health benefits of soybeans, including their high protein content, ability to lower cholesterol, and potential cancer-fighting properties. Customize this Infographic Template Visual Paradigm Online's graphic design editor is the perfect tool for creating high-quality infographics like this one. Our online…
continue reading →
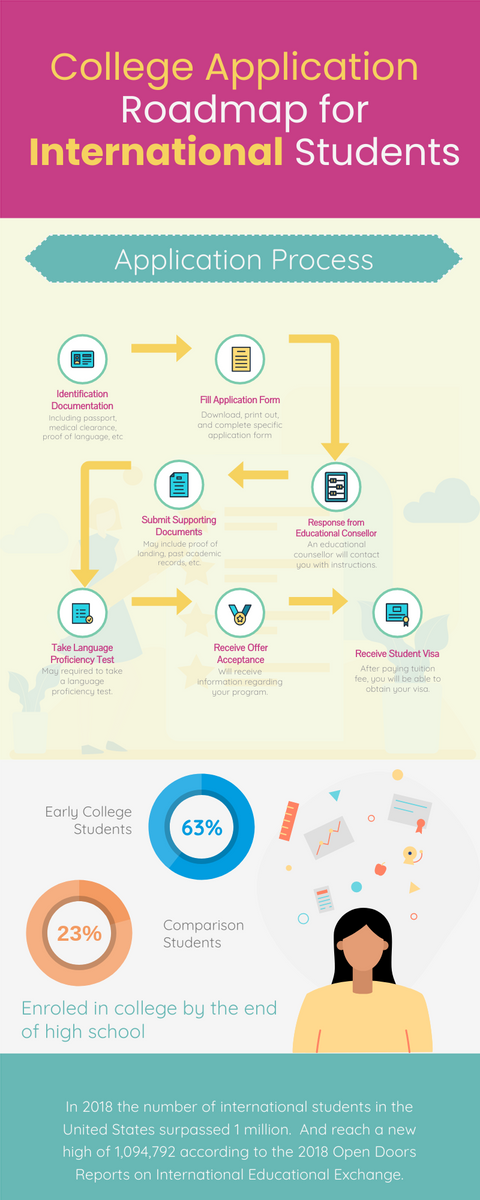
Are you looking to create a stunning infographic for your college application process? Look no further than Visual Paradigm Online, the ultimate online infographic maker. Our "College Application Roadmap Infographic" is designed with a sleek and modern approach, perfect for catching the eye of potential clients or customers. The theme of the infographic is centered around the college application process, providing helpful tips and a step-by-step guide for students who are looking to apply for college. Customize this Infographic Template Visual Paradigm Online's graphic design editor is the perfect tool for creating high-quality…
continue reading →
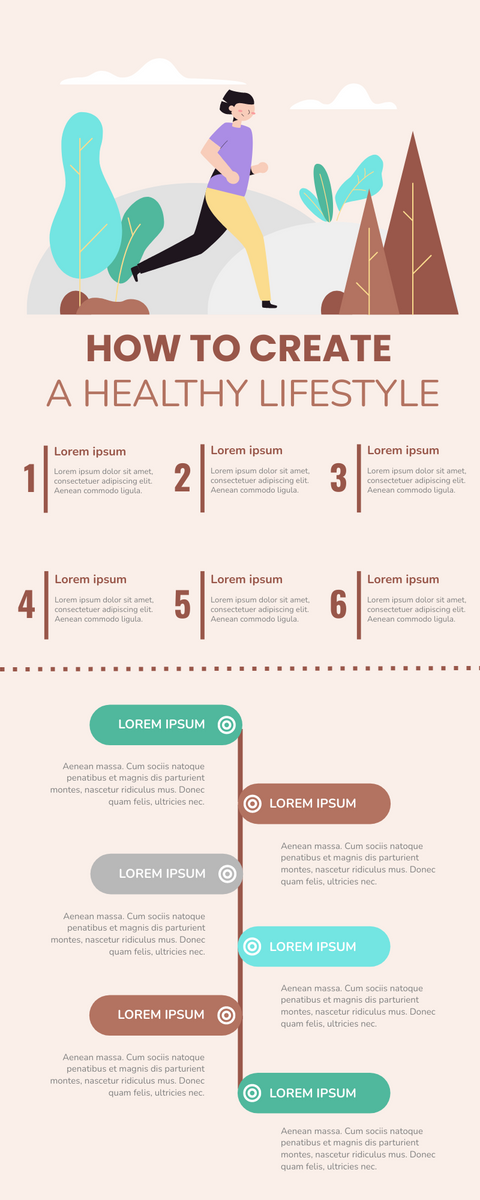
The "Create a Healthy Lifestyle" infographic, designed with Visual Paradigm Online, is a stunning visual representation of the steps one can take to lead a healthy and balanced life. The design of this infographic is clean, modern, and easy to read. The color palette is calm and soothing, reflecting the overall theme of the design. The use of icons and illustrations effectively communicates the message and makes the content easy to understand. The infographic highlights various aspects of a healthy lifestyle, such as diet, exercise, and stress management, providing useful tips and recommendations.…
continue reading →


