Home » Graphic Design » Page 6
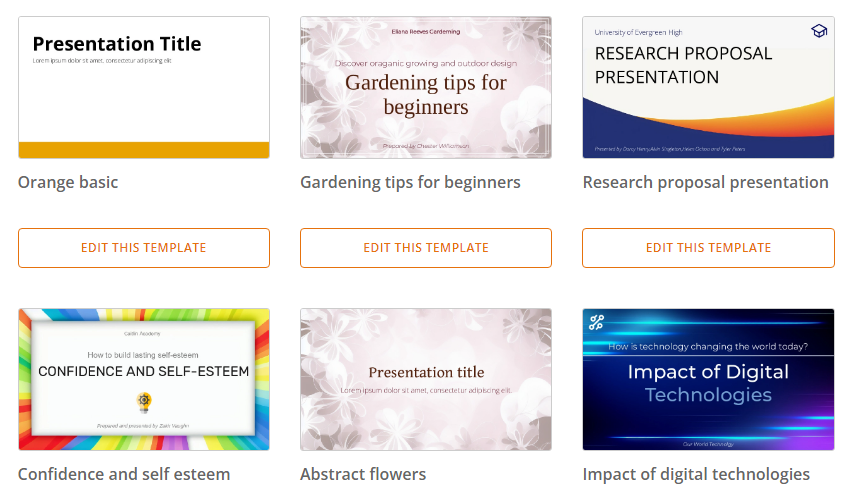
PowerPoint presentation is a widely used presentation tool that allows users to create engaging and interactive presentations. However, creating a visually appealing PowerPoint template can be a daunting task. That's where Visual Paradigm Online comes in. In this article, we will explore how to design PowerPoint templates with Visual Paradigm Online. Visual Paradigm Online is a web-based diagramming tool that allows users to create various types of diagrams and visuals, including presentation templates. With Visual Paradigm Online, you can easily create visually appealing PowerPoint templates that are tailored to your specific needs. What…
continue reading →
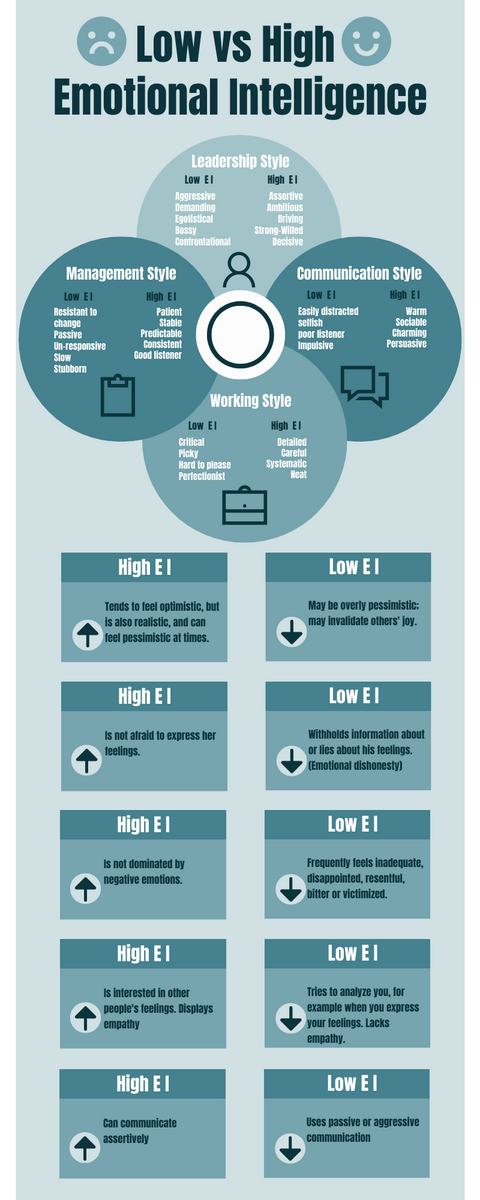
Visual Paradigm Online's infographic maker has created an engaging and informative infographic about the importance of emotional intelligence. The theme of the infographic is "Low vs High Emotional Intelligence Infographic," which aims to illustrate the differences between individuals with low and high emotional intelligence. The design of the infographic is both visually appealing and professional, using contrasting colors and bold typography to highlight the key points. The infographic is easy to read and provides a clear overview of the topic, using data-driven visuals to support the key messages. Customize this Infographic Template Visual…
continue reading →
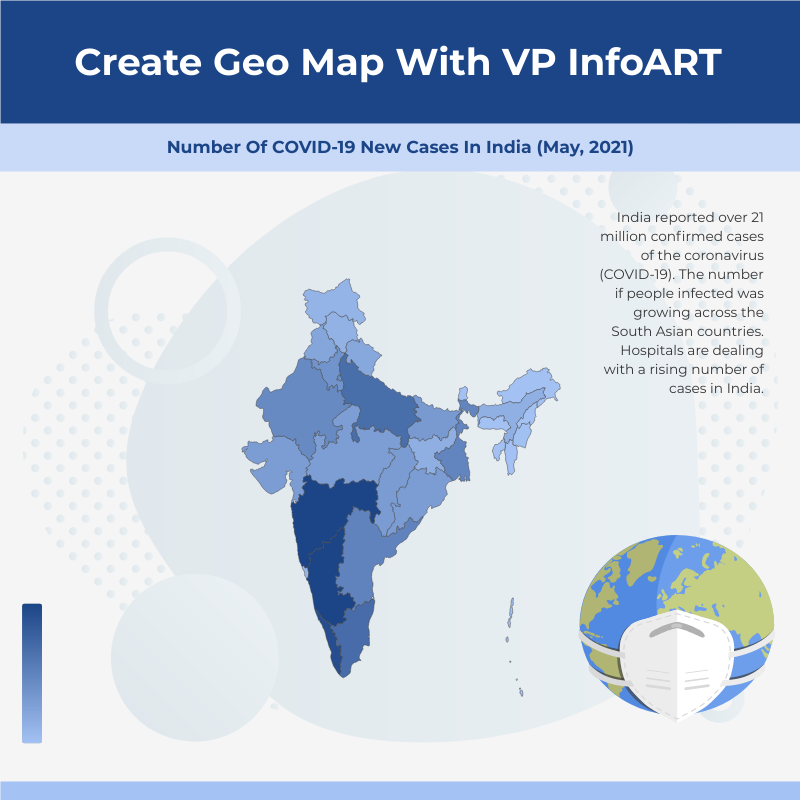
Visual Paradigm Online's infographic maker has created a visually stunning infographic about the number of COVID-19 new cases in India in May 2021. The infographic displays vital data in a visually engaging way and provides businesses and organizations with a customizable template to convey their data visually. The theme of the infographic is "Infographic About Number Of COVID-19 New Cases In India (May, 2021)". The design of the infographic is both professional and eye-catching, using bright colors and bold typography to highlight the key statistics. The infographic is easy to read and provides…
continue reading →
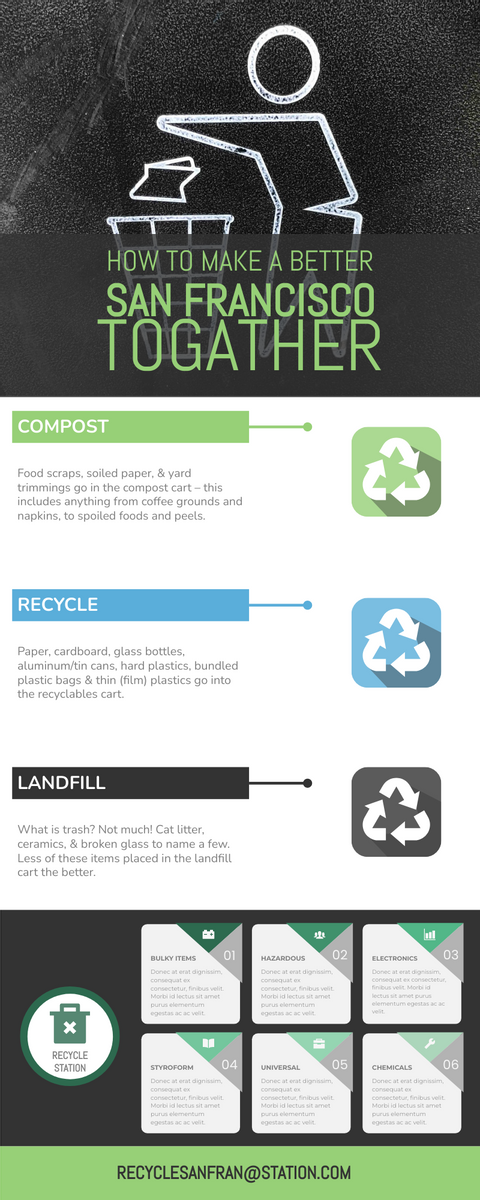
Are you interested in promoting sustainability and environmental responsibility in your community? Visual Paradigm's "Infographic About Creating A Better San Francisco By Recycling" is the perfect resource for businesses and organizations looking to spread the word about recycling and its impact on the environment. This beautifully designed infographic highlights the benefits of recycling, including reducing waste, conserving energy, and reducing greenhouse gas emissions. It also offers practical tips on how individuals and businesses can get involved in the recycling effort, such as reducing paper use, composting, and properly disposing of hazardous materials. Customize…
continue reading →
Are you struggling to stay productive while working from home? Look no further than Visual Paradigm's "9 Tips to Stay Productive When Work from Home Infographic." This expertly designed infographic offers practical advice on staying productive while working remotely. Customize this Infographic Template Visual Paradigm Online is the ultimate online infographic maker, providing high-quality graphic design tools that allow users to create stunning visuals like this one. With an intuitive interface and a wide range of customizable templates, it's easy to create an infographic that stands out from the crowd. Whether you're a…
continue reading →
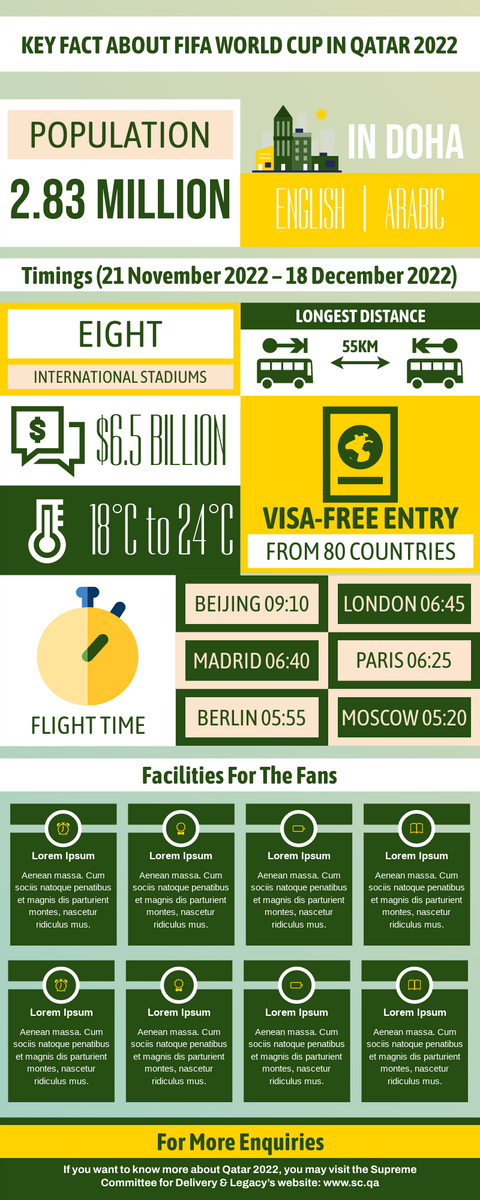
The FIFA World Cup is one of the most anticipated events in the world, with millions of people tuning in to watch the action every four years. Visual Paradigm Online has created a customizable infographic about the 2022 FIFA World Cup in Qatar, which provides key facts and figures about the tournament. The infographic design is visually appealing and engaging, using bright colors and clear graphics to convey information. It includes statistics on the number of teams participating, the venues and host cities, and the schedule of matches. The infographic also highlights key…
continue reading →
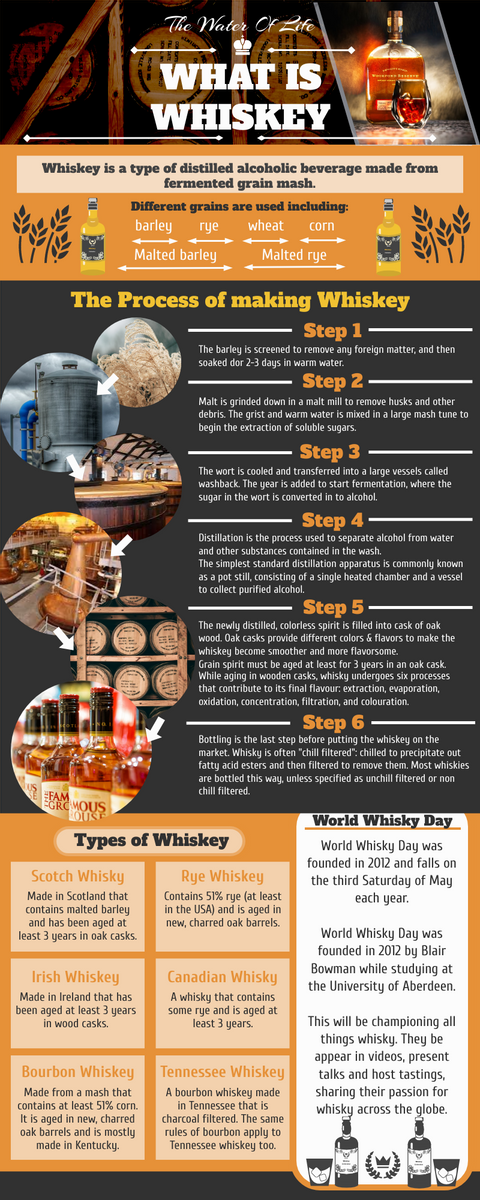
Introducing Visual Paradigm Online's latest creation, an engaging infographic about "What Whiskey Is". This visually striking and informative design showcases various types of whiskey and their distinct characteristics, making it perfect for businesses and organizations looking for a customizable infographic to educate their audience. With the help of Visual Paradigm Online's easy-to-use design editor, users can create high-quality infographics that reflect their brand image and style. This infographic design highlights the importance of whiskey and educates the audience on the different types of whiskey, including Bourbon, Rye, Scotch, and Irish Whiskey, along with…
continue reading →
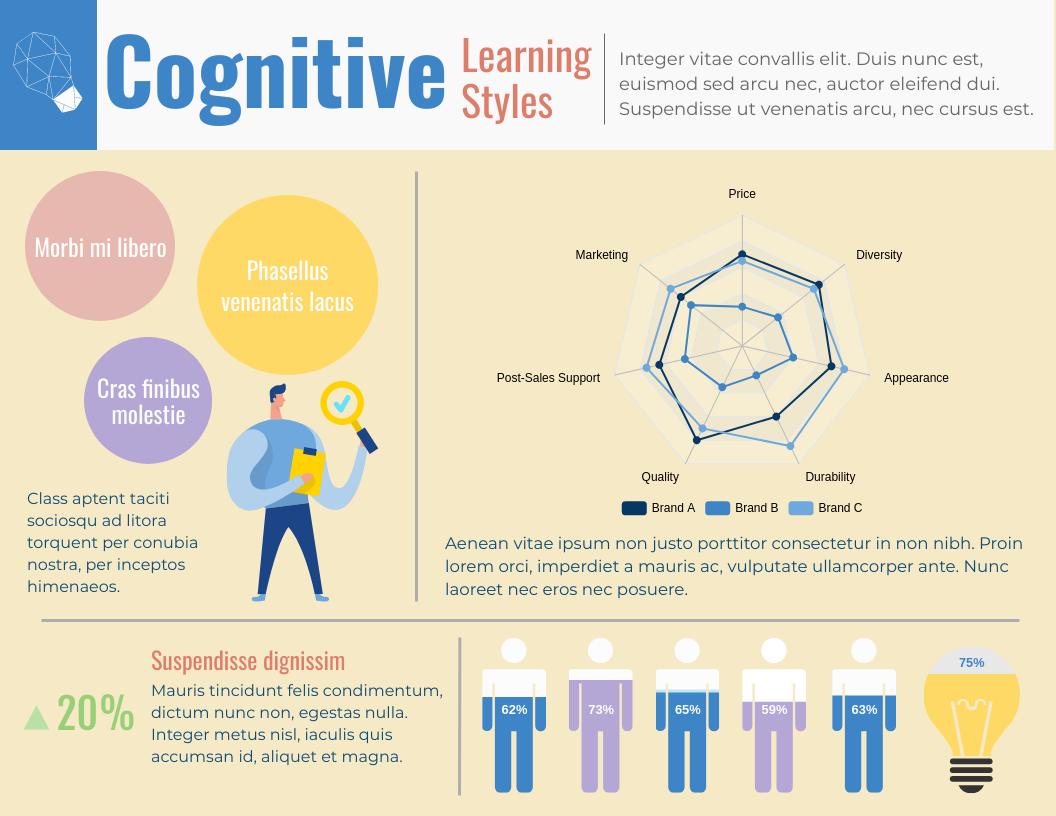
Introducing Visual Paradigm Online's latest infographic design - the "Cognitive Learning Style Horizontal Infographic." This visually stunning and informative design presents information in a horizontal layout, making it easier for the audience to read and comprehend. This infographic has been designed to cater to the needs of businesses and organizations looking for a customizable infographic template that can showcase their unique brand message. With the help of Visual Paradigm Online's easy-to-use design editor, users can create high-quality infographics that reflect their brand image and style. Visual Paradigm Online is a powerful online infographic…
continue reading →
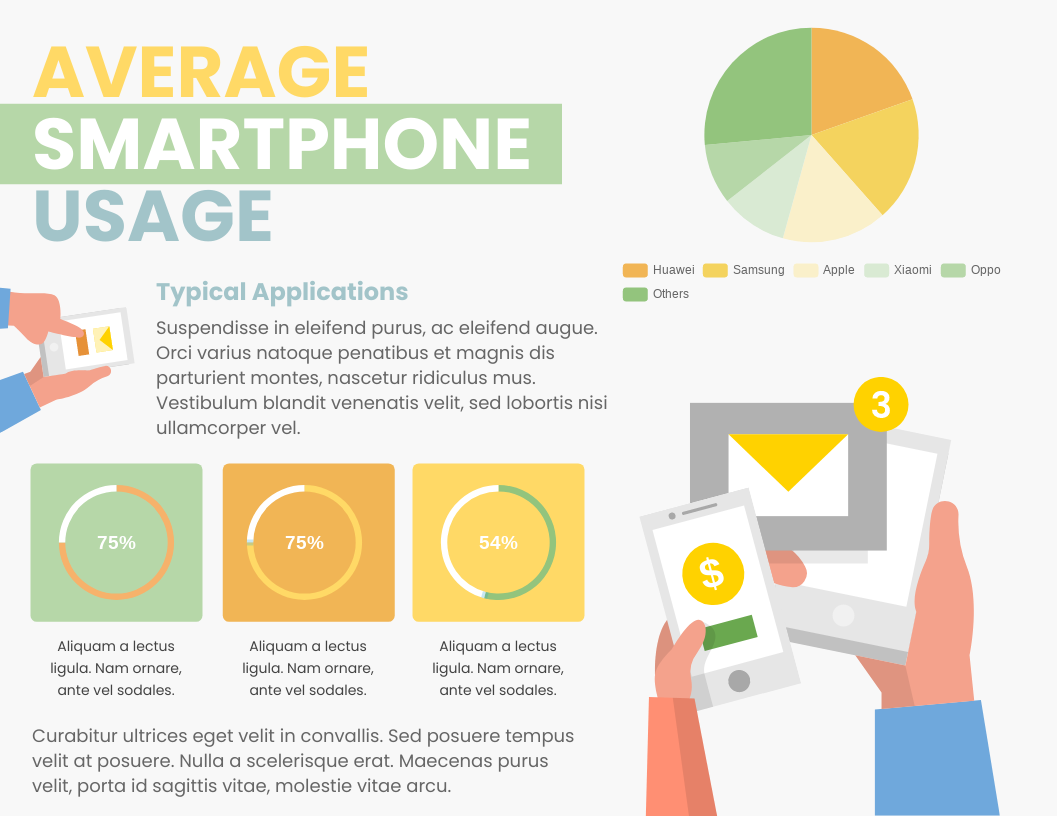
Are you looking to create a high-quality infographic that is both informative and visually appealing? Look no further than Visual Paradigm Online, the premier online infographic maker. Our latest infographic, "Mobile device usage horizontal Infographic", showcases our expertise in creating customizable designs that are perfect for businesses and organizations. This infographic highlights the usage patterns of mobile devices in a horizontal layout, making it easy to read and understand. Customize this Infographic Template Using Visual Paradigm Online's online infographic tool, you can easily customize this design to fit your specific needs. With a…
continue reading →
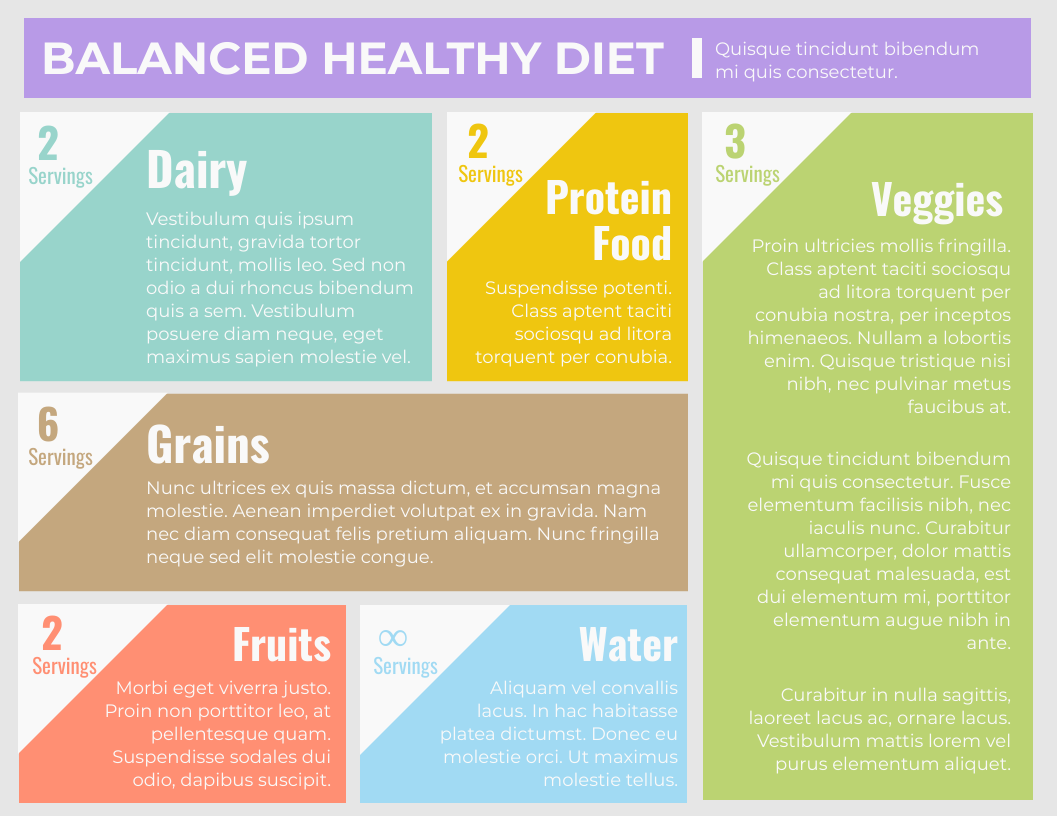
Introducing the "Balanced Healthy Diet Horizontal Infographic," a professionally designed and fully customizable infographic created with Visual Paradigm Online. This infographic presents a visually engaging and informative guide to achieving a balanced and healthy diet. The design features colorful icons and graphics, making it easy to understand and share with others. Customize this Infographic Template Visual Paradigm Online is a powerful online infographic maker that allows businesses and organizations to create high-quality infographics with ease. With its intuitive drag-and-drop interface and a vast library of pre-designed templates and elements, users can create eye-catching…
continue reading →

