Home » Graphic Design » Page 8
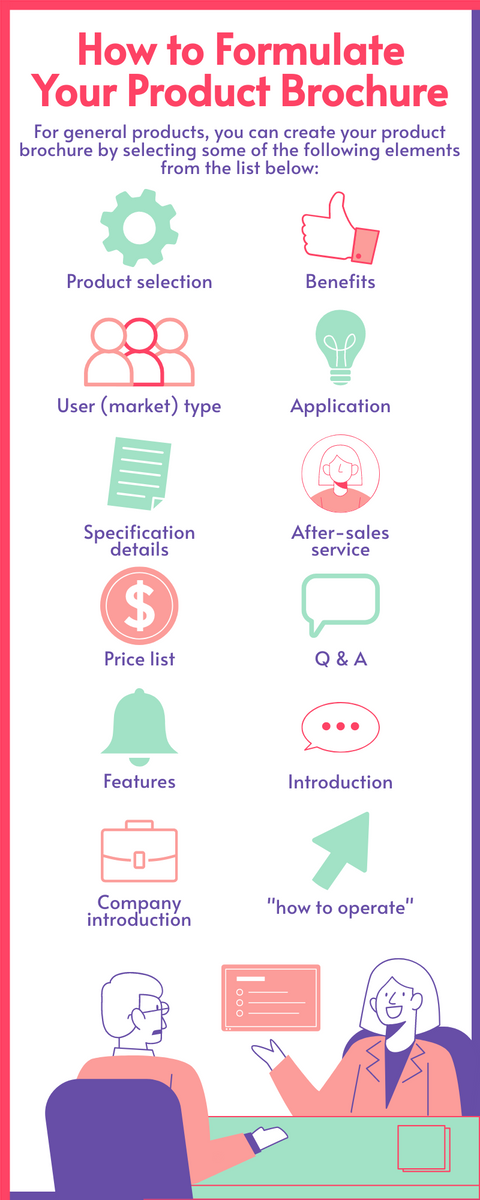
Introducing our latest infographic about "How to Formulate Your Product Brochure", created using Visual Paradigm Online. Our infographic provides businesses and organizations with a clear and concise guide to creating a product brochure that effectively communicates their message to potential customers. The design of our infographic is simple and visually appealing, with the use of bright colors and modern graphics to enhance its overall look. The layout is structured in a step-by-step format, guiding the reader through the different stages of creating a product brochure from identifying their target audience to choosing the…
continue reading →
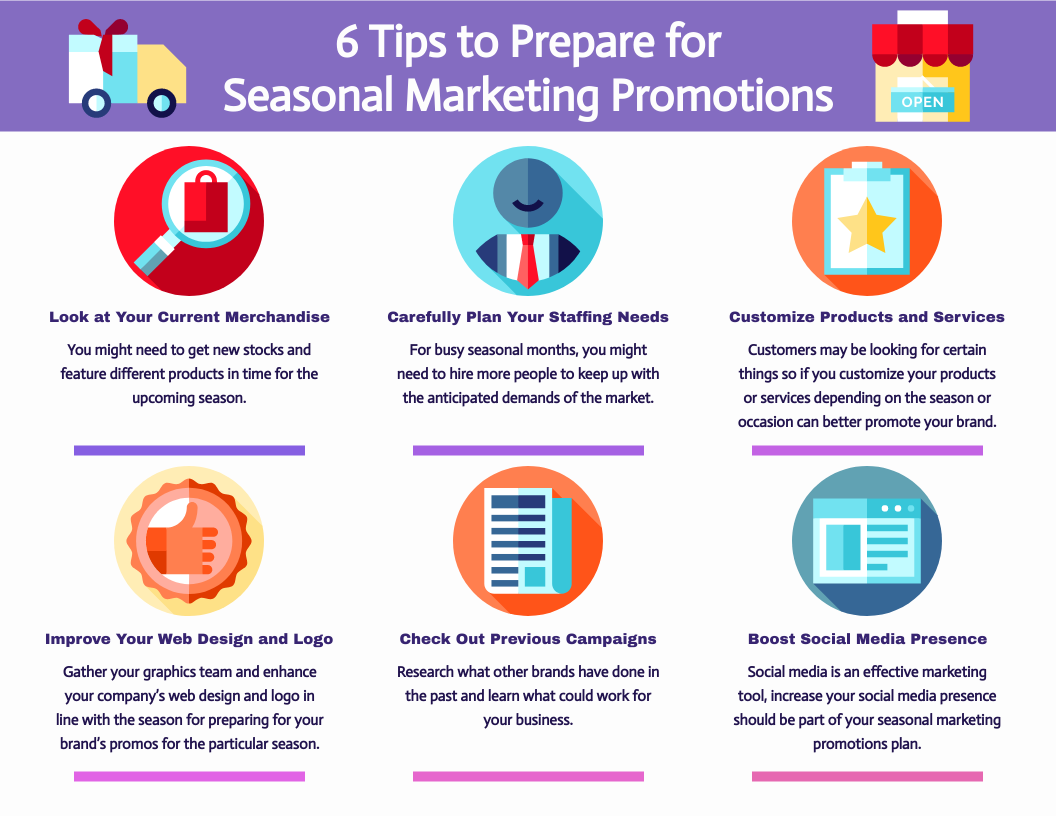
Introducing "6 Tips to Prepare for Seasonal Marketing Promotions Infographic", a stunning design created with Visual Paradigm Online. This infographic provides businesses and organizations with six essential tips to prepare for seasonal marketing promotions, with a visually pleasing design that is fully customizable to meet specific branding needs. Customize this Infographic Template With Visual Paradigm Online, creating high-quality infographics has never been easier. Our online infographic maker is a powerful and intuitive tool that allows users to create professional-grade designs with ease. Whether you are a beginner or an experienced graphic designer, our…
continue reading →
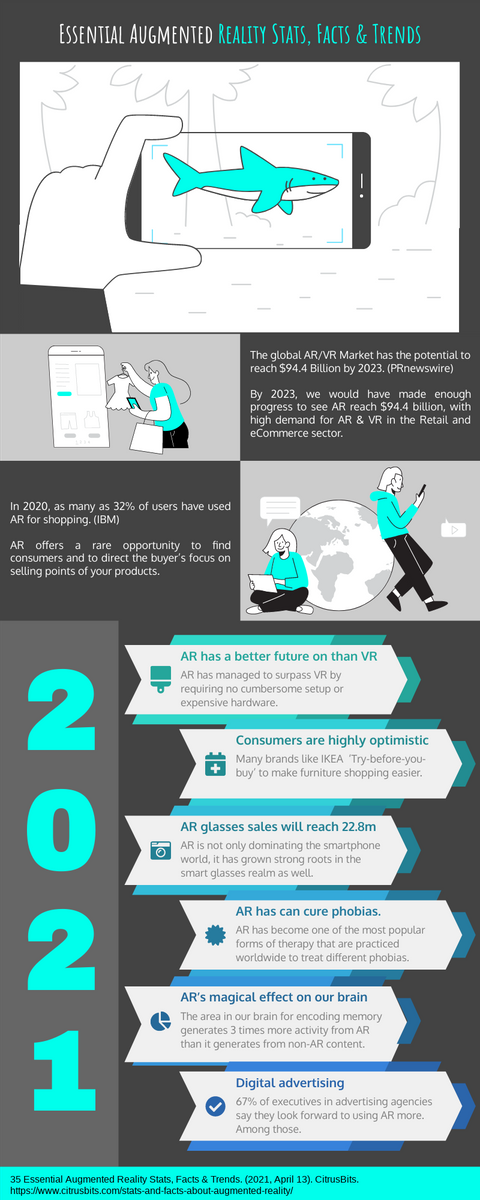
The "Essential Augmented Reality Stats Facts And Trend Infographic" created with Visual Paradigm Online is a must-have for businesses and organizations. The infographic presents a range of stats and facts related to augmented reality (AR), including its current status and future trends. The design features a clean and modern layout, which enhances the infographic's readability and makes it easy to understand. Customize this Infographic Template Visual Paradigm Online is the perfect online infographic maker for creating high-quality infographics like this one. Its intuitive interface, combined with a library of templates and design elements,…
continue reading →
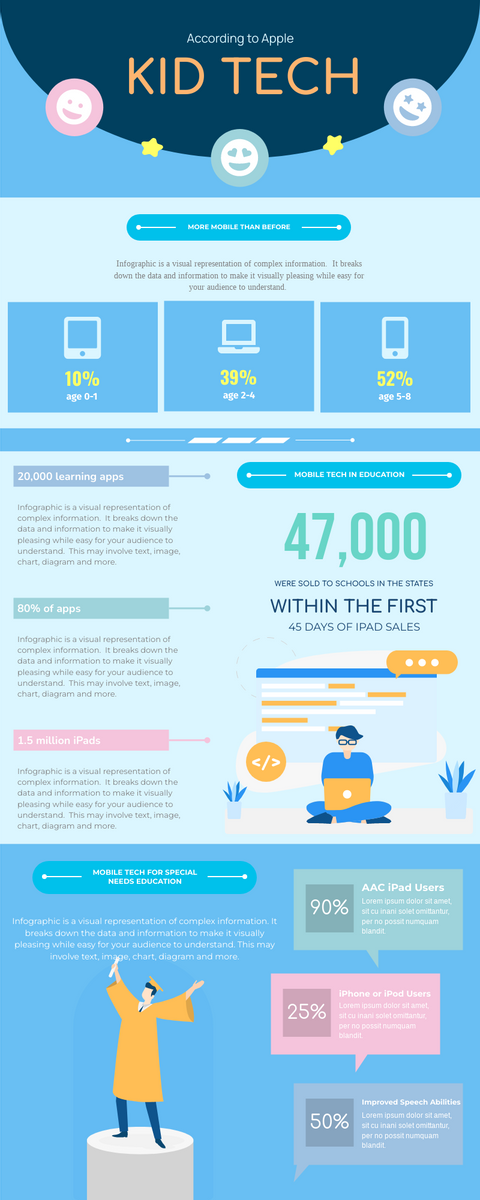
Are you looking for a comprehensive and customizable infographic about the development and influence of kids' tech? Look no further than Visual Paradigm Online's "Development And Influence Of Kids Tech Infographic". This infographic covers a range of topics related to the influence of technology on children, including the rise of educational apps, the impact of social media, and the importance of digital literacy. The design features bright colors and bold fonts, making it engaging and visually appealing for both kids and adults. The layout is organized and easy to read, with each section…
continue reading →
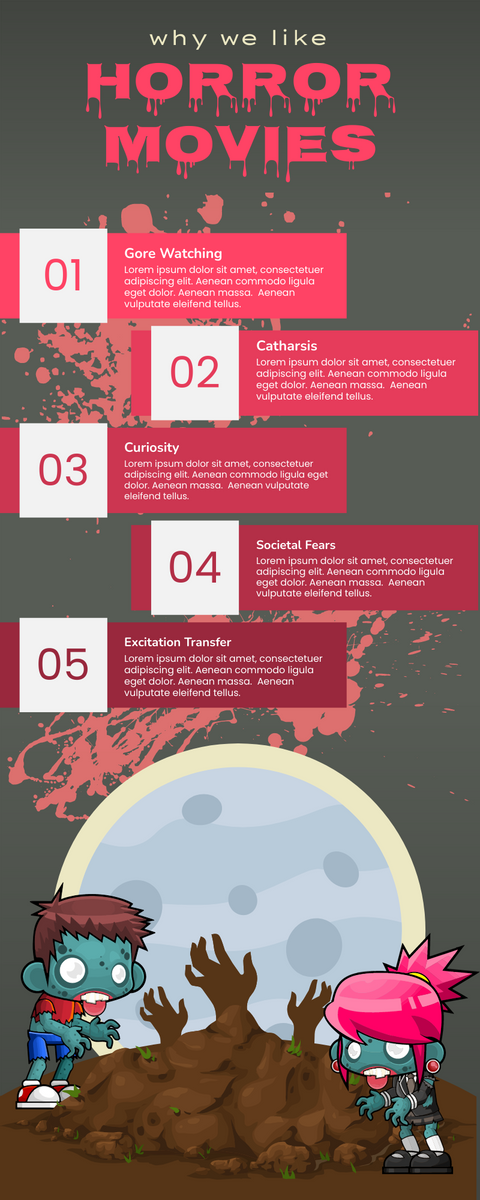
Are you looking for a visually stunning and customizable infographic design for your business or organization? Look no further than Visual Paradigm Online's "Reasons Why We Like Horror Movies Infographic". This infographic is a visually striking representation of why so many people love horror movies. The design features dark, ominous colors and bold fonts, giving it a spooky yet professional feel. The layout is organized and easy to read, with each reason accompanied by a corresponding image. This infographic is perfect for businesses and organizations in the horror movie industry, as well as…
continue reading →
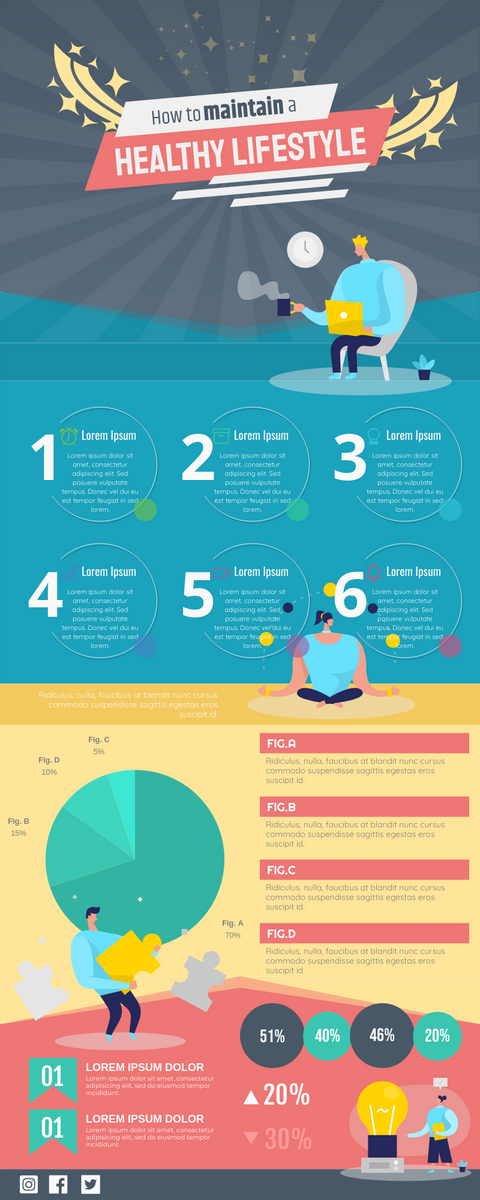
Are you looking for a way to create high-quality infographics online? Look no further than Visual Paradigm Online! Our infographic maker is the perfect tool for businesses and organizations that want to create professional, customizable designs quickly and easily. Our latest infographic theme, "How to Maintain a Healthy Lifestyle Infographic," is a perfect example of what you can create with Visual Paradigm Online. This colorful design features eye-catching graphics and informative text, making it a great resource for anyone looking to improve their health and wellness. Customize this Infographic Template With Visual Paradigm…
continue reading →
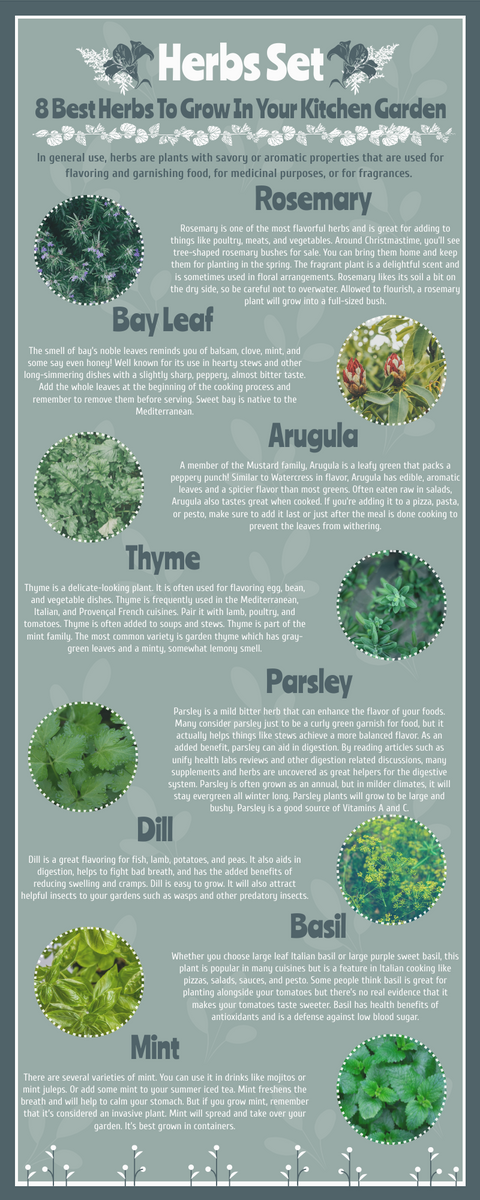
This article showcases an infographic titled "8 Best Herbs To Grow At Home Infographic" created using Visual Paradigm Online. The design is modern and visually appealing, with colorful illustrations of each herb accompanied by a brief description of their benefits. The theme of the infographic is perfect for those interested in gardening and looking for ways to incorporate fresh herbs into their daily lives. Customize this Infographic Template Visual Paradigm Online is a powerful online infographic maker that allows users to create high-quality designs like this one. The platform offers a wide range…
continue reading →
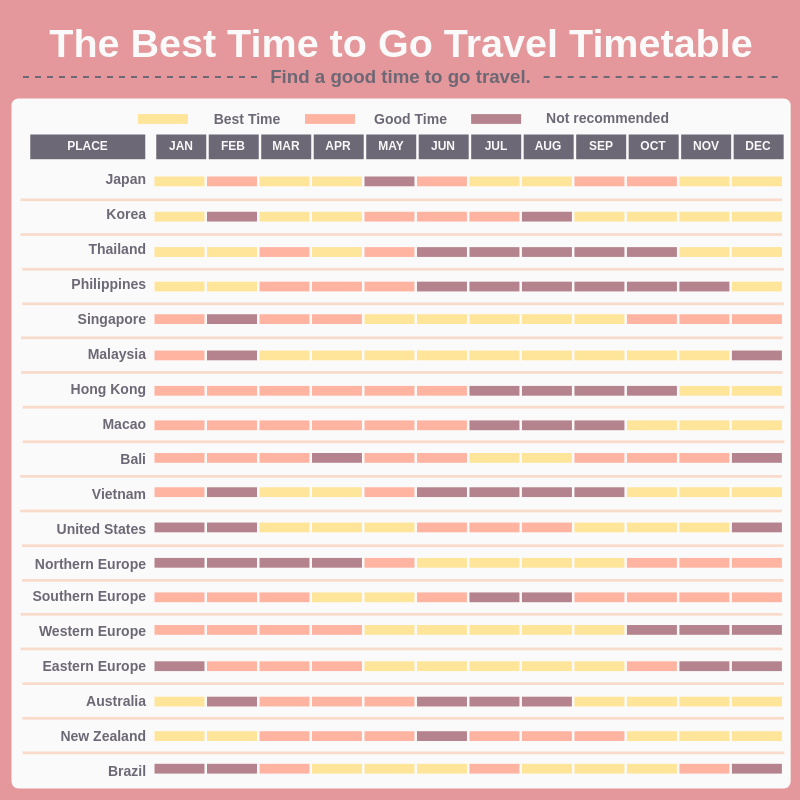
Looking for a customizable infographic design to showcase your travel data? Look no further than Visual Paradigm Online's "The Best Time to Go Travel Infographic"! This visually stunning and informative design is the perfect way to share your travel data with businesses, organizations, or anyone interested in exploring the world. Customize this Infographic Template Our online infographic maker allows you to create high-quality infographics like this one with ease. With Visual Paradigm Online's user-friendly interface and a wide variety of customizable templates, you can quickly and easily create an infographic that is tailored…
continue reading →
It is well known that the brain is far more efficient in processing visual information than in processing textual information. This is one of the reasons why the data visualization design is so effective in conveying information; by "viewing" the data, the brain can more easily ingest, synthesize and retain all the information. Data analysis information presented. However, when designing a large data visualization screen, many people will mistakenly think that putting several data charts together for display means that a large data visualization screen has been completed; unfortunately, the large screen produced…
continue reading →
Infographics refer to the simplification of a large amount of information, data, or knowledge, and are clearly presented as a chart. The knowledge to be conveyed is expressed in the form of diagrams in a simple and charming style, which makes people understand at a glance and makes it easy for readers to want to share it. It is a content marketing method that combines "storytelling" and "visualization". Don't think that piling up text into a chart is equivalent to Infographic! Behind it involves analyzing data, organizing data, and graphic design. Learn more…
continue reading →

