Home » Archives for April 2022 » Page 4
-
Posted on April 19, 2022
-
/Under Diagram
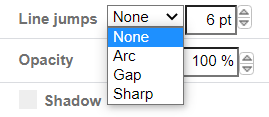
When we are creating complicated diagram, there are lots of connectors and they will overlap each other. One of the ways to make them looks clearer is to set the line jumps for them. https://www.youtube.com/watch?v=movC-r9TKV8&width=854&height=480 How To Set The Line Jump Style Of A Connector Why We Need This Function As the connectors are usually lines, when they are overlapping, it is not easy for us to define which points they are belonged to. Especially for the case that several connectors are going to the same point, we may then misunderstanding the diagram…
continue reading →
-
Posted on April 14, 2022
-
/Under Chart
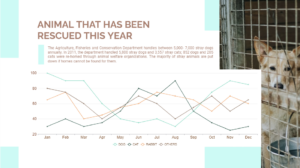
A line chart (also called a line plot or line graph) is a graph that uses a line to connect individual data points. The line chart displays quantitative values over a specified time interval. Line charts are often used to describe the historical price movements of an asset or security in finance. This video will show you how to create a line chart in Visual Paradigm Online. https://www.youtube.com/watch?v=PnLJI8xrdUY&width=854&height=480 What is a line chart? A line chart is a chart type of built-in Excel where each data series is plotted as a separate line.…
continue reading →
In Visual Paradigm Online, you can easily design various elements like texts, images, shapes, etc. on the design canvas. Sometimes you may want to share a link for the readers to click on for visiting particular websites. So how can we add some links to our design? With the design tool in Visual Paradigm Online, you are available to attach any link to the design element. When people read through your design, they can just click on the element and jump to the link in the window. This is a tutorial for teaching…
continue reading →
In Visual Paradigm Online, you can design graphics with any kind of image freely. There are two ways for you to add images to the design. The first one is choosing images to form the photo library of Visual Paradigm Online. There are thousands of images in different categories provided for you to use for free. Another way to add images is by uploading your images for design from your device. This is a tutorial to guide you on how to upload images to the document to design your work. You can watch…
continue reading →
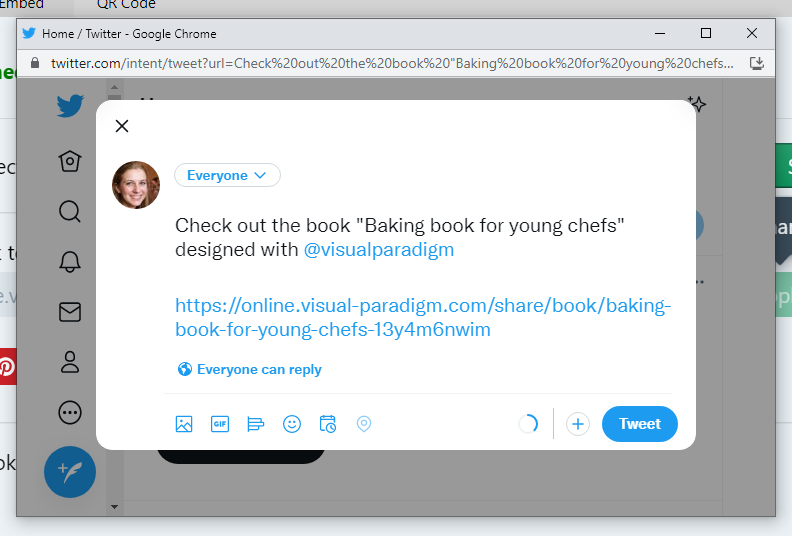
After finishing our flipbook, it is time for us to share it with others! We can share it through email and other social media. In this article, we will show you how to share the flipbook via X! https://www.youtube.com/watch?v=2nUMmNeF4b0&width=854&height=480 How To Share The Flipbook Via X After publishing the book, you can go to the workspace under "My Books", there are 4 buttons for each of the books, including, Edit, Share, Setting and More. Click " Share ", then you will see the following browser. In stead of sharing through URL and email, you can…
continue reading →
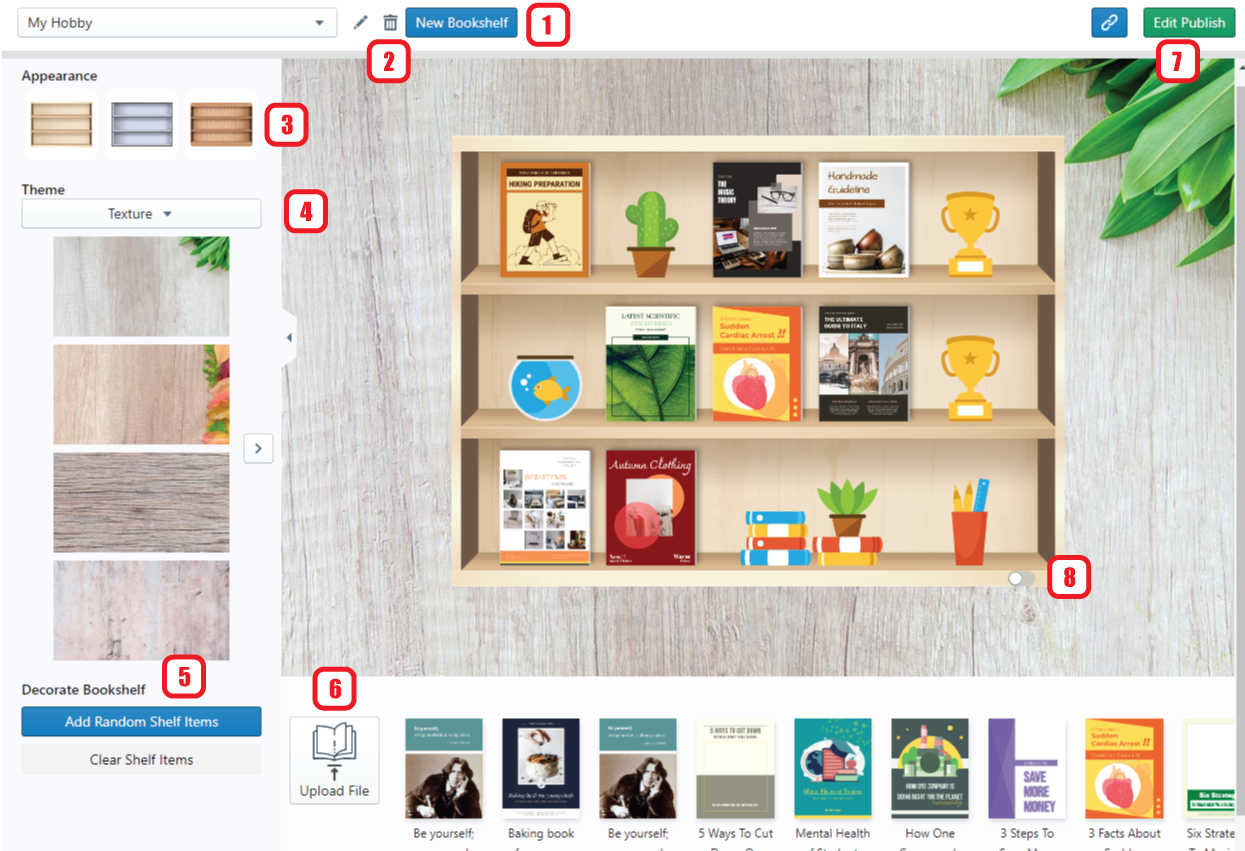
After creating some flipbooks, we need a bookshelf to display them well! You can now do it on Fliplify. by managing the bookshelf and adding decorations, you can share your works with others in an interesting way! https://www.youtube.com/watch?v=_0UanKxrHQg&width=854&height=480 How To Manage Your Bookshelf Create A Bookshelf First of all, you need to create a new bookshelf. By clicking " New Bookshelf" under My Bookshelf, a new bookshelf is created and you can then start the setting. Setting Of The Bookshelf Rename the bookshelf Deleted the bookshelf Select the appearance of the bookshelf Select…
continue reading →
-
Posted on April 11, 2022
-
/Under Chart
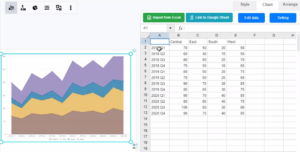
A stacked area chart is a major Excel chart type that shows a series of data stacked up with filled areas. Stacked area charts can show how the relationship of parts to the whole changes over time. This video will show you how to create a stacked area chart in Visual Paradigm Online. https://www.youtube.com/watch?v=eyY0aGkgBfg&width=854&height=480 What is a stacked area chart? A stacked area chart is an extension of the basic area graph. It shows the evolution of the values of several groups on the same graph. The values of each group are displayed…
continue reading →
-
Posted on April 11, 2022
-
/Under Chart
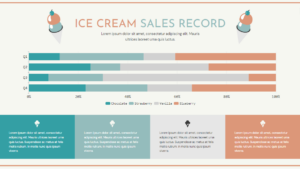
A 100% stacked column chart is an Excel chart type, it is useful for showing the change in proportion over time. This video will show you how to create a 100% Stacked Bar Chart in the Visual Paradigm Online. https://www.youtube.com/watch?v=IrjLGSG88mQ&width=854&height=480 What is 100% Stacked Bar Chart? The 100% Stacked Bar Chart is an Excel chart type designed to show the relative percentages of multiple data series using stacked bars, where the sum (cumulative) of each stacked bar always equals 100%. Like a pie chart, a 100% stacked bar chart shows the relationship of…
continue reading →
-
Posted on April 8, 2022
-
/Under Chart
We often record data for a particular use and sometimes we may need to present the data through graphics. In Visual Paradigm Online, you can create various charts freely like bar charts, column charts, pie charts, etc. This chart tool can help you to display any data by using text, symbols, and graphics. You can easily visualize the data that you have collected as graphics and they are presentable. This is a guide for teaching you to create a chart with Visual Paradigm Online. You can watch the attached video or read the…
continue reading →
In Visual Paradigm Online, you can freely design graphics with the customization of texts, colors, images, shapes, charts, charts, etc. The function of editing text is commonly used to add texts to your design. To save you time in adding texts to your design, this tutorial will teach you how to add texts in a fast way. With the design tool on Visual Paradigm Online, there are three ways (short-cuts) that you can create texts with a few clicks only. This can help you create texts at a fast speed. You can watch…
continue reading →

