Home » Archives for June 2022 » Page 5
-
Posted on June 7, 2022
-
/Under Chart
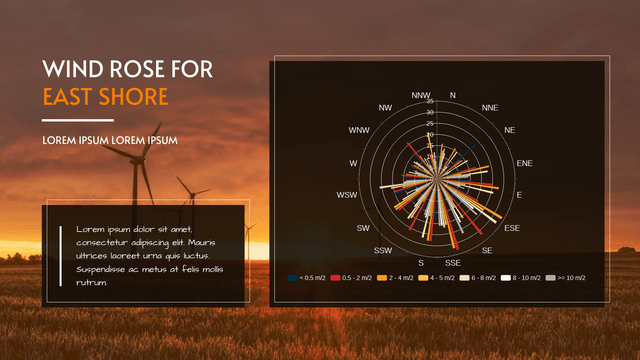
What Is A Rose Chart Rose chart shows data in 360 degrees with a shape of a compass. Is is commonly divided into 8 to 16 parts to show geography data. With different size and colors, we can see the difference between data clearly without calculating each part of them. When To Use Rose Chart As amount and direction can be shown in the chart clearly, rose chart is commonly used in data analysis of geography fieldwork. However, there is an important when reading rose chart that the outer segment does not represent…
continue reading →
In Visual Paradigm Online, you can create flipbooks easily with Fliplify. There are dozens of flipbook temples designed for you to customize and to create your own designs. You can feel free to create different kinds of flipbooks like photo books, menus, reports, and presentations with various pages that you want. It is an easy-to-use tool for everyone to use. You can design your own books on each of the pages and preview the design with our preview tools. Instead of creating your own books with the free design tool on Visual Paradigm…
continue reading →
-
Posted on June 2, 2022
-
/Under Chart
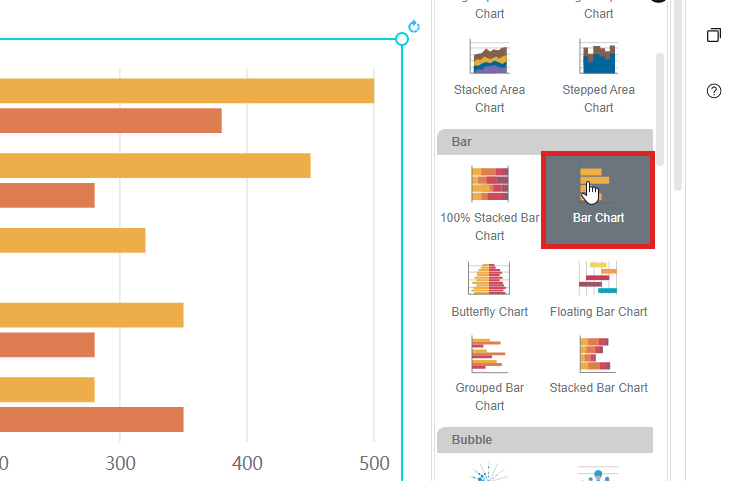
In Visual Paradigm Online, you can design your own charts with our online design tool. We often record data and sometimes we may need to present the data through graphics. With Visual Paradigm Online design tool, you can create various charts freely like bar charts, column charts, pie charts, etc. This chart tool can help you to display any data by using text, symbols, and graphics. You can easily visualize the data that you have collected as graphics and they are presentable. This is a guide for teaching you to switch chart types.…
continue reading →
-
Posted on June 2, 2022
-
/Under Diagram
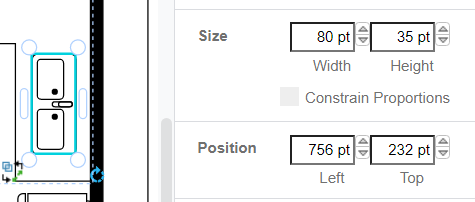
When creating diagrams, it's important to be able to design with specific units in mind. In Visual Paradigm Online, you can change the unit of measurement to suit your needs. The design tool allows you to change units to Points (pt), Inches ("), and Millimeters (mm) as per your requirement. In this article, we will explain how you can change the units in your diagrams using Visual Paradigm Online. https://www.youtube.com/watch?v=3_nxVnFnDeg&width=854&height=480 Changing the Units in Diagrams To change the units in your diagrams, follow these simple steps: Step 1: Open your diagram in…
continue reading →
Visual Paradigm Online provides you with an easy tool for designing flipbooks online for all people. You can freely design your own book with various pages and dimensions. There are dozens of flipbook templates that you can choose for customization. Apart from creating flipbooks online for reading. You can also add animations on each of the designed pages. You can animate the texts, images, and shapes freely in your designs. There are various effects of animations that you can select for your design like "fade in", "pop up", "swing", etc. This is a…
continue reading →


