Show Values On Bar Charts/ Column Charts
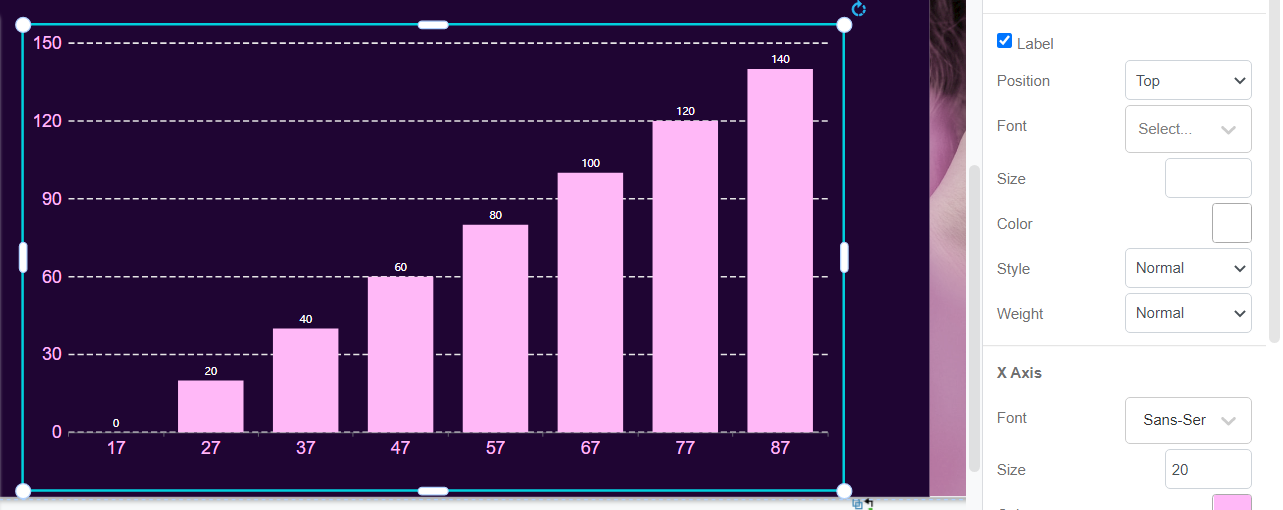
In bar charts and column charts, the length of the bars are changed according to the value. Although we can read the value by the split lines, we sometimes may not get the exact number, while extra time is also needed. In this case, we may choose to show the values on the chart directly.
How To Show Values On Bar Charts
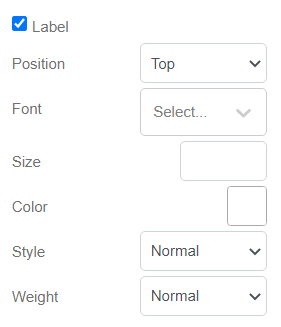
Under Panel-Chart, there is a option Label.
Click it and you will finds that there are numbers on the top of each of the bars.

Moreover, we can customize the style of the values:
- Position (including inside/outside the bars)
- Font
- Size
- Color
- Style ( Italic or not )
- Weight ( Lighter, Bolder, Bold )
Customize the design of the value to fit your works.

Other Tips When Showing The Value
The most easiest way for us to know the value of the bar should be reading the number directly.
However, there is another hint that helps us having better reading experience:
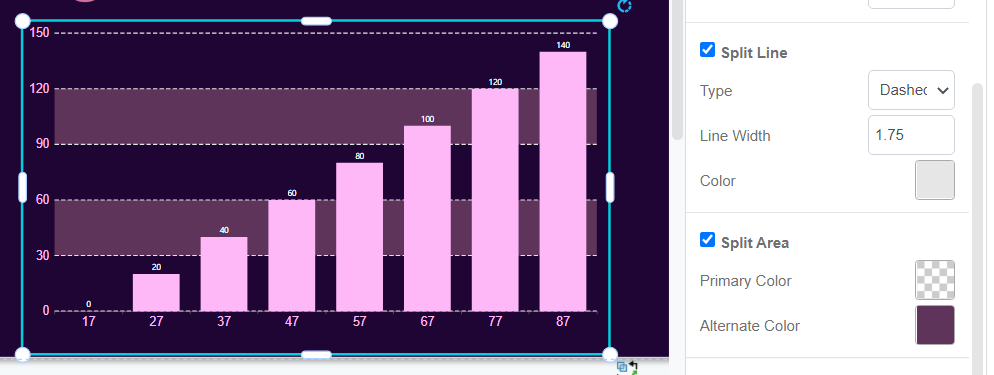
Customize the Split Line and Split Area
With clearer split line and area, we can clearly see the around number and differences between different bars as we know the amount represented by each of the parts.

This post is also available in Deutsche, Español, فارسی, Français, Bahasa Indonesia, 日本語, Polski, Portuguese, Ру́сский, Việt Nam, 简体中文 and 繁體中文.


