Home » Archives for Admin » Page 63
https://www.youtube.com/watch?v=NGtaVzlM7pc Stand apart from other job seekers with a CV that is unique and looks professional. Use InfoART’s CV builder to customize our resume template by changing the images and icons. Visualize bored information with an InfoART component that draws the attention of your audiences. Choose among the hundreds of layout that provides the best visual representation of your data. Get Started for Free Edit this Template No Design Skills Required Visual Paradigm Online offers following which helps user to create infographic artwork in few clicks: Dozen of professional infographics templates Thousands of…
continue reading →
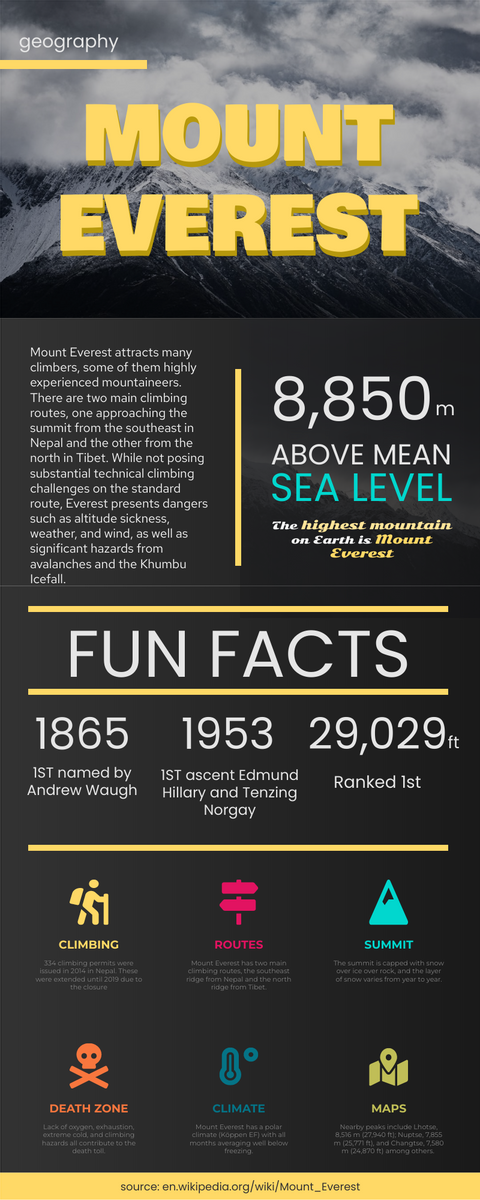
Mount Everest lies at the top of the Himalayas, across the border between Nepal and Tibet.
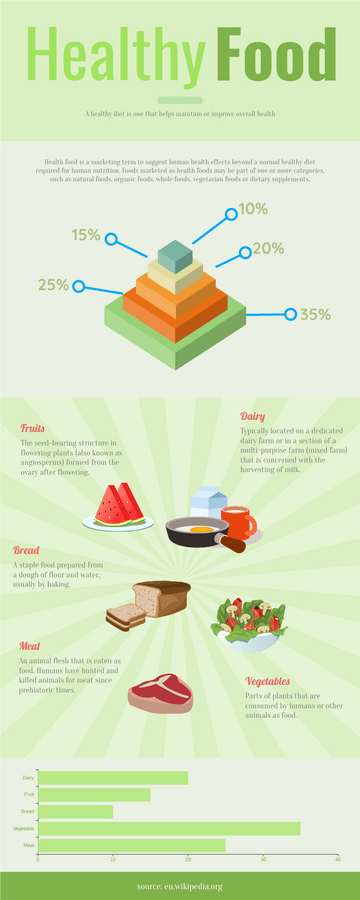
It is important to stay healthy during COVID. Here is a quick infographic illustrating which type of food will help you stay healthy.
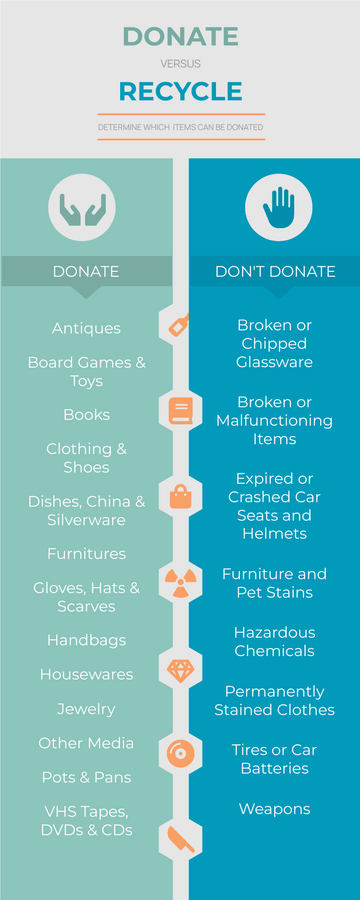
We can prepared a simple one-paged infographic to what to bring in the charity shop the next time you clean up, to help you save time for the next journey to the charity shop.
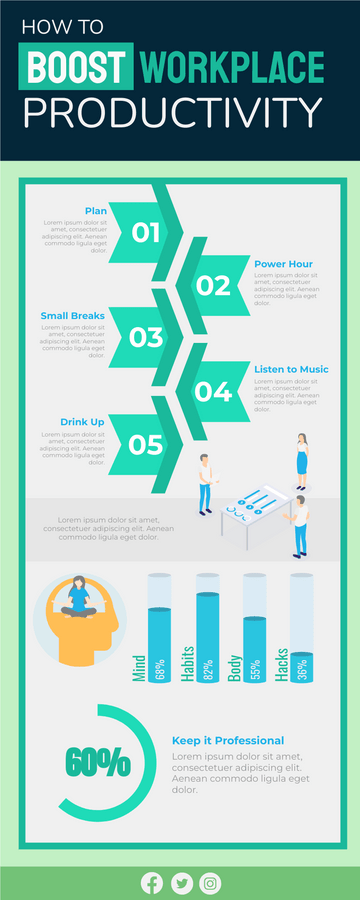
Increasing productivity for employees is about creating incentives for employees to work harder, but also smarter.
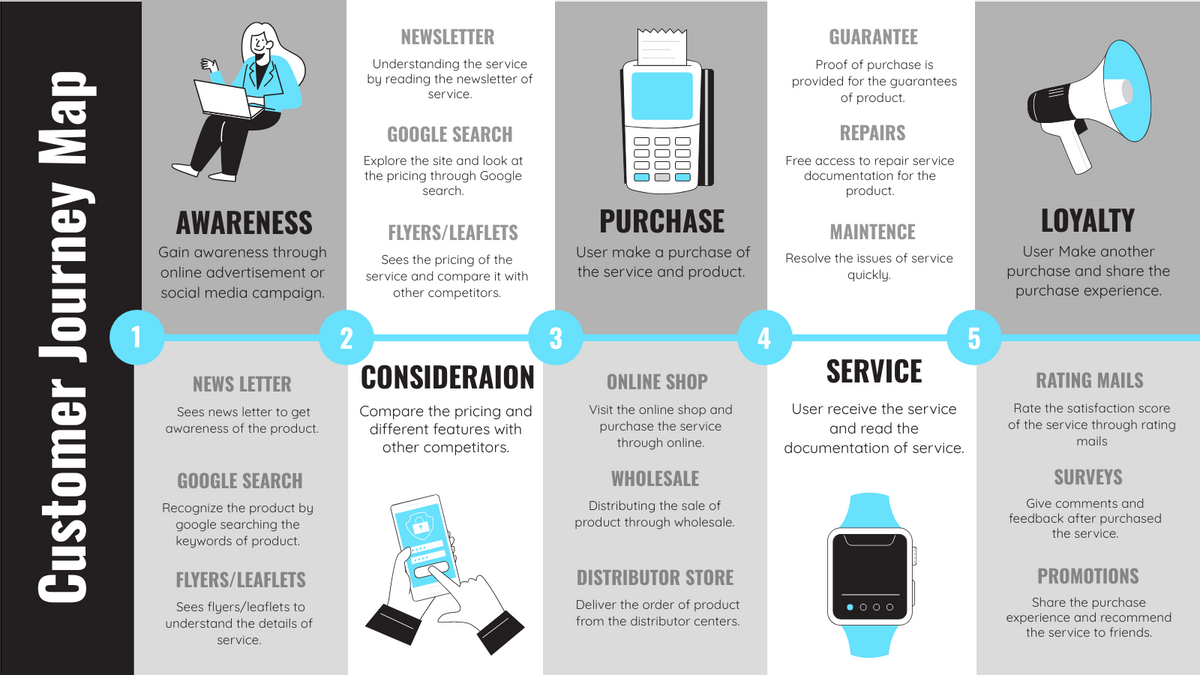
Introducing VP InfoART - the ultimate tool for creating captivating and visually stunning customer journey map posters! With thousands of FREE handcrafted templates at your fingertips, you'll be able to transform your retail store's customer journey into an engaging visual story. In our step-by-step video tutorial, we'll guide you through the process of creating a customer journey map poster from one of our bundled templates. Starting at 00:04, you'll learn how to choose the perfect template to kickstart your modification journey. Edit this Template The possibilities with VP InfoART are endless. Whether you're…
continue reading →
Visual Paradigm InfoART is an innovative online content platform that revolutionizes the way individuals approach graphic design. By offering an intuitive interface and an extensive collection of professional templates, editable icons, fonts, data visualizations, and download options, InfoART empowers users to create stunning and impactful artwork with minimal effort. This article explores the key features of Visual Paradigm InfoART, highlighting its ability to transform anyone into a proficient designer. https://www.youtube.com/watch?v=bJA9dduIUnU Template Library and User-Friendly Interface: Visual Paradigm InfoART presents users with a wide selection of pre-designed infographics templates, ensuring a diverse range of…
continue reading →
Creating a gift card just got easier with Visual Paradigm Online! If you're looking to create a personalized gift card for your business or for personal use, Visual Paradigm Online has you covered. With hundreds of free gift card templates available, you can browse through and find the perfect design that suits your needs. Simple and Easy to use To get started, simply sign up for a free account on Visual Paradigm Online. Once you're logged in, head over to the "Gift Card" section and choose a template that you like. From there,…
continue reading →
It’s that time of the year again! Christmas holidays are on its way, needless to say it is the perfect time to show people how much they mean to you. You can make someone’s Christmas extra special by sending a card you’ve created yourself. There’s no need to grab scissors and glue, simply choose a template that you love the most and start personalising it with your own special message. Once you’re done, you can print it, share it or send it via email. It’s super convenient and easy to customise. What are…
continue reading →
Infographics (a clipped compound of “information” and “graphics”) are graphic visual representations of information, data or knowledge intended to present information quickly and clearly. – Wikipedia Infographics are a powerful tool for displaying data, explaining concepts, simplifying presentations, mapping relationships, showing trends and providing essential insights. Usage of Infographics Infographics can improve cognition by utilizing graphics to enhance the human visual system’s ability to see patterns and trends. Similar pursuits are information visualization, data visualization, statistical graphics, information design, or information architecture. Show the best and worst values in a data set Demonstrate…
continue reading →

