How to Create Cause & Effect (Fishbone) Diagram from Text using Visual Paradigm Smart Board for FREE

How to Create Cause & Effect (Fishbone) Diagram from Text using Visual Paradigm Smart Board for FREE

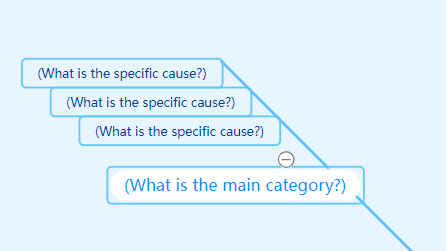
Learn how to create a cause and effect (fishbone) diagram from text using Visual Paradigm Smart Board. Follow our step-by-step instructions and discover how to efficiently organize ideas, represent relationships, and enhance problem-solving processes. Check out our instructional video for a visual guide. Start creating impactful diagrams for free!
How to Create Work Breakdown Structure Diagram using Visual Paradigm Smart Board

How to Create Work Breakdown Structure Diagram using Visual Paradigm Smart Board

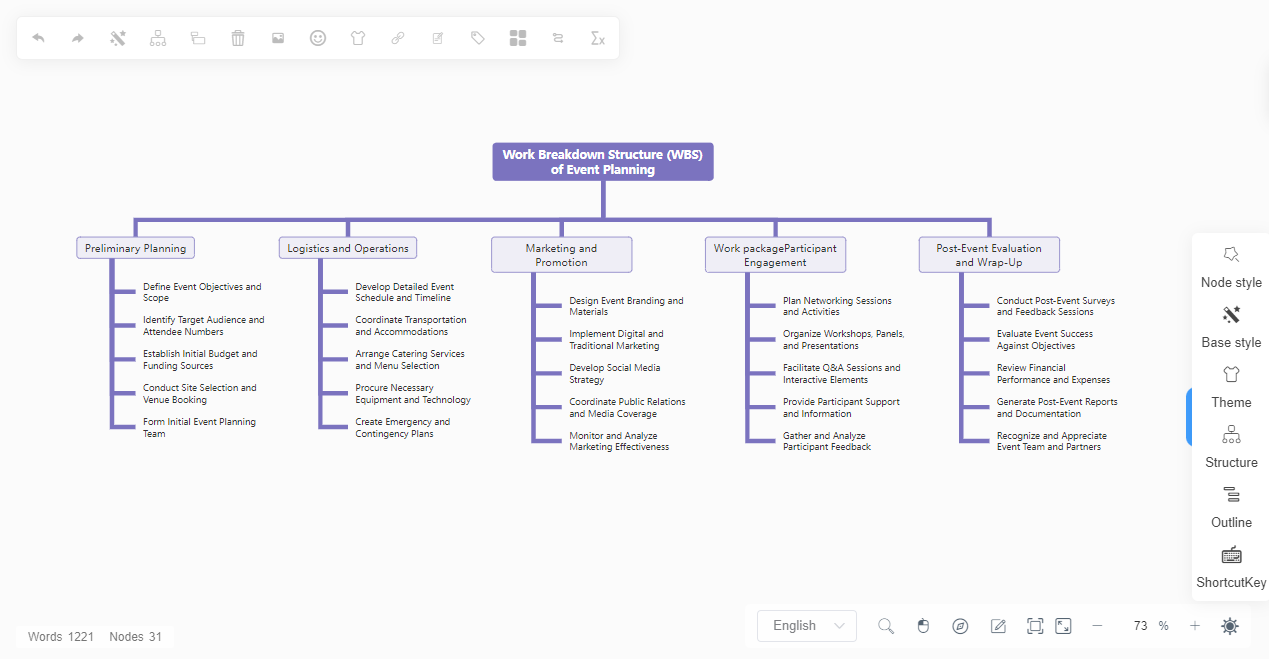
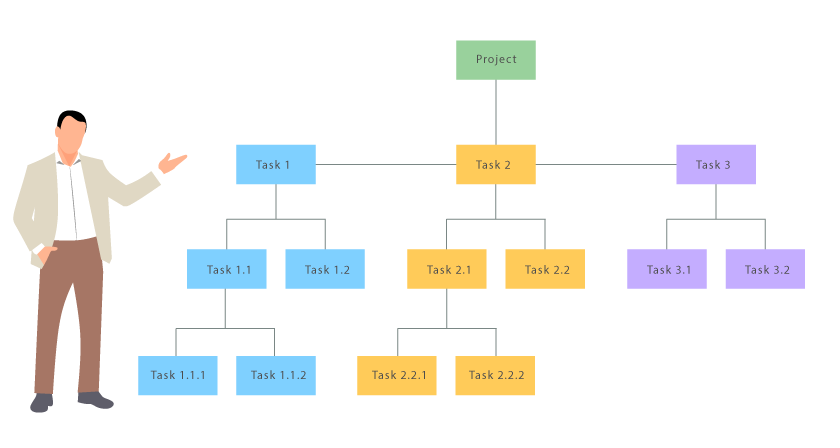
The Work Breakdown Structure (WBS) Diagram is a powerful tool for organizing and visualizing project tasks and deliverables. With Visual Paradigm Smart Board, creating a WBS diagram is a straightforward process that allows users to define project scope, break down work into manageable components, and establish clear relationships between tasks. In this article, we will explore how to leverage the WBS diagram feature in Visual Paradigm Smart Board to streamline project planning and execution. More About A Breakdown Structure Diagram The Work Breakdown Structure Diagram is an essential tool used in project management…continue reading →
How to Create Concept Map using Visual Paradigm Smart Board

How to Create Concept Map using Visual Paradigm Smart Board

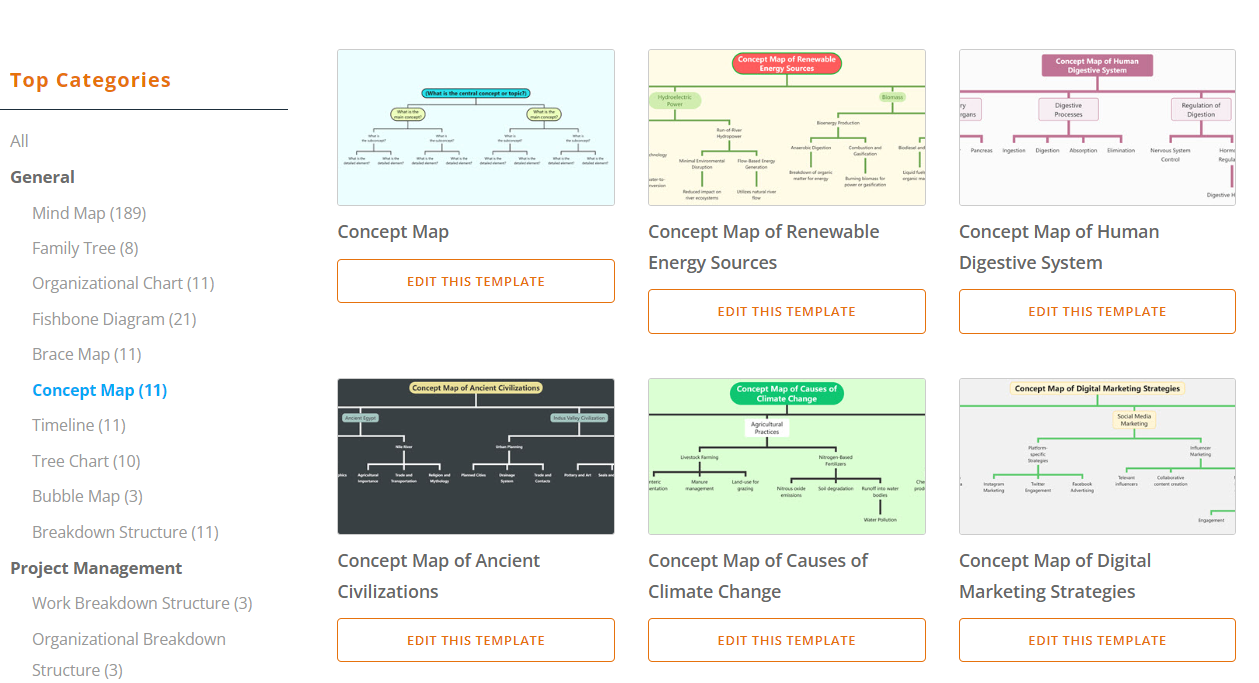
"Learn how to create visually engaging concept maps for your business projects using Visual Paradigm Smart Board. Explore the importance of concept maps in business communication and discover step-by-step instructions for efficient creation. Enhance collaboration, clarity, and decision-making with this powerful tool.
How to Create Resource Breakdown Structure Diagram using Visual Paradigm Smart Board

How to Create Resource Breakdown Structure Diagram using Visual Paradigm Smart Board

Efficiently visualizing and managing resources is crucial for successful project planning and execution. Visual Paradigm Smart Board provides a user-friendly platform for creating Resource Breakdown Structure (RBS) diagrams. With its intuitive interface and comprehensive features, you can easily represent the hierarchy and allocation of resources. In this guide, we will walk you through the steps to create an RBS diagram using Visual Paradigm Smart Board, allowing you to effectively organize and communicate resource dependencies within your project. https://www.youtube.com/watch?v=gicEipO_ks4 To create a Resource Breakdown Structure (RBS) diagram using Visual Paradigm Smart Board, follow these…continue reading →
How to Create Bubble Map using Visual Paradigm Smart Board

How to Create Bubble Map using Visual Paradigm Smart Board

Visual Paradigm Smart Board offers a convenient and user-friendly platform for creating engaging bubble maps. Whether you're brainstorming ideas, organizing concepts, or visualizing relationships, Visual Paradigm Smart Board provides the tools you need to bring your bubble maps to life. And the best part? It's available for free. In this guide, we will walk you through the simple steps to create a bubble map using Visual Paradigm Smart Board. https://www.youtube.com/watch?v=VdR59-oeILQ Launch Visual Paradigm Smart Board and Select the Bubble Map Template To begin, launch Visual Paradigm Smart Board on your device. In your…continue reading →
How to Create Risk Breakdown Structure Diagram

How to Create Risk Breakdown Structure Diagram

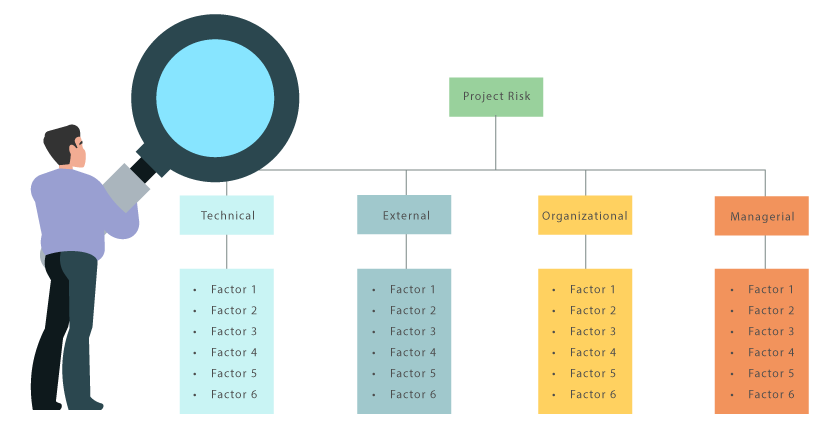
The use of a Risk Breakdown Structure (RBS) offers numerous benefits, including comprehensive risk identification, proactive risk management, improved communication and collaboration, informed decision-making, and effective risk monitoring and control. It helps organizations navigate uncertainties and challenges, ultimately increasing the likelihood of project success. Visual Paradigm Smart Board offers a user-friendly and customizable platform for creating Risk Breakdown Structures (RBS) at no cost. With its intuitive interface and flexible features, you can easily create an RBS that suits your needs. What is a Risk Breakdown Structure A Risk Breakdown Structure (RBS) diagram is…continue reading →
How to Create Cost Breakdown Structure Diagram

How to Create Cost Breakdown Structure Diagram

Creating a Cost Breakdown Structure (CBS) diagram is a systematic process that involves categorizing and organizing project expenses. Visual Paradigm Smart Board offers a user-friendly and collaborative environment to create CBS diagrams efficiently. With its free access and intuitive features, it can be a valuable tool for businesses seeking to create, share, and collaborate on CBS diagrams effectively. What is a Cost Breakdown Structure A Cost Breakdown Structure (CBS) diagram is a visual representation that organizes project expenses into different categories and subcategories. It provides a hierarchical view of how costs are distributed and…continue reading →
How to Create Mind Map from Text using Visual Paradigm Smart Board for FREE

How to Create Mind Map from Text using Visual Paradigm Smart Board for FREE

Creating a mind map from text can be a powerful way to visually organize ideas and concepts. With Visual Paradigm Smart Board in Visual Paradigm Online, you can easily create mind maps from text without any cost. In this guide, we will walk you through the process of creating a mind map using Visual Paradigm Smart Board. By accessing the Smart Board, selecting the mind map option, and editing the text content, you can effortlessly transform your ideas into a visually appealing mind map. Let's explore the steps involved in creating a mind…continue reading →
How to Create Organization Chart using Visual Paradigm Smart Board

How to Create Organization Chart using Visual Paradigm Smart Board

Visual Paradigm Online is a powerful and user-friendly diagramming tool that offers a wide range of features to create professional-quality visual representations. One of its key features, the Smart Board, provides a seamless and intuitive way to create organizational charts. With Visual Paradigm Smart Board, users can easily design and customize organizational charts, depicting the hierarchical structure of their organizations. This tool allows users to add nodes, edit text content, and apply various styles to create visually appealing and informative charts. In this article, we will explore the step-by-step process of creating an…continue reading →