Home » Archives for June 2022 » Page 3
-
Posted on June 14, 2022
-
/Under Chart
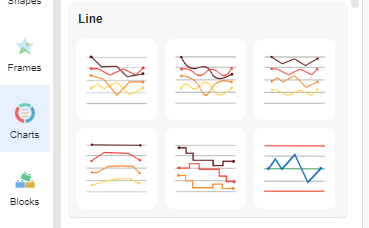
The formal expression used to describe a linear graph is linear whether it passes through the origin or not, and the relationship between the two variables is called linear. Similarly, the relationship shown by a curve graph is called non-linear. A curved line chart will indicate change. In this video, you can see how to create a curved line chart in VP Online.
Having many elements on your design can be confusing to manage. This tutorial will show you how to arrange elements above or below each other to create the best design. Watch it now and feel free to create your own design at VP online.
-
Posted on June 14, 2022
-
/Under Chart
In Visual Paradigm Online, you can easily create graphics with the online design tool for free. Sometimes, we need to record data for a particular use and sometimes we may need to present the data through graphics. In Visual Paradigm Online, you can create various charts freely like bar charts, column charts, pie charts, etc. This chart tool can help you to display any data by using text, symbols, and graphics. You can easily visualize the data that you have collected as graphics and they are presentable. This is a guide for teaching…
continue reading →
-
Posted on June 14, 2022
-
/Under Chart
Visual Paradigm Online provides you with an online design tool for everyone to use. In Visual Paradigm Online, you can create various charts freely like bar charts, column charts, pie charts, etc. This chart tool can help you to display any data by using text, symbols, and graphics. You can easily visualize the data that you have collected as graphics and they are presentable. You can also edit the chart easily with the data, chart titles, chart colors, fonts, etc... This is a guide for teaching you to add chart titles on chart…
continue reading →
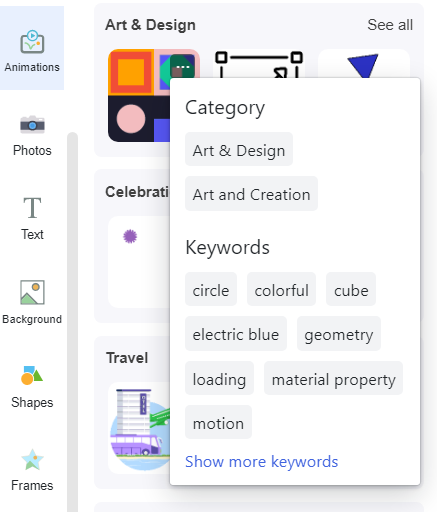
When creating animated flipbook, instead of adding animation effects to different text and images, we can also choose to add animated shapes. There are now 1000+ pre-made animated shapes in the library of VP Online. In this article, you can know how to find out similar animated elements that fit your needs. https://www.youtube.com/watch?v=9ZY8JiswpHE&width=854&height=480 Category and Keywords All animates shapes have category and keywords, which can help us to search the animated shapes we need and find similar elements easily. You can find them by clicking the "..." on the top right corner of…
continue reading →
To make our flipbook more attractive, adding animation is an effective method. Animation adds a dynamic element to your content, making it more engaging and visually appealing to readers. While VP Online provides various animation effects, there's now an additional way to create animated flipbooks: using animated shapes. Animated shapes come with pre-built animations, making it easy to enhance your animated flipbook with captivating effects. By simply adding these animated shapes to your pages, you can create a more interactive and lively flipbook experience for your audience easily. https://www.youtube.com/watch?v=M0Lq-4hdhpA&width=854&height=480 Where To Find The…
continue reading →
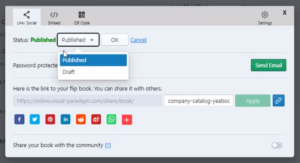
When you publish a flipbook on Fliplify, you can easily share your flipbook with others. After you share the flipbook, you can also freely control sharing or stop sharing the flipbook. This video will show you how to uncaring a flipbook in Visual Paradigm. https://www.youtube.com/watch?v=4-DMgo4yqEc&width=854&height=480 You can unshare your flipbook, by pressing the Share button of your book under My Flipbooks. Then change the publish status to Draft, and press OK to confirm the change. Tips When you stop sharing your flipbook, your flipbook will not show in the Visual Paradigm Online Flipbook…
continue reading →
-
Posted on June 13, 2022
-
/Under Chart
Control charts are a statistical process control tool used to determine if a manufacturing or business process is in a state of control. This video will show you how to create a control chart in Visual Paradigm Online. https://www.youtube.com/watch?v=IEG6O0eLZrg&width=854&height=480 What is A Control Chart Control charts are a statistical process control tool used to determine if a manufacturing or business process is in a state of control. It is more appropriate to say that the control charts are the graphical device for Statistical Process Monitoring (SPM). Traditional control charts are mostly designed to…
continue reading →
-
Posted on June 13, 2022
-
/Under Chart
You can easily create graphics with the online design tool for free in Visual Paradigm Online for free. Sometimes, we need to record data for a particular use and sometimes we may need to present the data through graphics. With this design tool, you can create various charts freely like bar charts, column charts, pie charts, etc. This chart tool can help you to display any data by using text, symbols, and graphics. You can easily visualize the data that you have collected as graphics and they are presentable. This is a guide…
continue reading →
-
Posted on June 13, 2022
-
/Under Diagram
In Visual Paradigm Online, you can create diagrams easily with the online design tool for free. There are dozens of diagram templates for you to create your own diagram that can save your time. When you are editing diagrams, sometimes the elements like texts may be appeared outside the shape bound. This tutorial will guide you on how to specify the position of the texts inside the shape. You can watch the attached guide video or read through the guide below. https://www.youtube.com/watch?v=ZzPsFA0jwIo&width=854&height=480 Select the element To specify the location of texts inside the…
continue reading →


