How to create a floating bar chart?

How to create a floating bar chart?

We often record data for a particular use and sometimes we may need to present the data through graphics. In Visual Paradigm Online, you can create various charts freely like bar charts, column charts, pie charts, etc. This chart tool can help you to display any data by using text, symbols, and graphics. You can easily visualize the data that you have collected as graphics and they are presentable. This is a guide for teaching you to create a chart with Visual Paradigm Online. You can watch the attached video or read the…continue reading →
Create a 100% Stacked Bar Chart

Create a 100% Stacked Bar Chart

A 100% stacked column chart is an Excel chart type, it is useful for showing the change in proportion over time. This video will show you how to create a 100% Stacked Bar Chart in the Visual Paradigm Online. https://www.youtube.com/watch?v=IrjLGSG88mQ&width=854&height=480 What is 100% Stacked Bar Chart? The 100% Stacked Bar Chart is an Excel chart type designed to show the relative percentages of multiple data series using stacked bars, where the sum (cumulative) of each stacked bar always equals 100%. Like a pie chart, a 100% stacked bar chart shows the relationship of…continue reading →
Create a stacked area chart

Create a stacked area chart

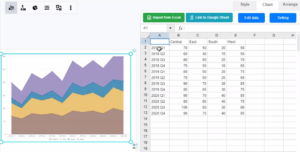
A stacked area chart is a major Excel chart type that shows a series of data stacked up with filled areas. Stacked area charts can show how the relationship of parts to the whole changes over time. This video will show you how to create a stacked area chart in Visual Paradigm Online. https://www.youtube.com/watch?v=eyY0aGkgBfg&width=854&height=480 What is a stacked area chart? A stacked area chart is an extension of the basic area graph. It shows the evolution of the values of several groups on the same graph. The values of each group are displayed…continue reading →
Create A Line Chart

Create A Line Chart

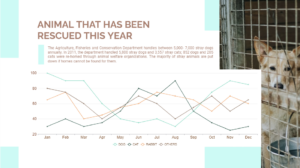
A line chart (also called a line plot or line graph) is a graph that uses a line to connect individual data points. The line chart displays quantitative values over a specified time interval. Line charts are often used to describe the historical price movements of an asset or security in finance. This video will show you how to create a line chart in Visual Paradigm Online. https://www.youtube.com/watch?v=PnLJI8xrdUY&width=854&height=480 What is a line chart? A line chart is a chart type of built-in Excel where each data series is plotted as a separate line.…continue reading →
Create a Scatter Chart

Create a Scatter Chart

A scatter plot (also called a scatterplot, scatter graph, scatter chart, scattergram, or scatter diagram) is a type of plot or mathematical diagram using Cartesian coordinates to display values for typically two variables for a set of data. This video will show you how to create a scatter chart in the visual paradigm online. https://www.youtube.com/watch?v=Qgigt1oH3I4&width=854&height=480 What is a Scatter Chart? A Scatter Chart is a type of plot or mathematical diagram using Cartesian coordinates to display values for typically two variables for a set of data. The data are displayed as a collection…continue reading →
How to Create a Pareto Chart

How to Create a Pareto Chart

Pareto charts are often used to identify early areas of focus in process improvement. A Pareto chart is an ordered frequency count of the values of different levels of a categorical or nominal variable. Learn how to create your own pareto chart in the below video!!! The steps in creating pareto chart: Click on charts panel on the left and select pareto chart Drag the chart into your canvas and adjust the size Click on chart panel on "right" and select edit data Replace the old data with your own data Edit your…continue reading →
Import chart data from excel

Import chart data from excel

Create charts easily with Visual Paradigm Online. You can easily edit your data in an intuitive spreadsheet editor. Visual Paradigm Online makes it simple to enter your information and turn it into a stunning chart. In this video, you can see how to import chart data from Excel in VP Online. https://www.youtube.com/watch?v=Vow9KSwjQ9U&width=854&height=480 Import chart data from Excel When editing a chart, you can go to Format Panel, chart, and click "edit data" to open the spreadsheet editor. Click "Import from Excel", and select the excel that you want to import in the chart…continue reading →
How to Create a Bar Chart?

How to Create a Bar Chart?

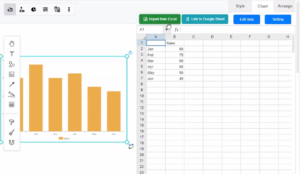
We often record data for a particular use and sometimes we may need to present the data through graphics. In Visual Paradigm Online, you can create various charts freely like bar charts, column charts, pie charts, etc. This chart tool can help you to display any data by using text, symbols, and graphics. You can easily visualize the data that you have collected as graphics and they are presentable. This is a guide for teaching you to create a bar chart with Visual Paradigm Online. You can watch the attached video or read…continue reading →
How To Create A Difference Chart

How To Create A Difference Chart

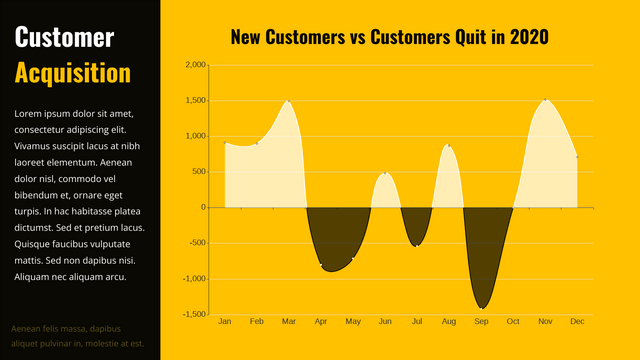
What Is A Difference Chart Unlike the other chart showing the data directly, difference chart show the difference between 2 groups of data. It is divided in to 2 side, the positive side and the negative side. By finding the difference the value of the 2 sides, we get the data to shown in this chart. When To Use Difference Chart As it shows the difference instead of the data, difference chart is not suitable for recording. It is more suitable when doing analysis as the data shown is already a result of…continue reading →
How to create an area chart?

How to create an area chart?

We often record data for a particular use and sometimes we may need to present the data through graphics. In Visual Paradigm Online, you can create various charts freely like bar charts, column charts, pie charts, etc. This chart tool can help you to display any data by using text, symbols, and graphics. You can easily visualize the data that you have collected as graphics and they are presentable. This is a guide for teaching you to create a area chart with Visual Paradigm Online. You can watch the attached video or read…continue reading →