Link chart data with Google Sheet

Link chart data with Google Sheet

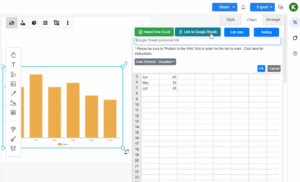
Visual Paradigm support visualizing your data into various charts. This feature gives you valuable insights to your data. The data can be visualized by entering with the build-in spreadsheet tool, uploading of Excel file, or directly linking from Google Sheets. In this article, we will show you how to feed data to your chart by link to Google Sheets. https://www.youtube.com/watch?v=bk44-JOvjpc&width=854&height=480 You can create any chart and link the chart data with Google Sheet when using the Visual Paradigm Online. In Google Sheets, you can go to "Share", and press the "Copy Link" button…continue reading →
How to create a 100% stacked column chart?

How to create a 100% stacked column chart?

The 100% cumulative bar chart is a type of Excel chart intended to display the relative percentages of multiple data series in a cumulative bar, where the sum (cumulative) of the cumulative bars always equals 100%. A bar chart stacked at 100% can show the ratio of part to total, for a period of time. Create charts easily with Visual Paradigm Online. In this video, you can see how to create a column and line chart in VP Online.
How to create a punch card?

How to create a punch card?

Punch cards allow you to display periodic trends in the data. Create charts easily with Visual Paradigm Online. In this video, you can see how to create create a punch card chart in VP Online.
How to create a column and line chart?

How to create a column and line chart?

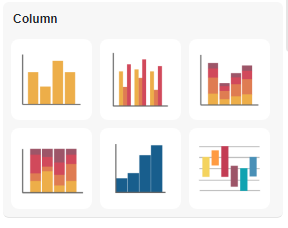
We often record data for a particular use and sometimes we may need to present the data through graphics. In Visual Paradigm Online, you can create various charts freely like bar charts, column charts, pie charts, etc. This chart tool can help you to display any data by using text, symbols, and graphics. You can easily visualize the data that you have collected as graphics and they are presentable. This is a guide for teaching you to create a column and line chart with Visual Paradigm Online. You can watch the attached video…continue reading →
How to Create a Pie Chart?

How to Create a Pie Chart?

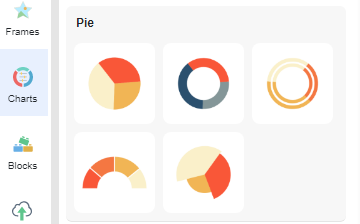
A pie chart (or pie chart) is a circular statistical figure divided into slices to illustrate numerical proportions. In a pie chart, the arc length of each wedge is proportional to the number it represents. Although it is named for its resemblance to a pie that has been cut into slices, there are variations in the way it is presented. Create charts easily with Visual Paradigm Online. In this video, you can see how to create a pie chart in VP Online.
How To Create A Bubble Chart

How To Create A Bubble Chart

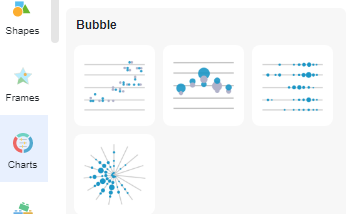
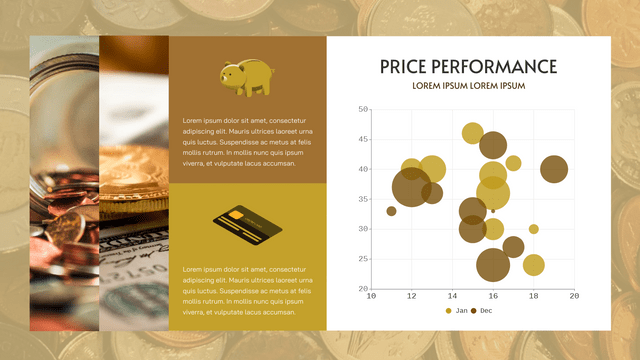
What Is A Bubble Chart Bubble chart shows the data by bubbles in different sizes and position, while colors can be used to represent different categories. As they are drawn in the same scale, we can clearly see the trend of specific issues over time. When To Use Doughnut Chart When there are more than 3 sets of data is going to show in a chart, then bubble chart will be a good choice for you. As they are shown as a bubble instead of a point or column, it will be difficult to…continue reading →
How to Create a Range Step Area Chart

How to Create a Range Step Area Chart

We often record data for a particular use and sometimes we may need to present the data through graphics. In Visual Paradigm Online, you can create various charts freely like bar charts, column charts, pie charts, etc. This chart tool can help you to display any data by using text, symbols, and graphics. You can easily visualize the data that you have collected as graphics and they are presentable. This is a guide for teaching you to create a range step area chart with Visual Paradigm Online. You can watch the attached video…continue reading →
How to Create a 100% Stacked Rose Chart

How to Create a 100% Stacked Rose Chart

Create 100% stacked rose charts in minutes with Visual Paradigm's easy to use online 100% stacked rose chart maker. It features a rich collection of chart type and an intuitive chart maker that helps you in creating stunning charts effortlessly. No design or coding skills required. Would you like to create your own 100% rose chart, click here!!
How to switch chart type?

How to switch chart type?

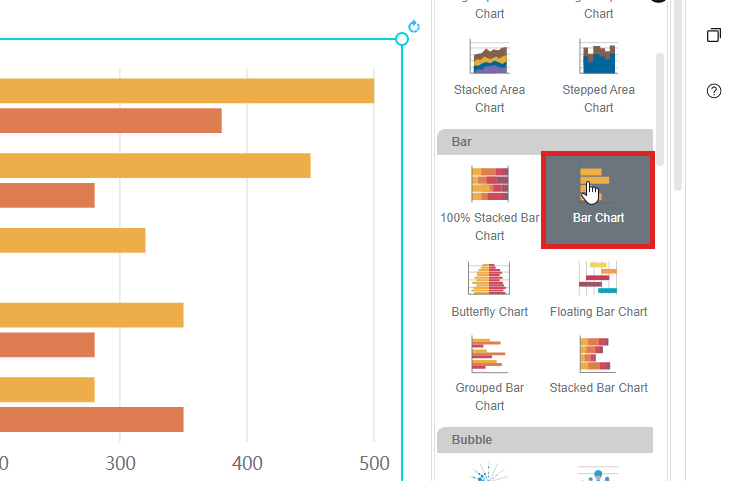
In Visual Paradigm Online, you can design your own charts with our online design tool. We often record data and sometimes we may need to present the data through graphics. With Visual Paradigm Online design tool, you can create various charts freely like bar charts, column charts, pie charts, etc. This chart tool can help you to display any data by using text, symbols, and graphics. You can easily visualize the data that you have collected as graphics and they are presentable. This is a guide for teaching you to switch chart types.…continue reading →
How To Create A Rose Chart

How To Create A Rose Chart

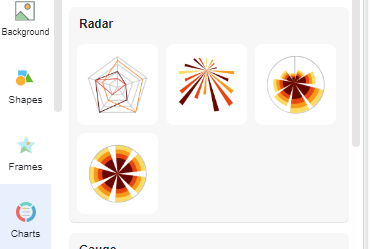
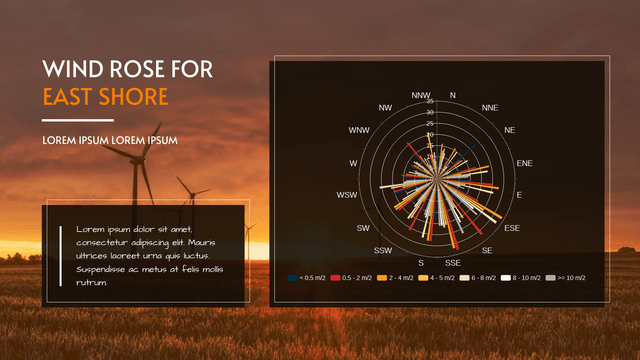
What Is A Rose Chart Rose chart shows data in 360 degrees with a shape of a compass. Is is commonly divided into 8 to 16 parts to show geography data. With different size and colors, we can see the difference between data clearly without calculating each part of them. When To Use Rose Chart As amount and direction can be shown in the chart clearly, rose chart is commonly used in data analysis of geography fieldwork. However, there is an important when reading rose chart that the outer segment does not represent…continue reading →