Change Symbols of Line Chart

Change Symbols of Line Chart

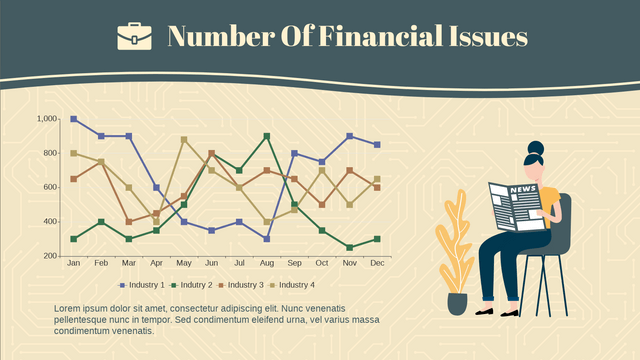
When creating line chart, we can do lots of customization on it, including the color, lines, size, etc. Moreover, we can change the symbol of the chart. This article will show you how to do it. https://www.youtube.com/watch?v=LDoLN6i8vd8&width=854&height=480 How To Change Symbols of Line Chart After selecting a line chart, go to Panel-Chart, we can see a part called Line. Under it, there is 3 sections: Symbol (shape of the symbol) Symbol Size Line Width We can find various choices under the symbol, choose the one mostly fit your design. You can then control…continue reading →
How to Adjust the Split Line of a Chart

How to Adjust the Split Line of a Chart

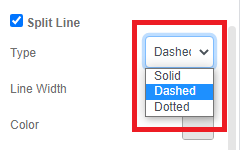
Always match your presentation flow by adjusting every detail of your chart including the split line color and types. Create charts easily with Visual Paradigm Online. In this video, you can see how to adjust the split line of a chart in VP Online.
How to Create a Step Chart

How to Create a Step Chart

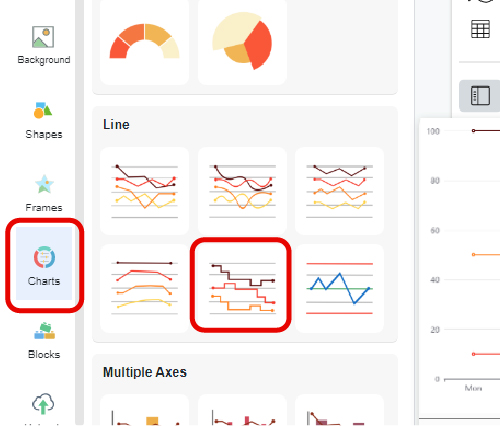
A step chart can be useful if you have to display the data that changes at irregular intervals and remains constant between the changes. Create charts easily with Visual Paradigm Online. In this video, you can see how to create a stepped chart in VP Online.
How to create a 360 punch card?

How to create a 360 punch card?

In Visual Paradigm Online, you can easily create graphics with the online design tool for free. Sometimes, we need to record data for a particular use and sometimes we may need to present the data through graphics. With the design tool in Visual Paradigm Online, you can create various charts freely like bar charts, column charts, pie charts, etc. This chart tool can help you to display any data by using text, symbols, and graphics. You can easily visualize the data that you have collected as graphics. This is a guide for teaching…continue reading →
How to create a map?

How to create a map?

In Visual Paradigm Online, you can easily create graphics with the online design tool for free. Sometimes, we need to record data for a particular use and sometimes we may need to present the data through graphics. With the design tool in Visual Paradigm Online, you can create various charts freely like bar charts, column charts, pie charts, etc. This chart tool can help you to display any data by using text, symbols, and graphics. You can easily visualize the data that you have collected as graphics. This is a guide for teaching…continue reading →
How to Create a Simple Gantt Chart

How to Create a Simple Gantt Chart

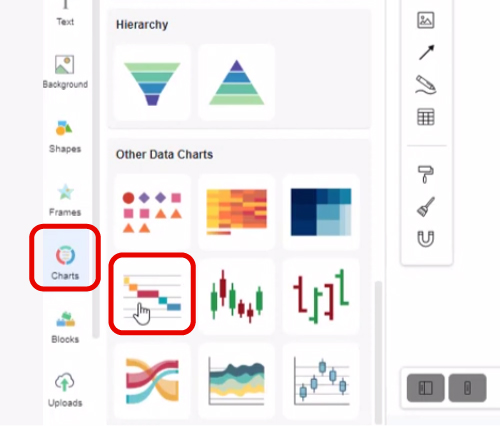
Gantt charts help teams to plan work around deadlines and properly allocate resources. Turn your raw data into beautiful charts with our online Gantt chart maker. Visual Paradigm Online features a rich collection of chart types and chart templates. Create your chart easily and quickly now!
Create a stacked column and line chart

Create a stacked column and line chart

A stacked column and line chart is a combination of a Line Chart and a vertical Stacked Bar chart. This video will show you how to create a stacked column and line chart in Visual Paradigm Online. https://www.youtube.com/watch?v=ir8vhCsumW4&width=854&height=480 What is a stacked column and line chart? A stacked column and line chart is a combination of a Line Chart and a vertical Stacked Bar chart. A stacked column and line chart is similar to a Grouped Bar with Line Chart—the only difference is that in a standard Grouped Bar with Line chart, each…continue reading →
Hide the legend of a chart

Hide the legend of a chart

Visual Paradigm Online can help you make beautiful charts online with a free chart maker. Create charts with custom styles in minutes. This video will show you how to hide the legend of a chart in Visual Paradigm Online. https://www.youtube.com/watch?v=Ca3DTYlBxsk&width=854&height=480 Visual Paradigm Online makes it simple to enter in your information and turn it into a stunning chart. You can also easily customize your chart to match your company's brand colors and fonts or choose the color that matches your topic. Customize everything, from the fonts and colors to the position of titles…continue reading →
How to create a pictorial chart?

How to create a pictorial chart?

Sometimes, we need to record data for a particular use and sometimes we may need to present the data through graphics. With the design tool in Visual Paradigm Online, you can create various charts freely like bar charts, column charts, pie charts, etc. This chart tool can help you to display any data by using text, symbols, and graphics. You can easily visualize the data that you have collected as graphics. This is a guide for teaching you to create a 360 punch card with Visual Paradigm Online. You can watch the attached…continue reading →
How to create gauge chart?

How to create gauge chart?

You can easily create graphics in Visual Paradigm Online for free. Sometimes, we need to record data for a particular use and sometimes we may need to present the data through graphics. With the design tool in Visual Paradigm Online, you can create various charts freely like bar charts, column charts, pie charts, etc. This chart tool can help you to display any data by using text, symbols, and graphics. You can easily visualize the data that you have collected as graphics. This is a guide for teaching you to create a gauge…continue reading →