Create a flowchart in a presentation
In VP Online, you can create a flowchart by selecting the flowchart tool, then design a flowchart into your works.
What is Flowchart
A flowchart is a type of diagram that represents a workflow or process. A flowchart can also be defined as a diagrammatic representation of an algorithm, a step-by-step approach to solving a task. The flowchart shows the steps as boxes of various kinds, and their order by connecting the boxes with arrows.
Create a flowchart in a presentation
When creating a presentation, you can create a flowchart for your works. You can edit, expand and style your flowchart as you need.
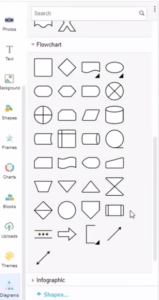
- Select Diagrams on the left-hand side, then scroll down to the flowchart category.
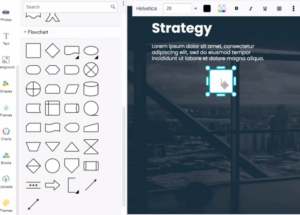
- You can see a lot of flowchart elements in the category, you can drag and drop the elements to create a flow chart in your design, and enter text in the flowchart.
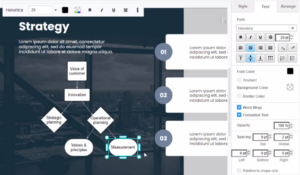
Change the flowchart style
After creating a flowchart in your design, you can change the flowchart style in the format panel.
- Select one or more shapes or connectors then change their style using the format panel on the right.
- The color of the columns can be adjusted under the “Style” section of the format panel.
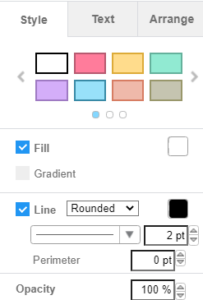
- The font color and font size can also be adjusted, under the “Text” sections in the format panel.
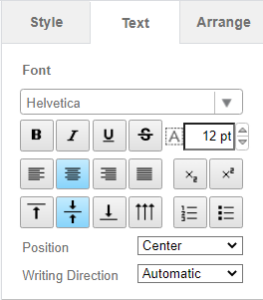
- Use the toolbar under the drawing canvas to change the zoom and work with details, undo or redo changes, move shapes forwards or backward, work with styles, change connectors, and more.
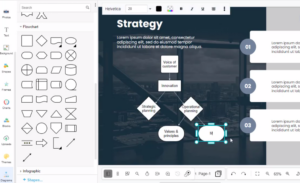
Tips: You can replace an element with another one after design, without re-creating its content.
Learn more: Replace Existing Shapes
This post is also available in Deutsche, English, Español, فارسی, Français, Bahasa Indonesia, 日本語, Polski, Portuguese, Ру́сский, Việt Nam, 简体中文 and 繁體中文.


