How to create a stacked rose chart?
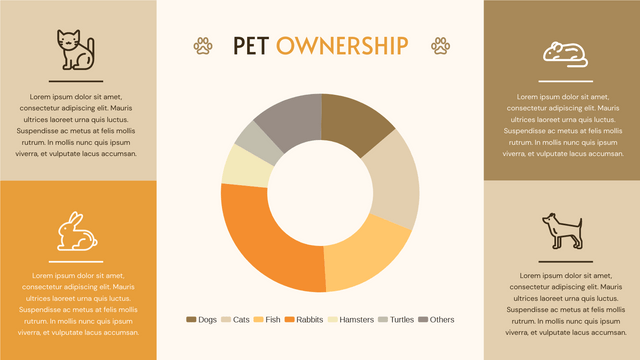
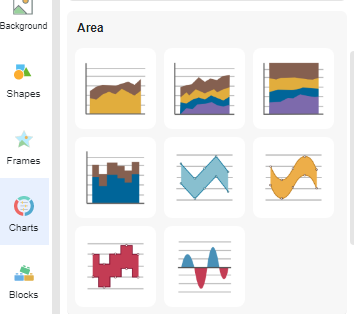
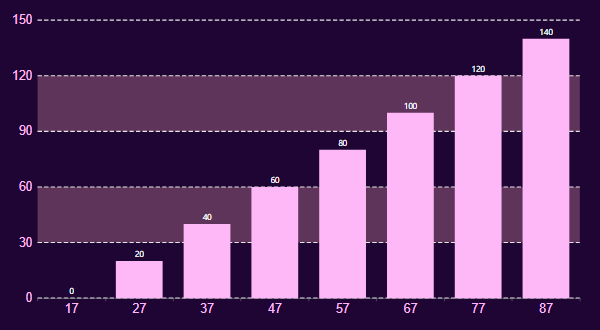
We often record data for a particular use and sometimes we may need to present the data through graphics. In Visual Paradigm Online, you can create various charts freely like bar charts, column charts, pie charts, etc. This chart tool can help you to display any data by using text, symbols, and graphics. You can easily visualize the data that you have collected as graphics and they are presentable. This is a guide for teaching you to create a stacked rose chart with Visual Paradigm Online. You can watch the attached video or…continue reading →


