How to Add Logic Gates to Electrical Diagram

How to Add Logic Gates to Electrical Diagram

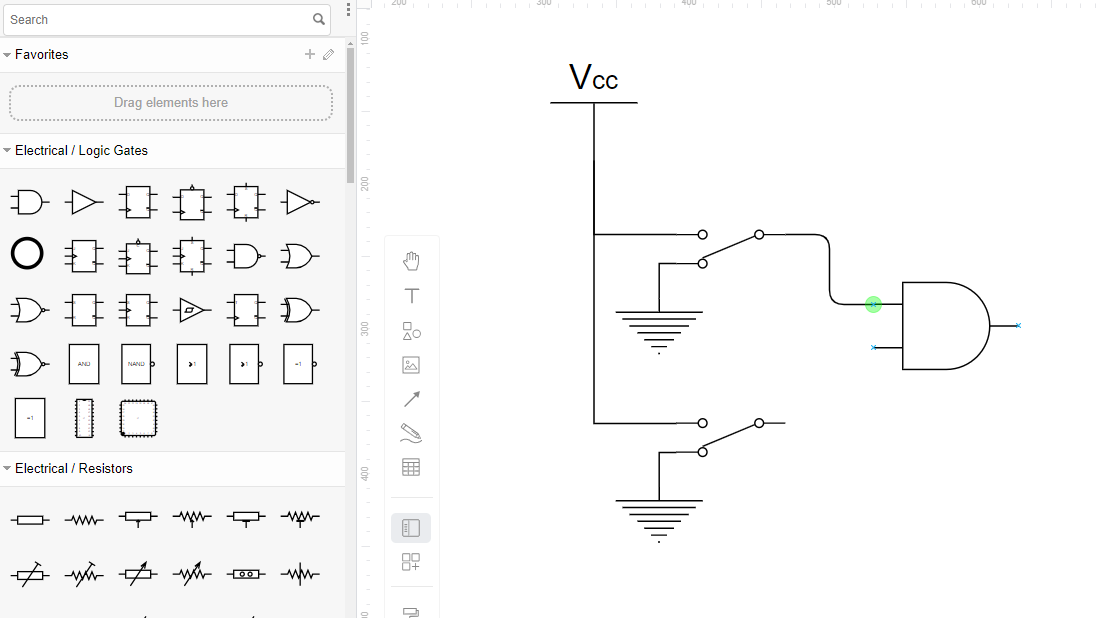
An electrical diagram serves as a visual representation of electrical circuits, components, and connections, providing a blueprint for understanding and designing complex electrical systems. With the intuitive interface and comprehensive features of Visual Paradigm Online, creating electrical diagrams becomes a simple and straightforward process. In this article, we will guide you through the process of incorporating logic gates into your electrical diagrams, empowering you to accurately represent and analyze the logic of your electrical circuits. About Logic Gate Logic gates are fundamental building blocks in digital electronics, used to perform logical operations on…continue reading →
How to Avoid Dimension Figure Overlapped with Dimension Line in Floor Plan

How to Avoid Dimension Figure Overlapped with Dimension Line in Floor Plan

A floor plan serves as a comprehensive visual representation of a space's layout and design, facilitating effective communication and planning in architectural and interior design projects. Utilizing Visual Paradigm Online, creating floor plans becomes a straightforward process. However, the intricacies of floor plans often lead to issues such as dimension figures overlapping with dimension lines. If you encounter this problem or similar issues, this article provides solutions to address them effectively. Avoid Dimension Figure Overlapped with Dimension Line in Floor Plan https://www.youtube.com/watch?v=IFnPLXFP_Fs&feature=youtu.be On your floor plan, you may need to mark many details…continue reading →
Why my Diagram not Fully Export into Image File?

Why my Diagram not Fully Export into Image File?

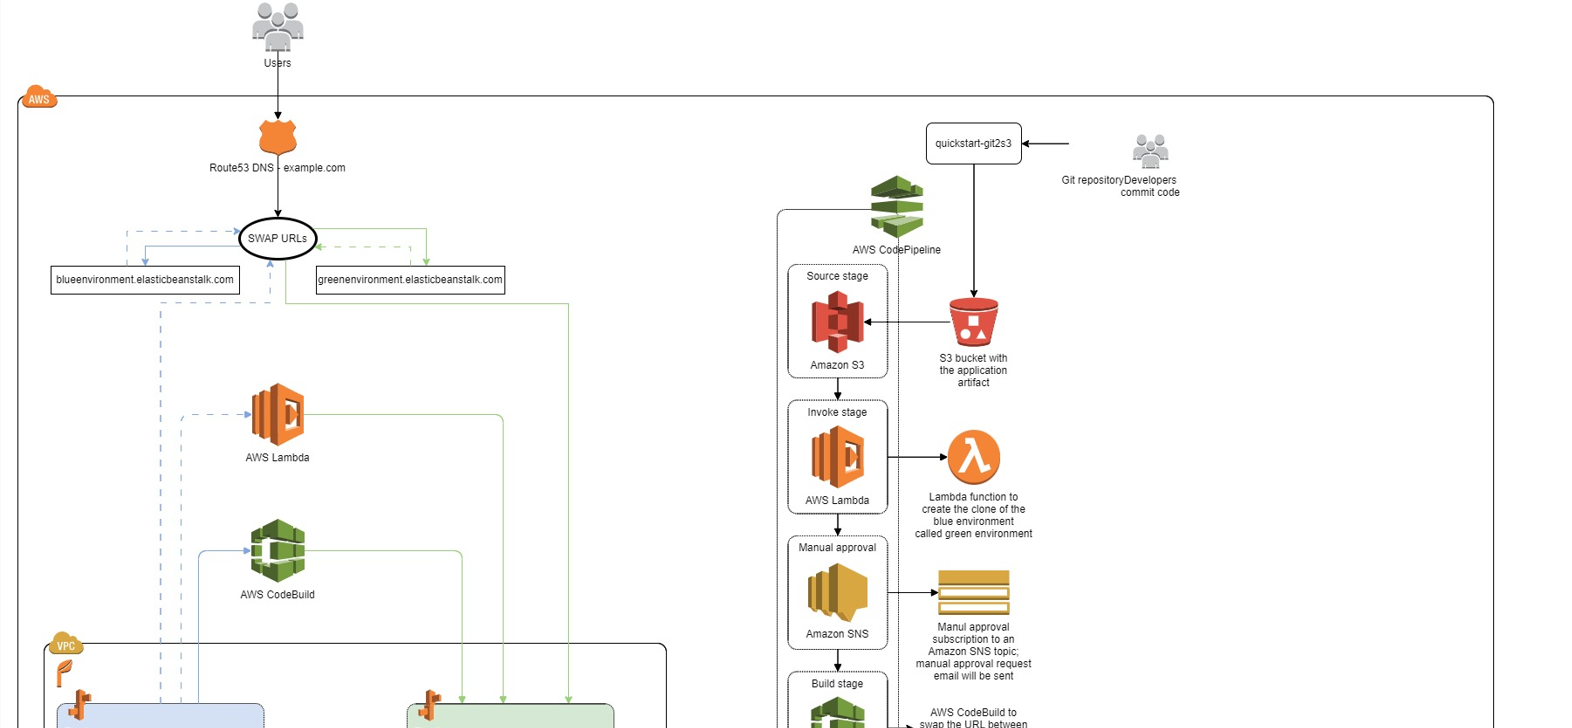
Visual Paradigm serves as a professional tool for crafting valuable diagrams tailored to our specific requirements. Upon completion, we often export these diagrams into various formats, including images, to meet our diverse needs. Yet, at times, we encounter an issue where the exported image fails to capture the entirety of our diagram. In this article, we will explore solutions to rectify this problem. Why my Diagram not Fully Export into Image File https://www.youtube.com/watch?v=iWZqowAZdEo Under the Setting Panel, we can find a "Page View" under diagram. We can also find "Paper Size" at the…continue reading →
How to Share Your Mind Map with Your Reader

How to Share Your Mind Map with Your Reader

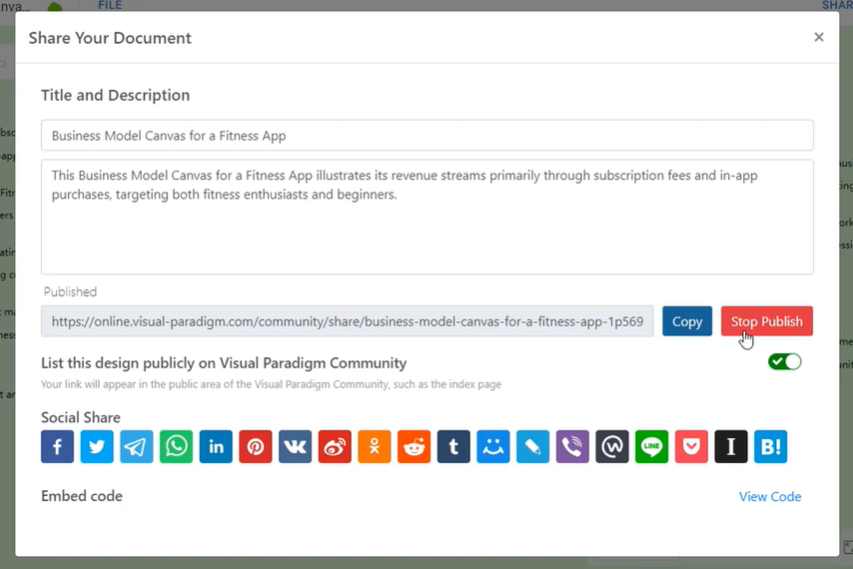
Unlocking the potential of your mind map extends beyond its creation, sharing it with your audience is key to maximizing its impact. In this guide, we will show you how to share your mind map with readers, ensuring clarity and accessibility with your ideas. How to Share Your Mind Map with Your Reader https://www.youtube.com/watch?v=sMTeqvqioYw In your workspace, open your diagram, select Share > Enable Publish. We can then share the diagram with your readers with the URL. In order to clearer express your idea, you can also choose to write a short introduction…continue reading →
How to Create Product Breakdown Structure Diagram using Visual Paradigm Smart Board

How to Create Product Breakdown Structure Diagram using Visual Paradigm Smart Board

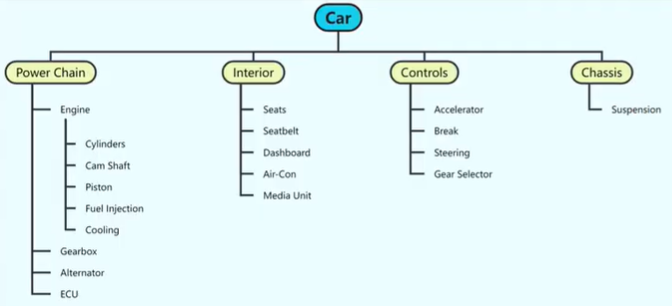
Effectively manage and visualize project tasks begins with understanding the intricacies of creating a Product Breakdown Structure (PBS) diagram. In this article, we explore the step-by-step process of harnessing the capabilities of Visual Paradigm's Smart Board feature to craft comprehensive PBS diagrams, empowering project managers and teams to streamline project planning and execution with precision and clarity. Understanding the Product Breakdown Structure (PBS) Diagram A Product Breakdown Structure (PBS) diagram serves as a foundational tool in project management, offering a hierarchical representation of a project's deliverables and components. It breaks down the project…continue reading →
How to Avoid Numbered Item Render Out of Element's Border

How to Avoid Numbered Item Render Out of Element’s Border

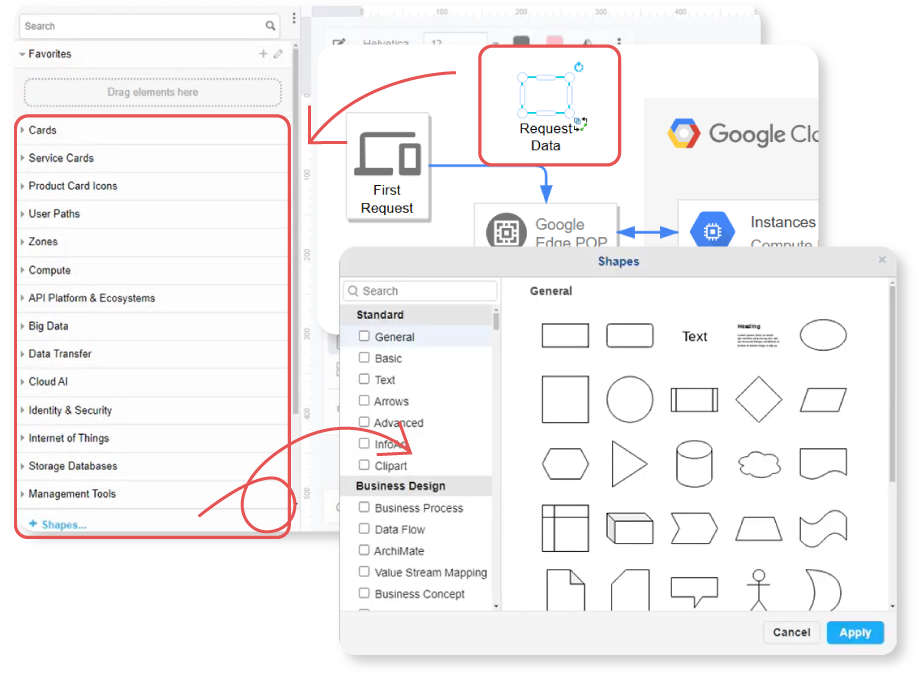
Numbered items play a ubiquitous role in our designs and work. As a default feature, they can sometimes present technical challenges, such as extending beyond the borders of our elements. In this article, we'll guide you through a few simple steps to rectify this issue in Visual Paradigm Online and ensure your numbered items stay neatly within their designated boundaries. Avoid Numbered Item Render Out of Element's Border https://youtu.be/IXltOAyRh24 When there are numbered item more than 10, the numbered item may overlap, or even outside the left border of the shape. We can…continue reading →
Beginner’s Guide to Activity Diagrams with Visual Paradigm Online

Beginner’s Guide to Activity Diagrams with Visual Paradigm Online

Introduction Activity diagrams are a vital tool in the world of software engineering and business process modeling. They help you visualize and understand the flow of activities within a system, process, or workflow. Visual Paradigm Online, a popular diagramming tool, offers a wide range of templates and features to help you create activity diagrams effectively. In this beginner's guide, we'll introduce you to activity diagrams and demonstrate how to use Visual Paradigm Online's extensive template library to learn and create your own diagrams. What is an Activity Diagram? An activity diagram is a…continue reading →
Beginner’s Guide to Deployment Diagrams with Visual Paradigm Online

Beginner’s Guide to Deployment Diagrams with Visual Paradigm Online

Introduction Deployment diagrams are an essential tool in software engineering that allow you to visualize and understand how software components and hardware elements interact within a system. They help you plan the deployment of your software application across different servers, devices, and environments. In this beginner's guide, we'll introduce you to deployment diagrams and show you how to create them using Visual Paradigm Online, a user-friendly diagramming tool with a wide range of templates and examples. What is a Deployment Diagram? A deployment diagram in software engineering is a type of UML (Unified…continue reading →
Beginner’s Guide to Package Diagrams with Visual Paradigm Online

Beginner’s Guide to Package Diagrams with Visual Paradigm Online

Introduction Package diagrams are an essential tool in software engineering, helping you organize and visualize the structure of your software system. They are part of the Unified Modeling Language (UML) and provide a high-level view of how different elements in your system are grouped into packages. In this beginner's guide, we will introduce you to package diagrams and demonstrate how to create them using Visual Paradigm Online, a powerful online diagramming tool with a large collection of templates. What is a Package Diagram? A package diagram is a UML diagram that represents the…continue reading →
Beginner’s Guide to Sequence Diagrams with Visual Paradigm Online

Beginner’s Guide to Sequence Diagrams with Visual Paradigm Online

Introduction Sequence diagrams are powerful tools in software development for visualizing the interactions between objects or components in a system over time. They help you understand how various parts of your system communicate and collaborate. In this beginner's guide, we'll introduce you to sequence diagrams and show you how to create them using Visual Paradigm Online, a user-friendly online diagramming tool with a collection of templates that make learning easy through practical examples. What is a Sequence Diagram? A sequence diagram is a type of UML (Unified Modeling Language) diagram that represents the…continue reading →