Home » Archives for April 2022 » Page 2
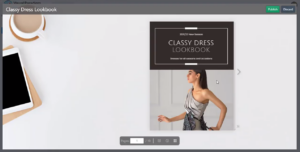
After finishing a booklet by the flipbook maker, do you want to make it looks more attractive? Adding animation to photo is a good way to do so. This article will show you how to do so. https://www.youtube.com/watch?v=XQaKM4hK3cA&width=854&height=480 How To Add Animation To Photo First of all, click the icon at the bottom of the editor to open the animation timeline. (Click one more time if you want to close it) After that, select the photo you want to edit, and choose the animation for it. When you place the mouse over the…
continue reading →
-
Posted on April 21, 2022
-
/Under Chart
We often record data for a particular use and sometimes we may need to present the data through graphics. In Visual Paradigm Online, you can create various charts freely like bar charts, column charts, pie charts, etc. This chart tool can help you to display any data by using text, symbols, and graphics. You can easily visualize the data that you have collected as graphics and they are presentable. This is a guide for teaching you to create a area chart with Visual Paradigm Online. You can watch the attached video or read…
continue reading →
-
Posted on April 21, 2022
-
/Under Chart
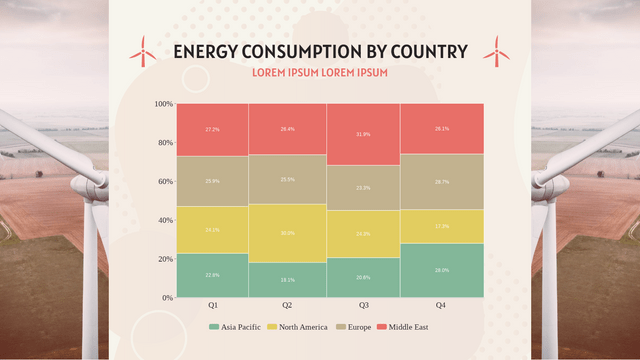
What Is A Marimekko Chart Marimekko chart is shown as a rectangular chart. Both directions represent 100% respectively. It is usually used to show the overview of data by dividing them into different segments and bars. When To Use Marimekko Chart As mentioned above, Marimekko is commonly used to showing the overview of data, especially for the market. The relationship between the company and customers are clearly shown by the Marimekko chart , so that we can find the opportunities in the chart by observing the segments and bars. On the other hand,…
continue reading →
-
Posted on April 21, 2022
-
/Under Chart
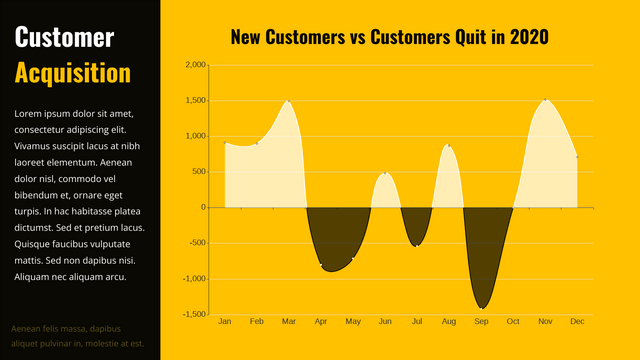
What Is A Difference Chart Unlike the other chart showing the data directly, difference chart show the difference between 2 groups of data. It is divided in to 2 side, the positive side and the negative side. By finding the difference the value of the 2 sides, we get the data to shown in this chart. When To Use Difference Chart As it shows the difference instead of the data, difference chart is not suitable for recording. It is more suitable when doing analysis as the data shown is already a result of…
continue reading →
-
Posted on April 20, 2022
-
/Under Diagram
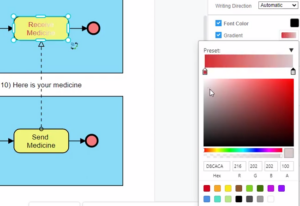
A color gradient is a color that changes from one color to another color. A color gradient can either be vertical, horizontally, or diagonally. Using a color gradient can help you get attention and direct eyesight, making your work more engaging. This video will show you how to apple gradient color to shape caption in the Visual Paradigm Online. https://www.youtube.com/watch?v=L_RZx8BMLbk&width=854&height=480 Apply gradient color to the element's caption In VP Online, you can apply gradient color to the element's caption. Select the element, then go to Settings Panel, text, and select Gradient. Click on…
continue reading →
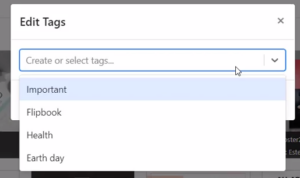
Create great design online easily and effortlessly with Visual Paradigm's intuitive online graphic design tool. After creating a design, your work will be saved on Workspace in the VP Online. When creating a lot of work, you may feel a mess, and not easy to find your old work in your workspace. Don't worry about that, because you can categorize your designs using tags in your workspace of VP Online. This video will show you how to categorize your designs using tags in VP Online. https://www.youtube.com/watch?v=VL-FUj2fTk4&width=854&height=480 Categorize your designs using tags In VP…
continue reading →
-
Posted on April 20, 2022
-
/Under Chart
We often record data for a particular use and sometimes we may need to present the data through graphics. In Visual Paradigm Online, you can create various charts freely like bar charts, column charts, pie charts, etc. This chart tool can help you to display any data by using text, symbols, and graphics. You can easily visualize the data that you have collected as graphics and they are presentable. This is a guide for teaching you to create a bar chart with Visual Paradigm Online. You can watch the attached video or read…
continue reading →
-
Posted on April 20, 2022
-
/Under Chart
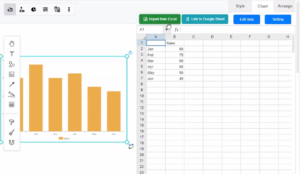
Create charts easily with Visual Paradigm Online. You can easily edit your data in an intuitive spreadsheet editor. Visual Paradigm Online makes it simple to enter your information and turn it into a stunning chart. In this video, you can see how to import chart data from Excel in VP Online. https://www.youtube.com/watch?v=Vow9KSwjQ9U&width=854&height=480 Import chart data from Excel When editing a chart, you can go to Format Panel, chart, and click "edit data" to open the spreadsheet editor. Click "Import from Excel", and select the excel that you want to import in the chart…
continue reading →
-
Posted on April 20, 2022
-
/Under Diagram
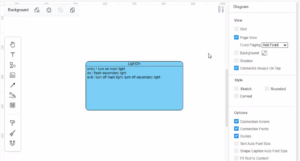
Create diagrams easily with Visual Paradigm Online. You can easily edit your own state machine diagram with our powerful diagram maker tool in the VP Online. In this video, you can see how to define entry, exit, and do activity for a state in VP Online. https://www.youtube.com/watch?v=QcljhjwY1vo&width=854&height=480 What is a state machine diagram? UML State Machine Diagrams (sometimes referred to as state diagrams, state machines, or statecharts) show the different states of an entity. State machine diagrams can also show how an entity responds to various events by changing from one state to…
continue reading →
Have you ever wondered how to convert a PDF into an eBook? Or how to read a PDF document as if you are reading a flipbook? These are the flipbook examples that show you how to turn PDF into a digital flipbook with an amazing reading experience. You can also make use of Fliplify's flipbook maker to convert and share your document privately with specific people, or publicly with everyone. This video will show you how to upload PDF files to become a flipbook in VP Online. https://www.youtube.com/watch?v=H0FLHR4ZQ6Q&width=854&height=480 Follow these 3 simple steps…
continue reading →


