




The Complete UML Reference: Structural and Behavioral Diagrams Explained with PlantUML and Visual Paradigm AI
Introduction
The Unified Modeling Language (UML) stands as the de facto industry standard for visualizing, specifying, constructing, and documenting software-intensive systems. Managed by the Object Management Group (OMG), UML provides a rich set of graphic notation techniques that enable developers, architects, and stakeholders to communicate complex system designs effectively.
With UML 2.2 introducing 14 distinct diagram types and specifications spanning over 700 pages, many practitioners find UML overwhelming and complex. However, as Grady Booch—one of UML’s primary creators—wisely noted: “For 80% of all software, only 20% of UML is needed.”
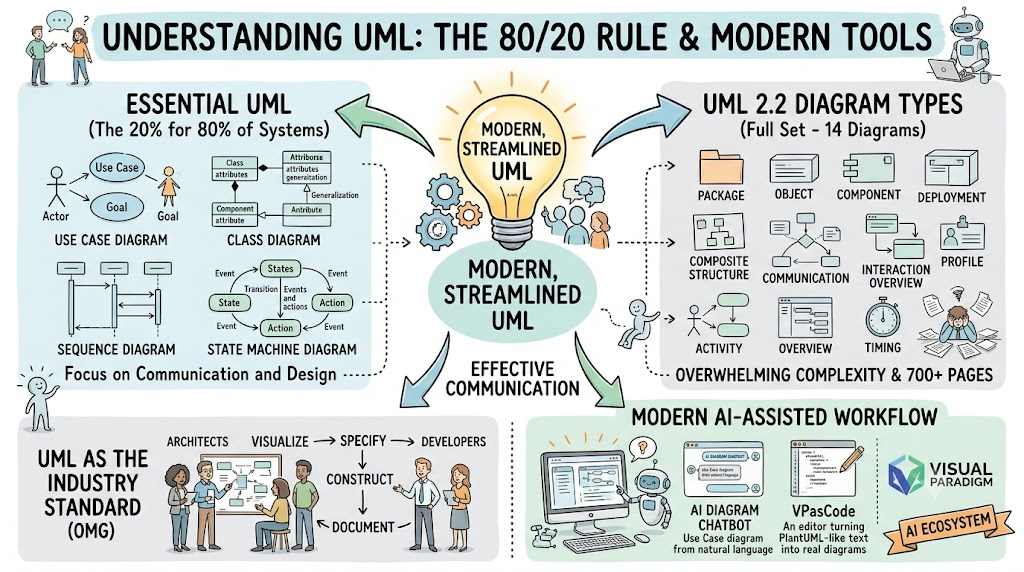
This comprehensive guide demystifies all 14 UML diagram types, categorizes them into structural and behavioral models, provides practical PlantUML examples, and demonstrates how Visual Paradigm’s AI ecosystem—including the AI Diagram Chatbot and VPasCode—can streamline your modeling workflow. Whether you’re a beginner seeking to understand essential diagrams or an experienced architect looking to leverage AI-assisted tooling, this guide serves as your complete reference.
Understanding the UML Diagram Landscape
The Two Main Categories
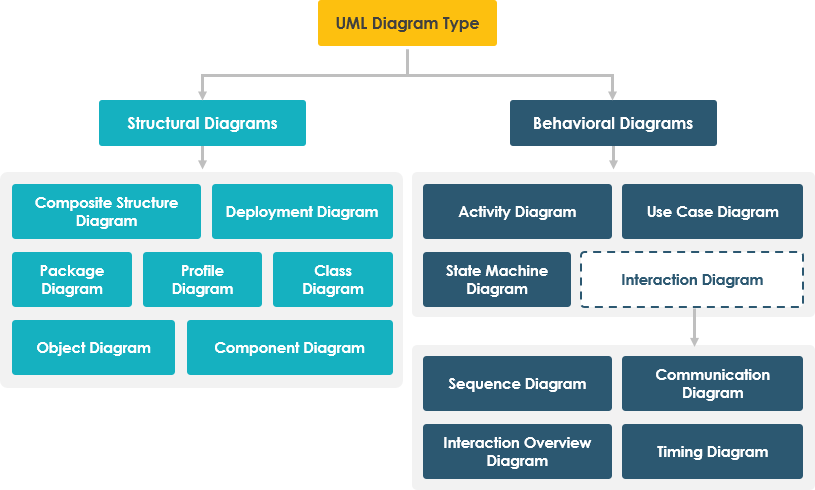
UML diagrams are hierarchically organized into two fundamental categories:
-
Structural Diagrams (7 types): Represent the static structure of a system—its classes, objects, components, and their relationships.
-
Behavioral Diagrams (7 types): Capture the dynamic behavior of a system, including interactions, state changes, and activities. Four of these specifically model different aspects of interactions.
Popularity Insights from Industry Surveys
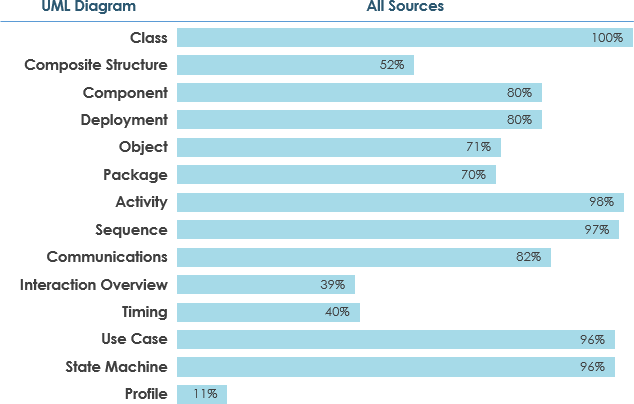
Understanding which diagrams are most widely adopted helps prioritize learning:
-
Widely Used (≥60% adoption): Class Diagrams, Use Case Diagrams, Sequence Diagrams, Activity Diagrams
-
Moderately Used: Component Diagrams, State Machine Diagrams, Deployment Diagrams
-
Scarcely Used (≤40% adoption): Communication Diagrams, Timing Diagrams, Interaction Overview Diagrams, Composite Structure Diagrams, Package Diagrams, Object Diagrams
This distribution suggests focusing initially on the most popular diagrams while maintaining awareness of specialized types for specific scenarios.
Part 1: Structural Diagrams
Structural diagrams depict the static architecture of a system—the “what” rather than the “how.”
1. Class Diagram
Purpose: Shows the system’s classes, their attributes, operations, and relationships (inheritance, association, aggregation, composition).
When to Use: During design phase to model domain entities, database schemas, or object-oriented structures.
Key Concepts:
-
Classes with attributes and methods
-
Visibility modifiers (+ public, – private, # protected)
-
Relationships: inheritance, association, aggregation, composition, dependency
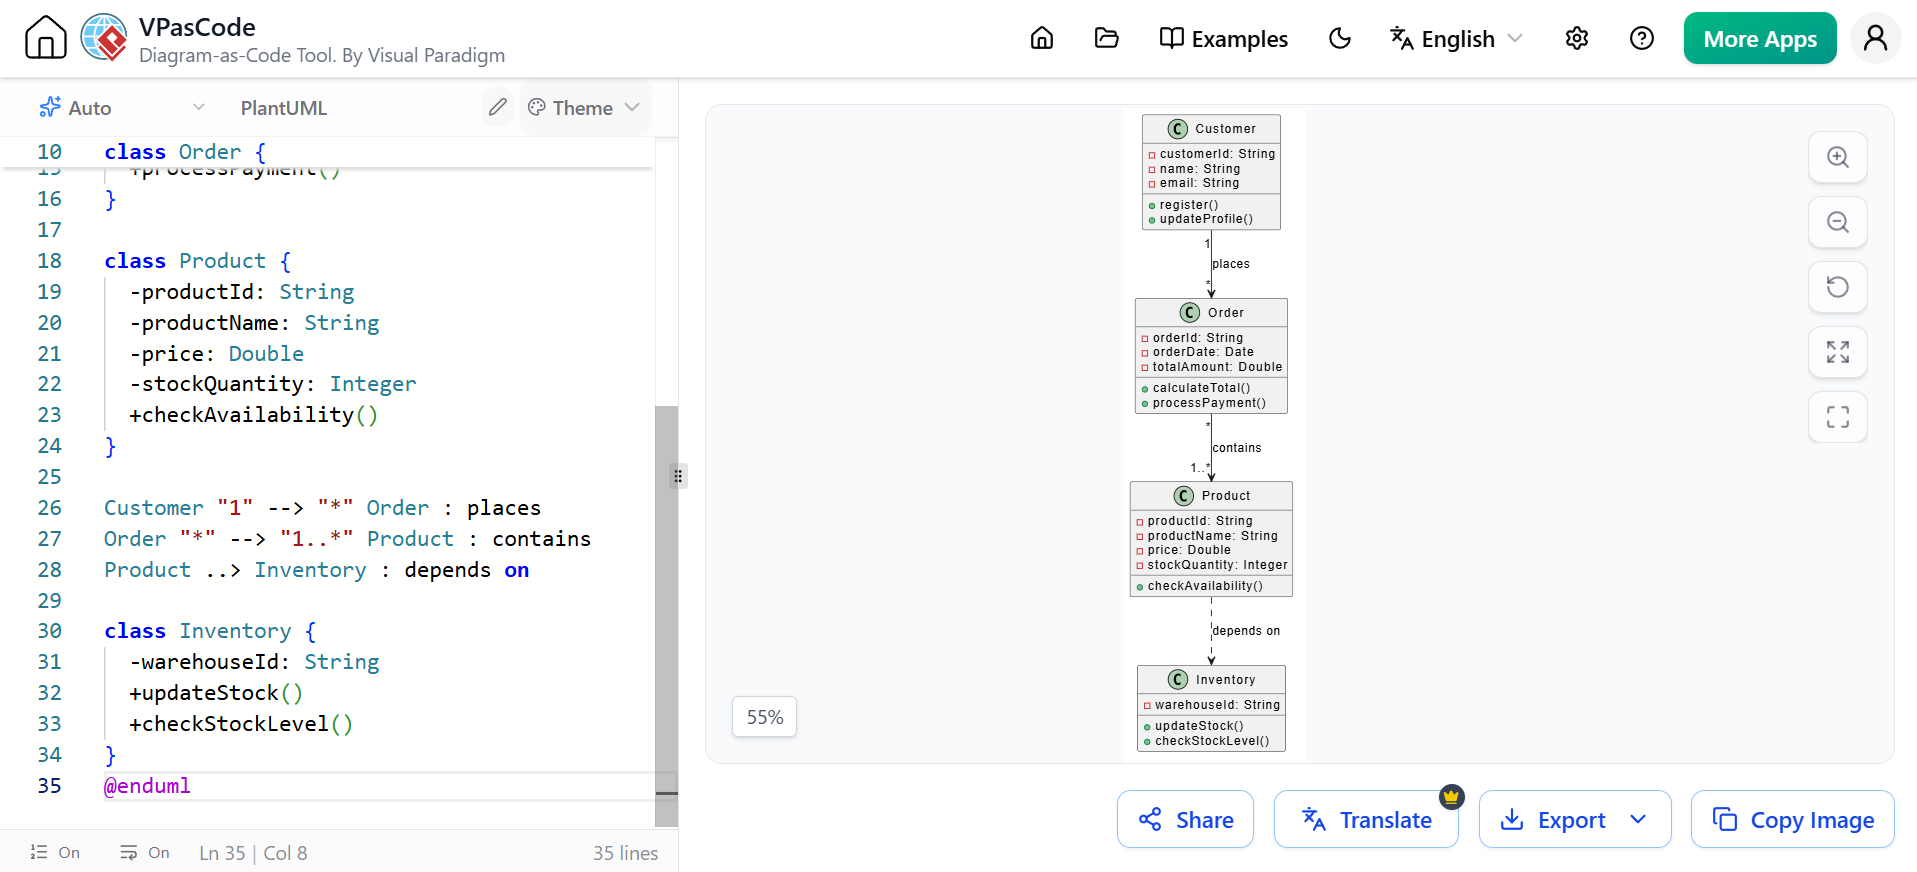
PlantUML Example:
@startuml
class Customer {
  -customerId: String
  -name: String
  -email: String
  +register()
  +updateProfile()
}

class Order {
  -orderId: String
  -orderDate: Date
  -totalAmount: Double
  +calculateTotal()
  +processPayment()
}

class Product {
  -productId: String
  -productName: String
  -price: Double
  -stockQuantity: Integer
  +checkAvailability()
}

Customer "1" --> "*" Order : places
Order "*" --> "1..*" Product : contains
Product ..> Inventory : depends on

class Inventory {
  -warehouseId: String
  +updateStock()
  +checkStockLevel()
}
@enduml
2. Object Diagram
Purpose: Shows instances of classes at a specific moment in time, representing a snapshot of the system.
When to Use: To illustrate specific scenarios, test cases, or runtime configurations.
Key Concepts:
-
Objects (instances) with actual values
-
Links between objects
-
Snapshot of system state
PlantUML Example:
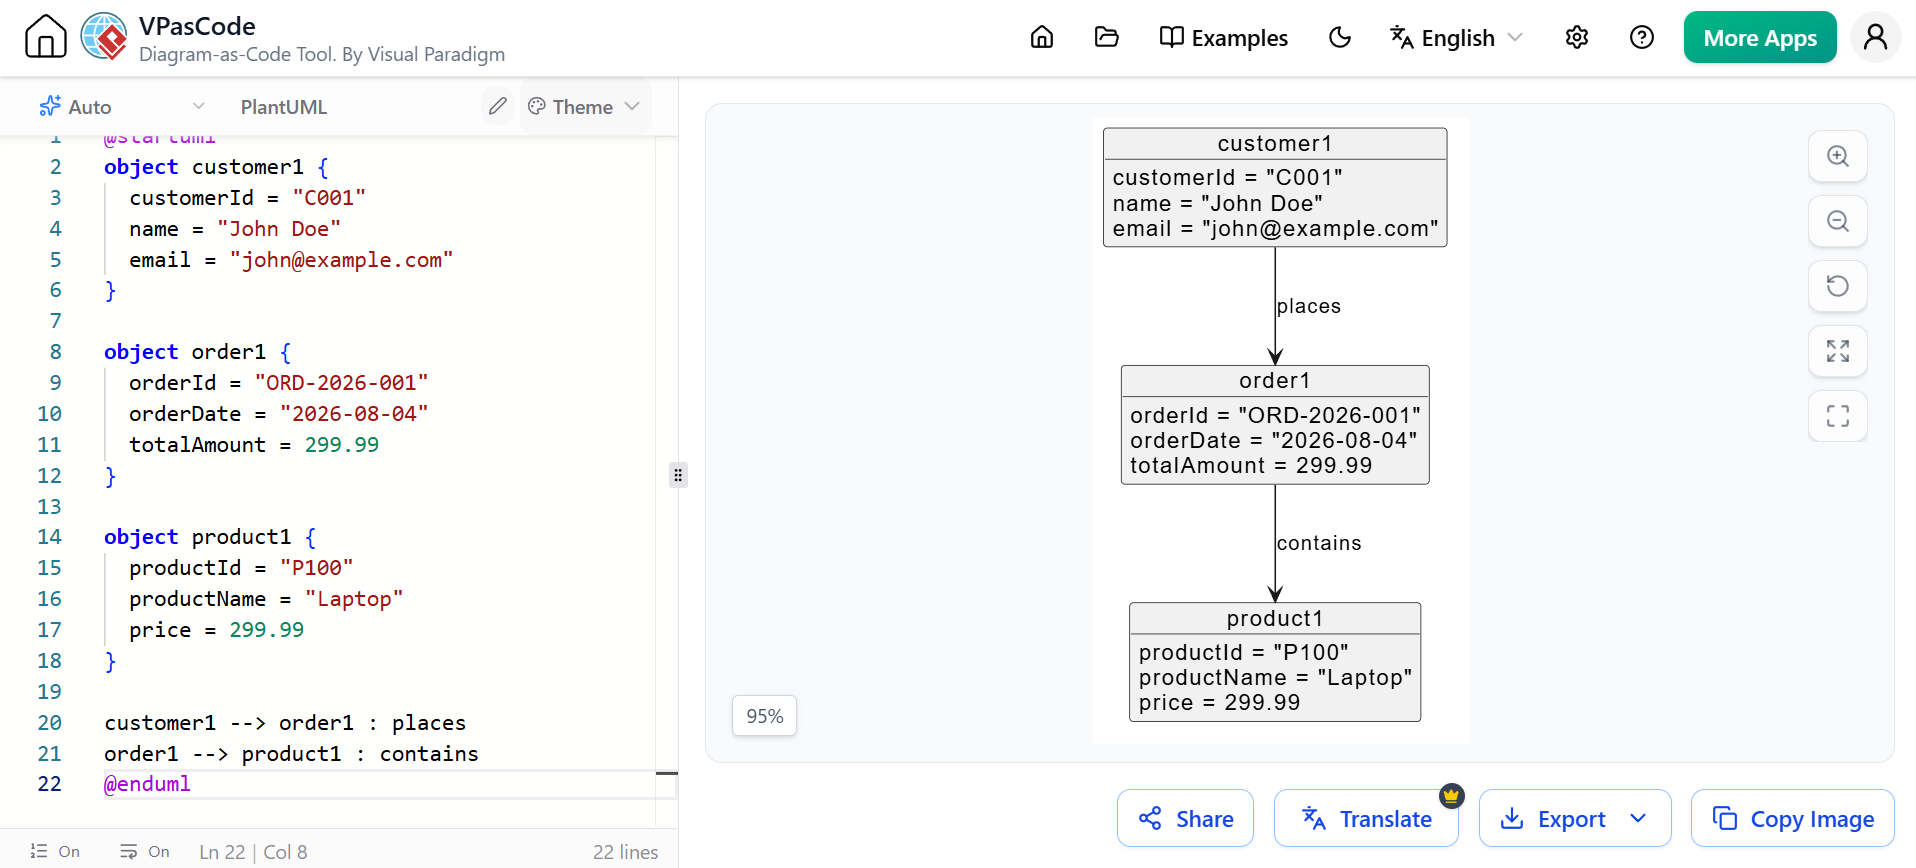
@startuml
object customer1 {
  customerId = "C001"
  name = "John Doe"
  email = "[email protected]"
}

object order1 {
  orderId = "ORD-2026-001"
  orderDate = "2026-08-04"
  totalAmount = 299.99
}

object product1 {
  productId = "P100"
  productName = "Laptop"
  price = 299.99
}

customer1 --> order1 : places
order1 --> product1 : contains
@enduml
3. Component Diagram
Purpose: Illustrates how larger pieces of a system (components) are organized and how they interact through interfaces.
When to Use: For high-level architectural views, module dependencies, or microservices architecture.
Key Concepts:
-
Components with provided/required interfaces
-
Dependencies between components
-
Ports and connectors
PlantUML Example:
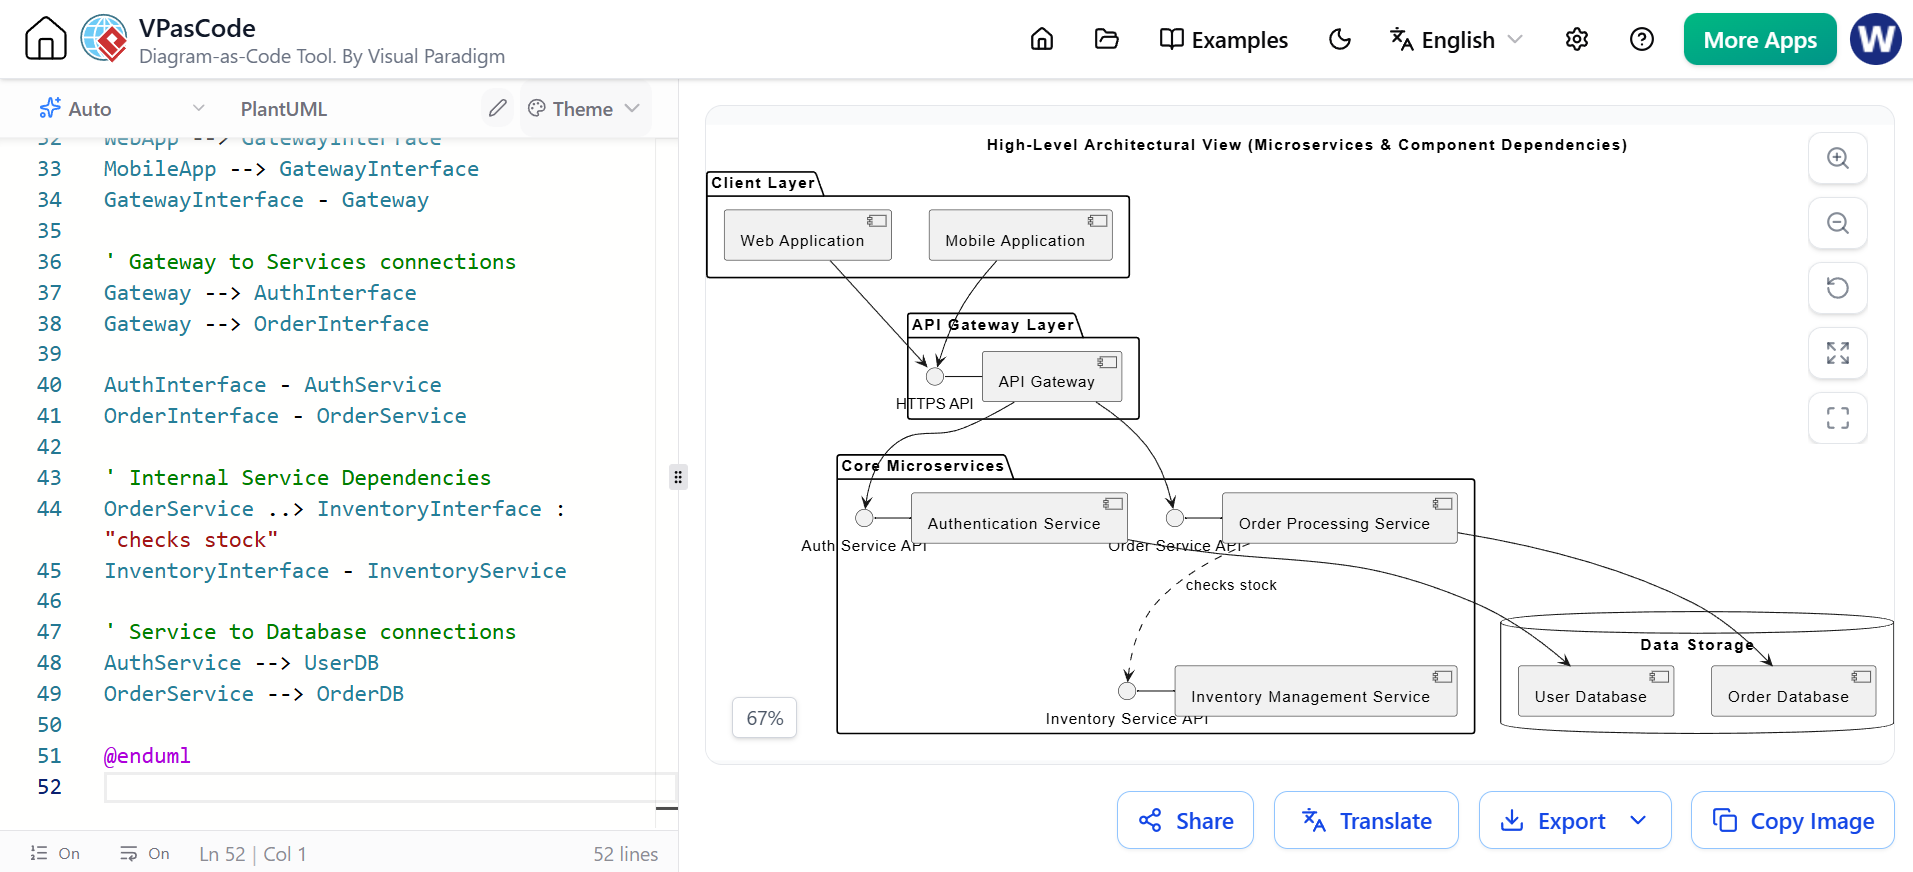
@startuml
skinparam componentStyle uml2

title High-Level Architectural View (Microservices & Component Dependencies)

package "Client Layer" {
    [Web Application] as WebApp
    [Mobile Application] as MobileApp
}

package "API Gateway Layer" {
    interface "HTTPS API" as GatewayInterface
    [API Gateway] as Gateway
}

package "Core Microservices" {
    interface "Auth Service API" as AuthInterface
    interface "Order Service API" as OrderInterface
    interface "Inventory Service API" as InventoryInterface

    [Authentication Service] as AuthService
    [Order Processing Service] as OrderService
    [Inventory Management Service] as InventoryService
}

database "Data Storage" {
    [User Database] as UserDB
    [Order Database] as OrderDB
}

' Client to Gateway connections
WebApp --> GatewayInterface
MobileApp --> GatewayInterface
GatewayInterface - Gateway

' Gateway to Services connections
Gateway --> AuthInterface
Gateway --> OrderInterface

AuthInterface - AuthService
OrderInterface - OrderService

' Internal Service Dependencies
OrderService ..> InventoryInterface : "checks stock"
InventoryInterface - InventoryService

' Service to Database connections
AuthService --> UserDB
OrderService --> OrderDB

@enduml
4. Deployment Diagram
Purpose: Shows the physical deployment of artifacts (software components) on nodes (hardware devices).
When to Use: For infrastructure planning, cloud deployment strategies, or distributed systems.
Key Concepts:
-
Nodes (physical or virtual machines)
-
Artifacts deployed on nodes
-
Communication paths between nodes
PlantUML Example:
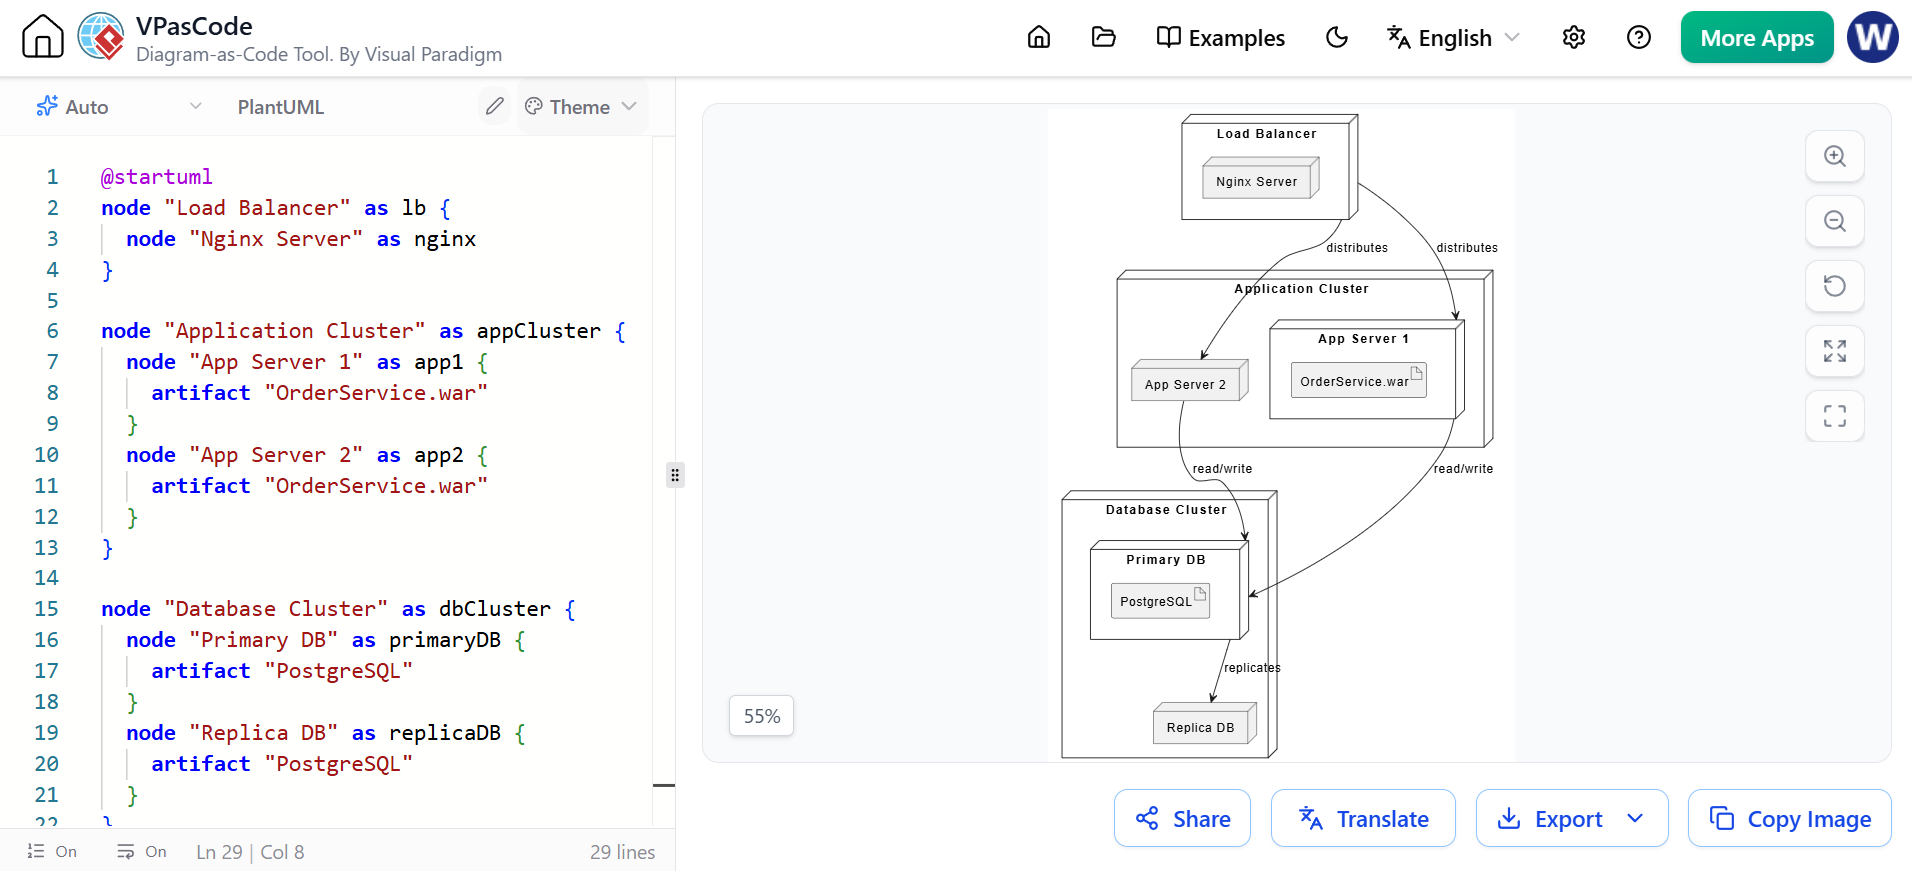
@startuml
node "Load Balancer" as lb {
  node "Nginx Server" as nginx
}

node "Application Cluster" as appCluster {
  node "App Server 1" as app1 {
    artifact "OrderService.war"
  }
  node "App Server 2" as app2 {
    artifact "OrderService.war"
  }
}

node "Database Cluster" as dbCluster {
  node "Primary DB" as primaryDB {
    artifact "PostgreSQL"
  }
  node "Replica DB" as replicaDB {
    artifact "PostgreSQL"
  }
}

lb --> app1 : distributes
lb --> app2 : distributes
app1 --> primaryDB : read/write
app2 --> primaryDB : read/write
primaryDB --> replicaDB : replicates
@enduml
5. Package Diagram
Purpose: Organizes elements into groups (packages) to show high-level structure and dependencies.
When to Use: For organizing large codebases, showing module boundaries, or managing namespaces.
Key Concepts:
-
Packages containing related elements
-
Package dependencies
-
Import/merge relationships
PlantUML Example:
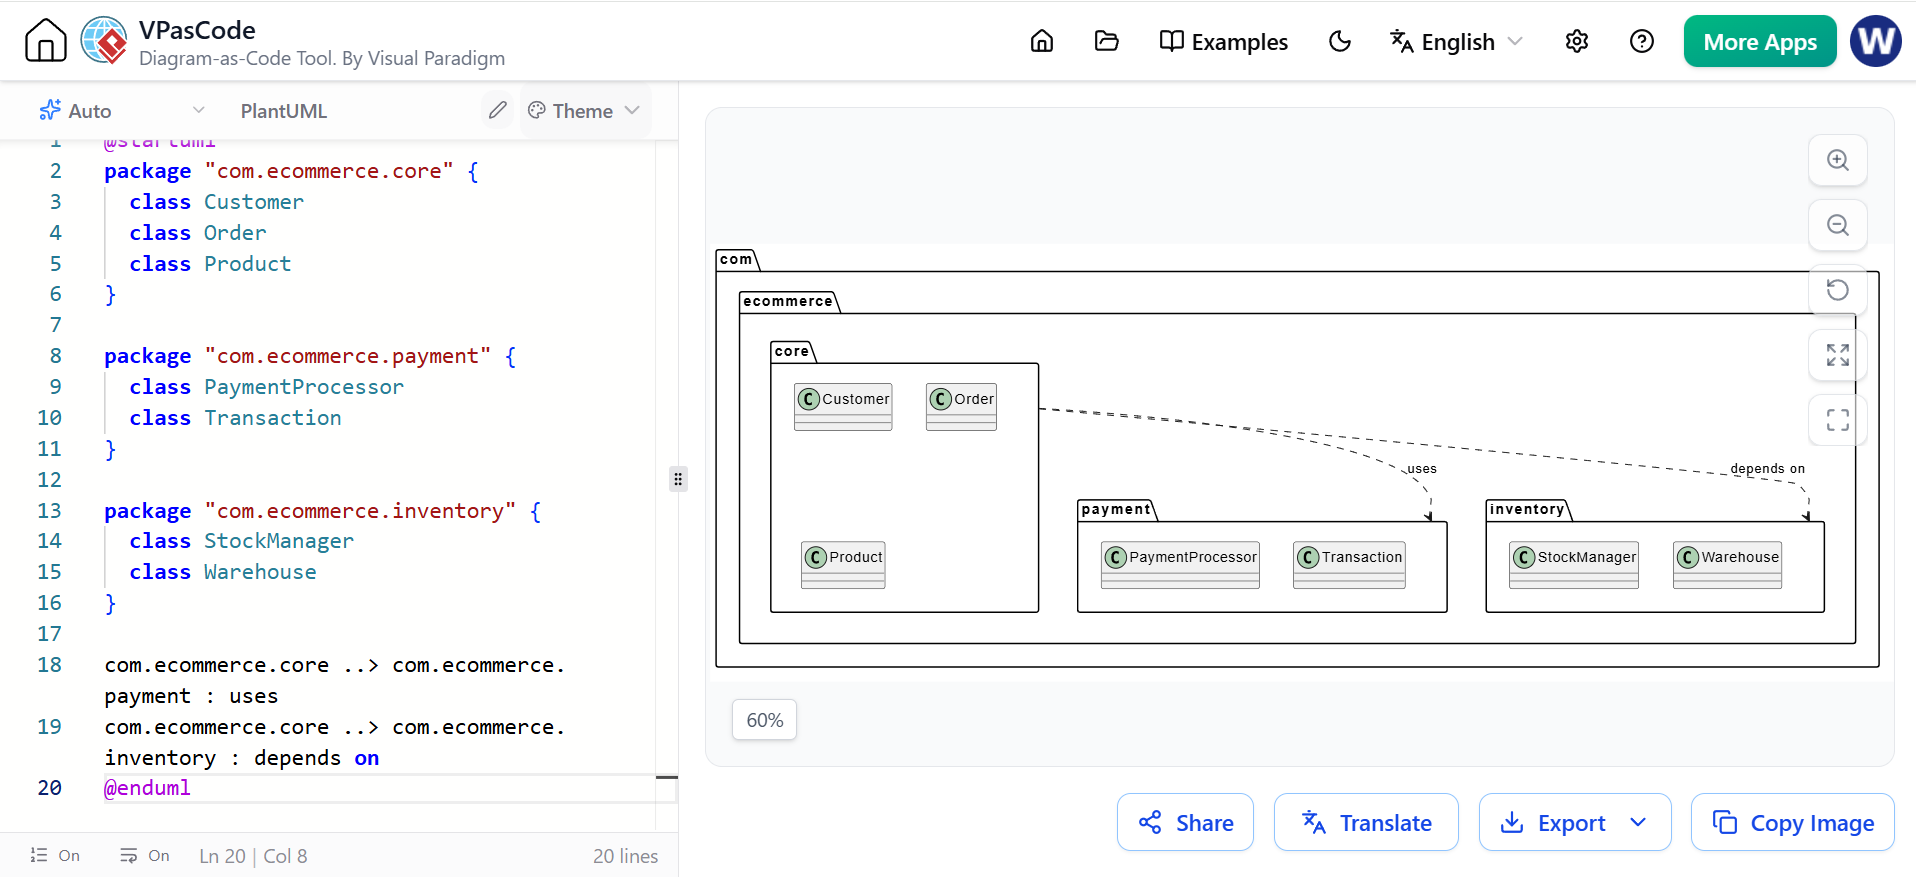
@startuml
package "com.ecommerce.core" {
  class Customer
  class Order
  class Product
}

package "com.ecommerce.payment" {
  class PaymentProcessor
  class Transaction
}

package "com.ecommerce.inventory" {
  class StockManager
  class Warehouse
}

com.ecommerce.core ..> com.ecommerce.payment : uses
com.ecommerce.core ..> com.ecommerce.inventory : depends on
@enduml
6. Composite Structure Diagram
Purpose: Shows the internal structure of a class or component, including parts, ports, and connectors.
When to Use: For detailed component design, especially in component-based or service-oriented architectures.
Key Concepts:
-
Parts (internal components)
-
Ports (interaction points)
-
Connectors (links between parts)
PlantUML Example:
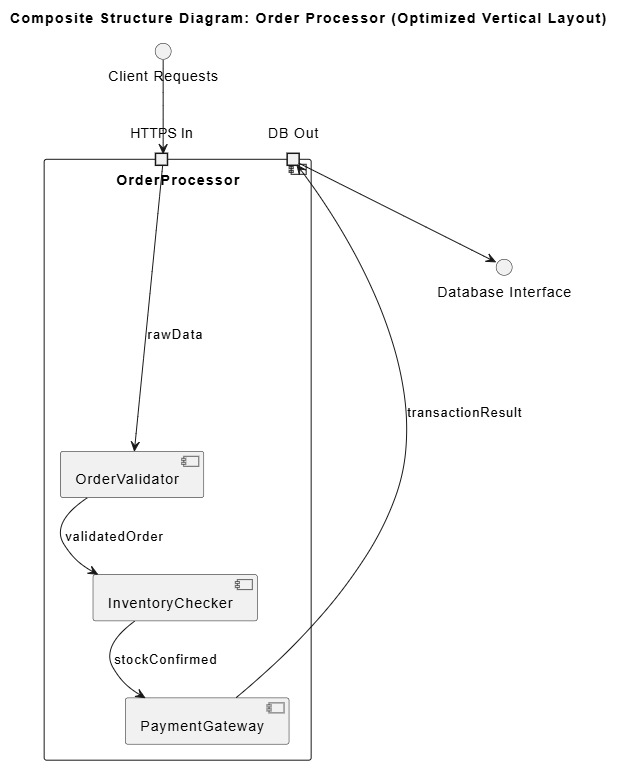
@startuml
title Composite Structure Diagram: Order Processor (Optimized Vertical Layout)

skinparam componentStyle uml2
top to bottom direction

' External client at the top
() "Client Requests" as Client

component "OrderProcessor" as OrderProcessor {

    ' Top Input Port
    port "HTTPS In" as PortIn

    ' Internal Parts stacked directly underneath each other
    component "OrderValidator" as Validator
    component "InventoryChecker" as InvCheck
    component "PaymentGateway" as PayGate

    ' Bottom Output Port
    port "DB Out" as PortOut

    ' Straight down sequential connections
    PortIn --> Validator : rawData
    Validator --> InvCheck : validatedOrder
    InvCheck --> PayGate : stockConfirmed
    PayGate --> PortOut : transactionResult
}

' External database at the bottom
() "Database Interface" as Database

' External top-to-bottom links
Client --> PortIn
PortOut --> Database

@enduml
7. Profile Diagram
Purpose: Extends UML with custom stereotypes, tagged values, and constraints for domain-specific modeling.
When to Use: When standard UML doesn’t capture domain-specific concepts; common in enterprise architecture frameworks.
Key Concepts:
-
Stereotypes (custom extensions)
-
Tagged values (metadata)
-
Constraints
Note: Profile diagrams are advanced and typically used in specialized domains like real-time systems or enterprise architecture.
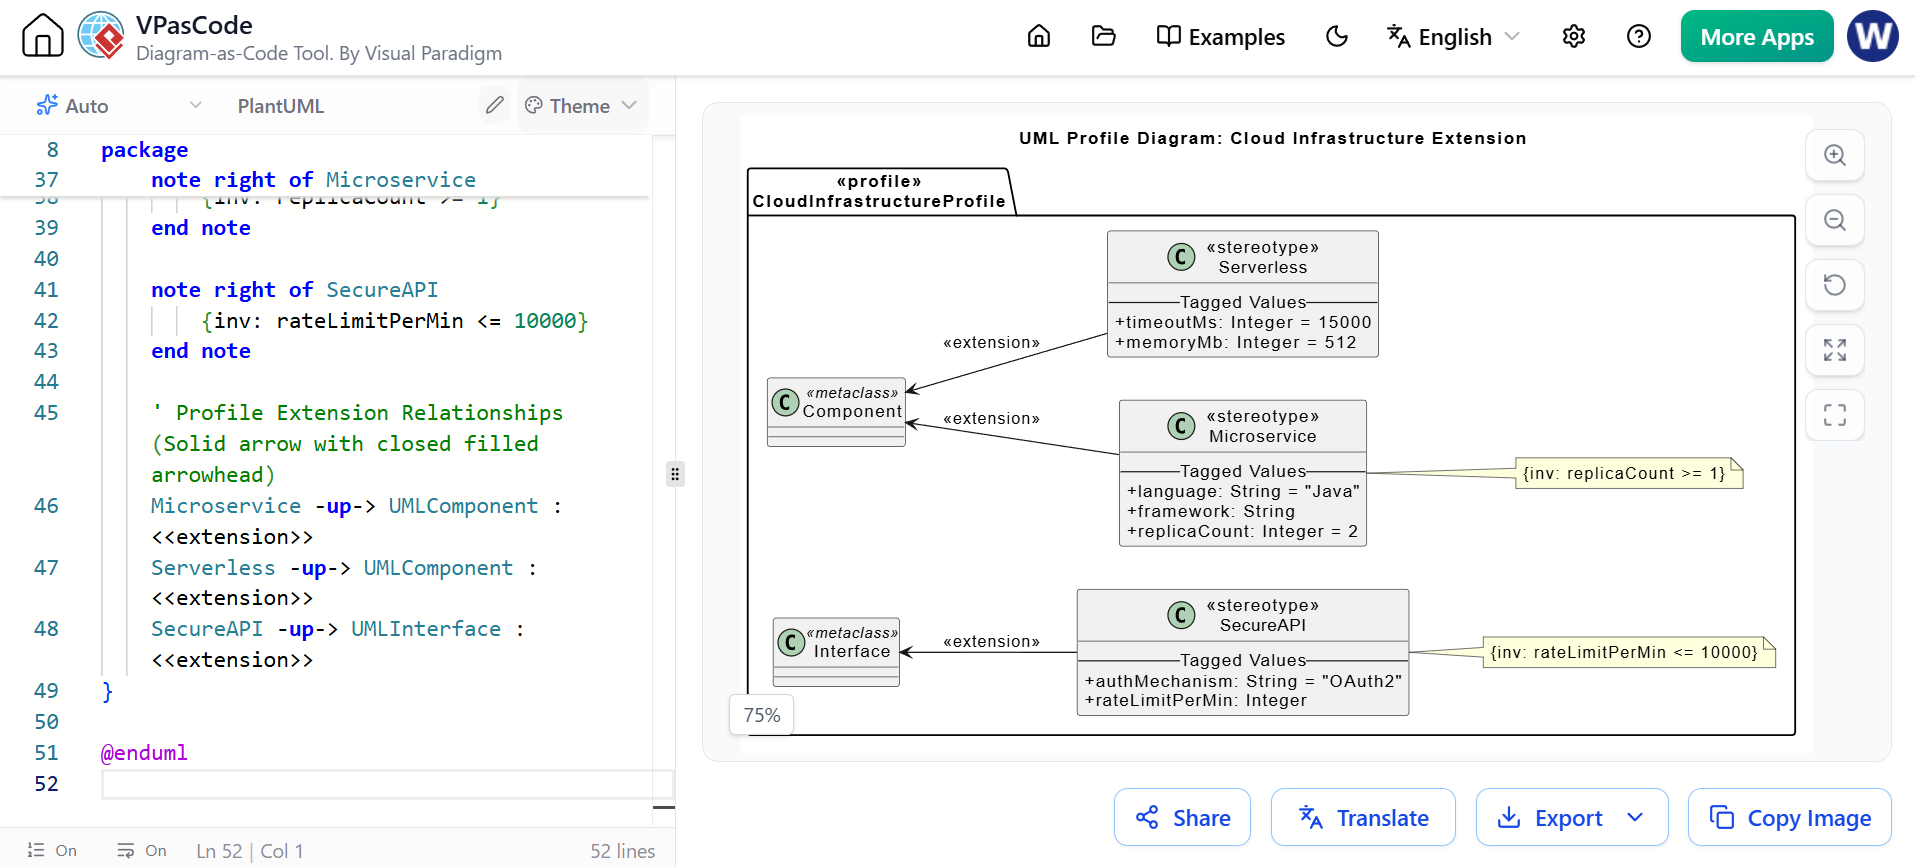
@startuml
title UML Profile Diagram: Cloud Infrastructure Extension

' Structural layout adjustments
left to right direction
skinparam classAttributeIconSize 0

package "<>\nCloudInfrastructureProfile" {

    ' Metaclass definitions (The standard UML elements being extended)
    class "Component" as UMLComponent <>
    class "Interface" as UMLInterface <>

    ' Stereotype: Microservice extending Component
    class "<>\nMicroservice" as Microservice {
        -- Tagged Values --
        + language: String = "Java"
        + framework: String
        + replicaCount: Integer = 2
    }

    ' Stereotype: Serverless extending Component
    class "<>\nServerless" as Serverless {
        -- Tagged Values --
        + timeoutMs: Integer = 15000
        + memoryMb: Integer = 512
    }

    ' Stereotype: SecureAPI extending Interface
    class "<>\nSecureAPI" as SecureAPI {
        -- Tagged Values --
        + authMechanism: String = "OAuth2"
        + rateLimitPerMin: Integer
    }

    ' Constraints using OCL notation notes
    note right of Microservice
        {inv: replicaCount >= 1}
    end note

    note right of SecureAPI
        {inv: rateLimitPerMin <= 10000} end note ' Profile Extension Relationships (Solid arrow with closed filled arrowhead) Microservice -up-> UMLComponent : <>
    Serverless -up-> UMLComponent : <>
    SecureAPI -up-> UMLInterface : <>
}

@enduml
Part 2: Behavioral Diagrams
Behavioral diagrams capture the dynamic aspects of a system—the “how” and “when.”
8. Use Case Diagram
Purpose: Captures functional requirements by showing actors and their interactions with the system through use cases.
When to Use: Early requirements gathering, stakeholder communication, scope definition.
Key Concepts:
-
Actors (users or external systems)
-
Use cases (functionalities)
-
Relationships: include, extend, generalization
PlantUML Example:
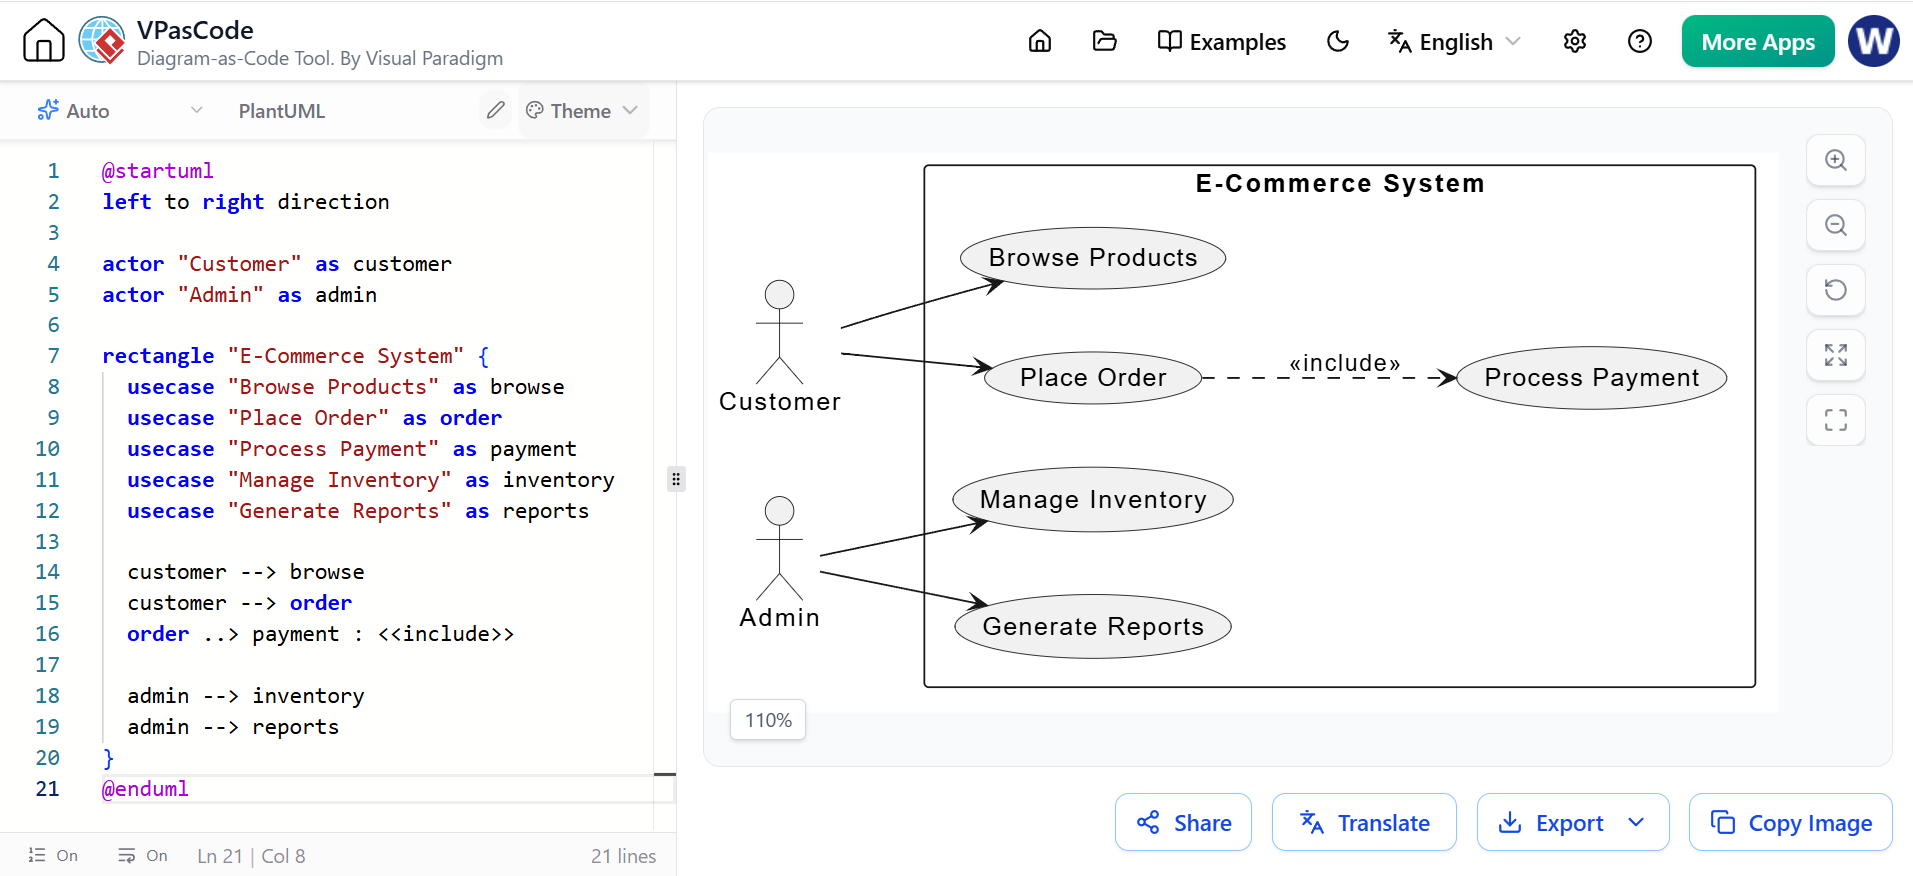
@startuml
left to right direction

actor "Customer" as customer
actor "Admin" as admin

rectangle "E-Commerce System" {
  usecase "Browse Products" as browse
  usecase "Place Order" as order
  usecase "Process Payment" as payment
  usecase "Manage Inventory" as inventory
  usecase "Generate Reports" as reports

  customer --> browse
  customer --> order
  order ..> payment : <<include>>

  admin --> inventory
  admin --> reports
}
@enduml
9. Activity Diagram
Purpose: Models workflows, business processes, or algorithmic logic using activity nodes and control flows.
When to Use: Business process modeling, workflow automation, complex algorithm visualization.
Key Concepts:
-
Activities (actions)
-
Decision nodes (diamonds)
-
Fork/join nodes (parallel processing)
-
Swimlanes (responsibility partitioning)
PlantUML Example:
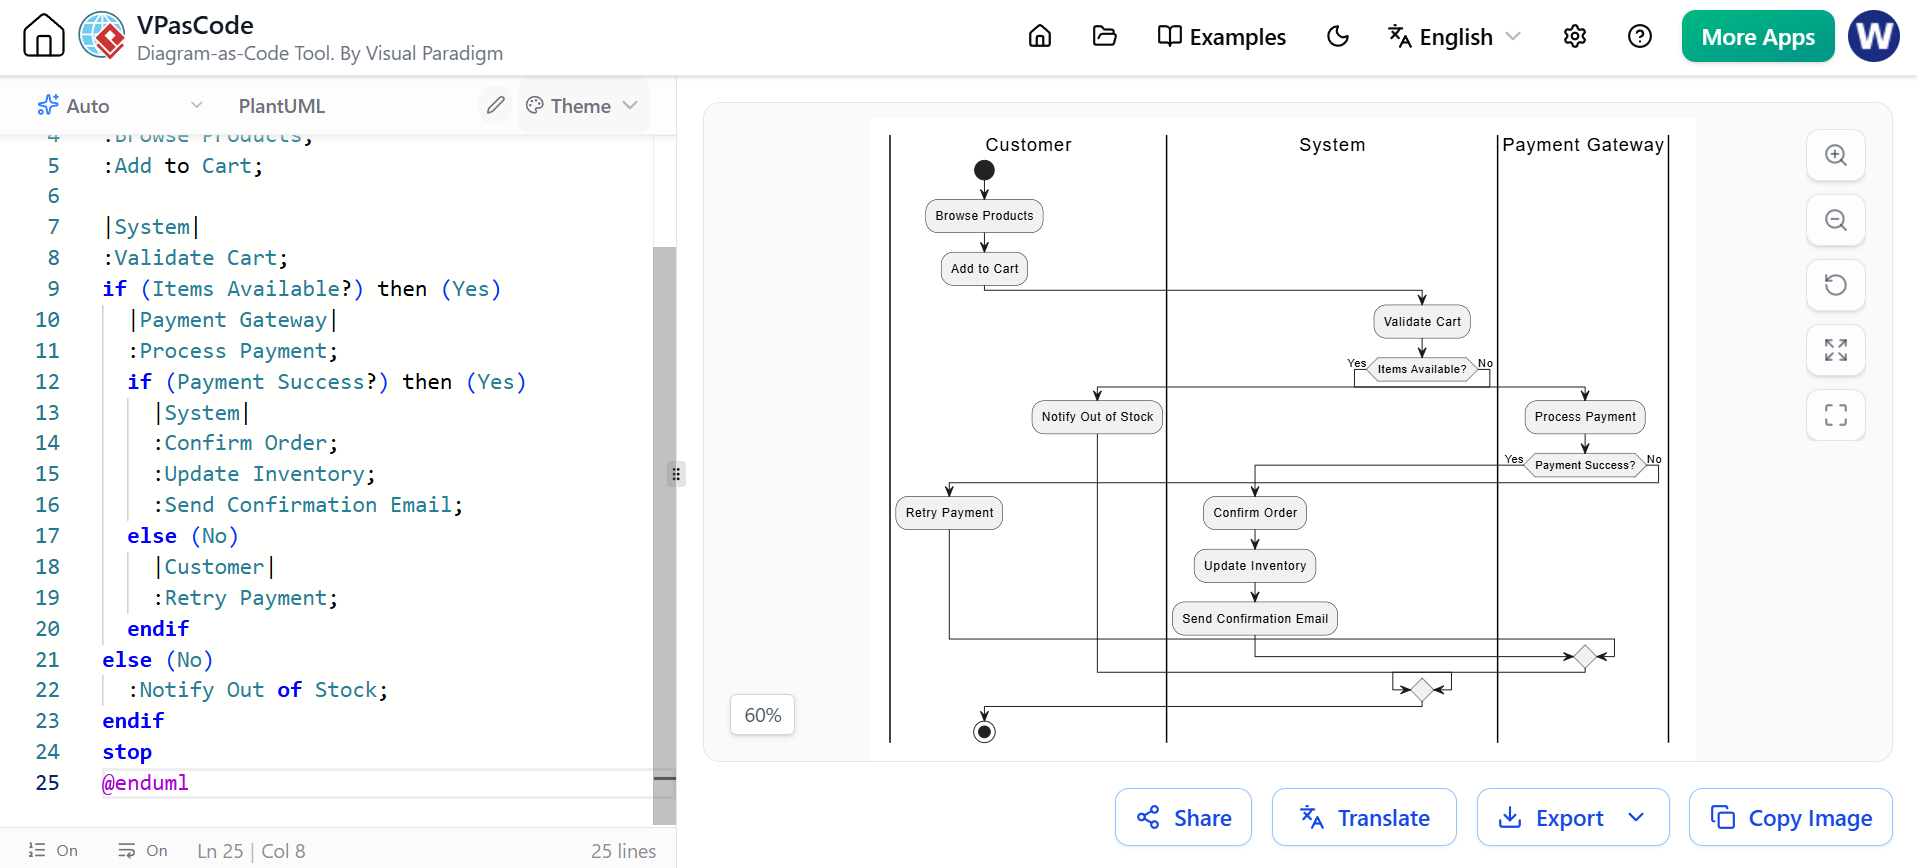
@startuml
|Customer|
start
:Browse Products;
:Add to Cart;

|System|
:Validate Cart;
if (Items Available?) then (Yes)
  |Payment Gateway|
  :Process Payment;
  if (Payment Success?) then (Yes)
    |System|
    :Confirm Order;
    :Update Inventory;
    :Send Confirmation Email;
  else (No)
    |Customer|
    :Retry Payment;
  endif
else (No)
  :Notify Out of Stock;
endif
stop
@enduml
10. State Machine Diagram
Purpose: Shows the states an object can be in and the transitions between states triggered by events.
When to Use: Modeling objects with complex lifecycle (orders, documents, workflows), protocol specifications.
Key Concepts:
-
States
-
Transitions (with triggers/guards/actions)
-
Initial and final states
-
Composite states
PlantUML Example:
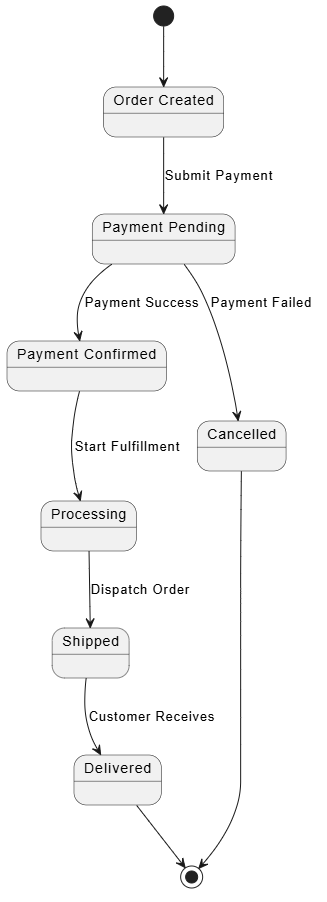
@startuml
state "Order Created" as created
state "Payment Pending" as pending
state "Payment Confirmed" as confirmed
state "Processing" as processing
state "Shipped" as shipped
state "Delivered" as delivered
state "Cancelled" as cancelled

[*] --> created
created --> pending : Submit Payment
pending --> confirmed : Payment Success
pending --> cancelled : Payment Failed
confirmed --> processing : Start Fulfillment
processing --> shipped : Dispatch Order
shipped --> delivered : Customer Receives
delivered --> [*]
cancelled --> [*]
@enduml
11. Sequence Diagram
Purpose: Shows object interactions arranged in time sequence, emphasizing the order of messages.
When to Use: Detailed interaction design, API documentation, debugging complex flows.
Key Concepts:
-
Lifelines (participants)
-
Messages (synchronous/asynchronous)
-
Activation bars
-
Fragments (loops, conditions, alternatives)
PlantUML Example:
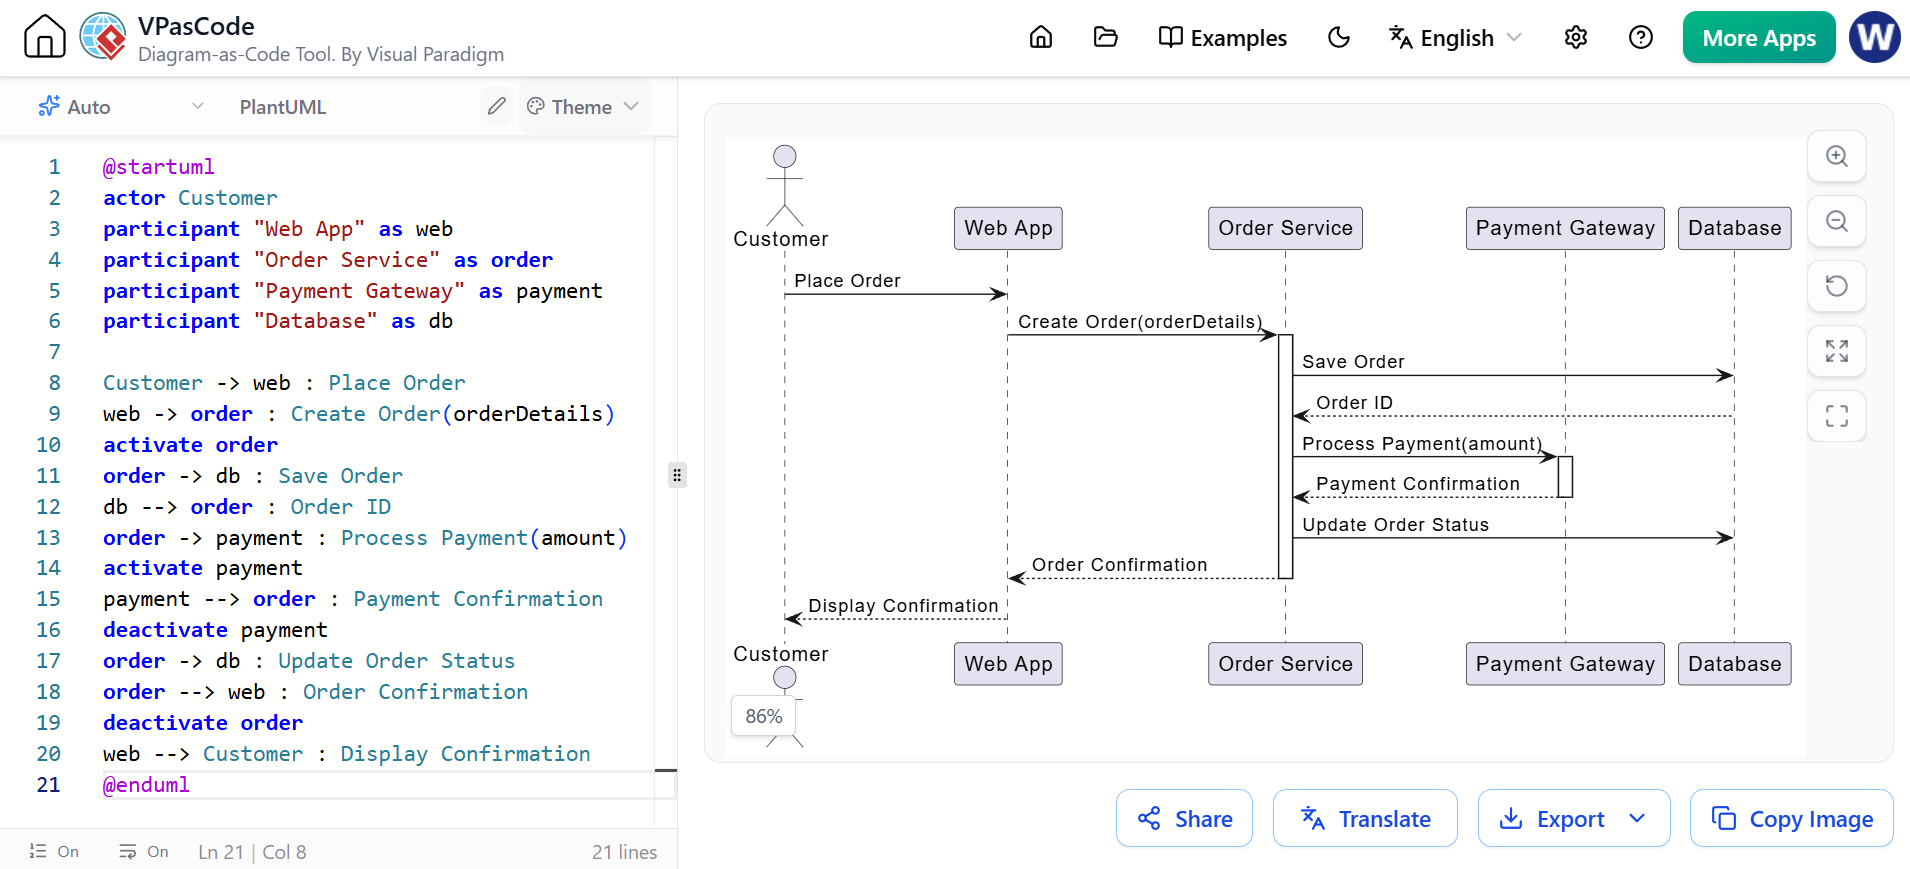
@startuml
actor Customer
participant "Web App" as web
participant "Order Service" as order
participant "Payment Gateway" as payment
participant "Database" as db

Customer -> web : Place Order
web -> order : Create Order(orderDetails)
activate order
order -> db : Save Order
db --> order : Order ID
order -> payment : Process Payment(amount)
activate payment
payment --> order : Payment Confirmation
deactivate payment
order -> db : Update Order Status
order --> web : Order Confirmation
deactivate order
web --> Customer : Display Confirmation
@enduml
12. Communication Diagram (formerly Collaboration Diagram)
Purpose: Emphasizes the structural organization of objects that send and receive messages, showing links between objects.
When to Use: When object relationships are more important than message timing; alternative view to sequence diagrams.
Key Concepts:
-
Objects with links
-
Numbered messages showing sequence
-
Focus on connectivity
PlantUML Example:
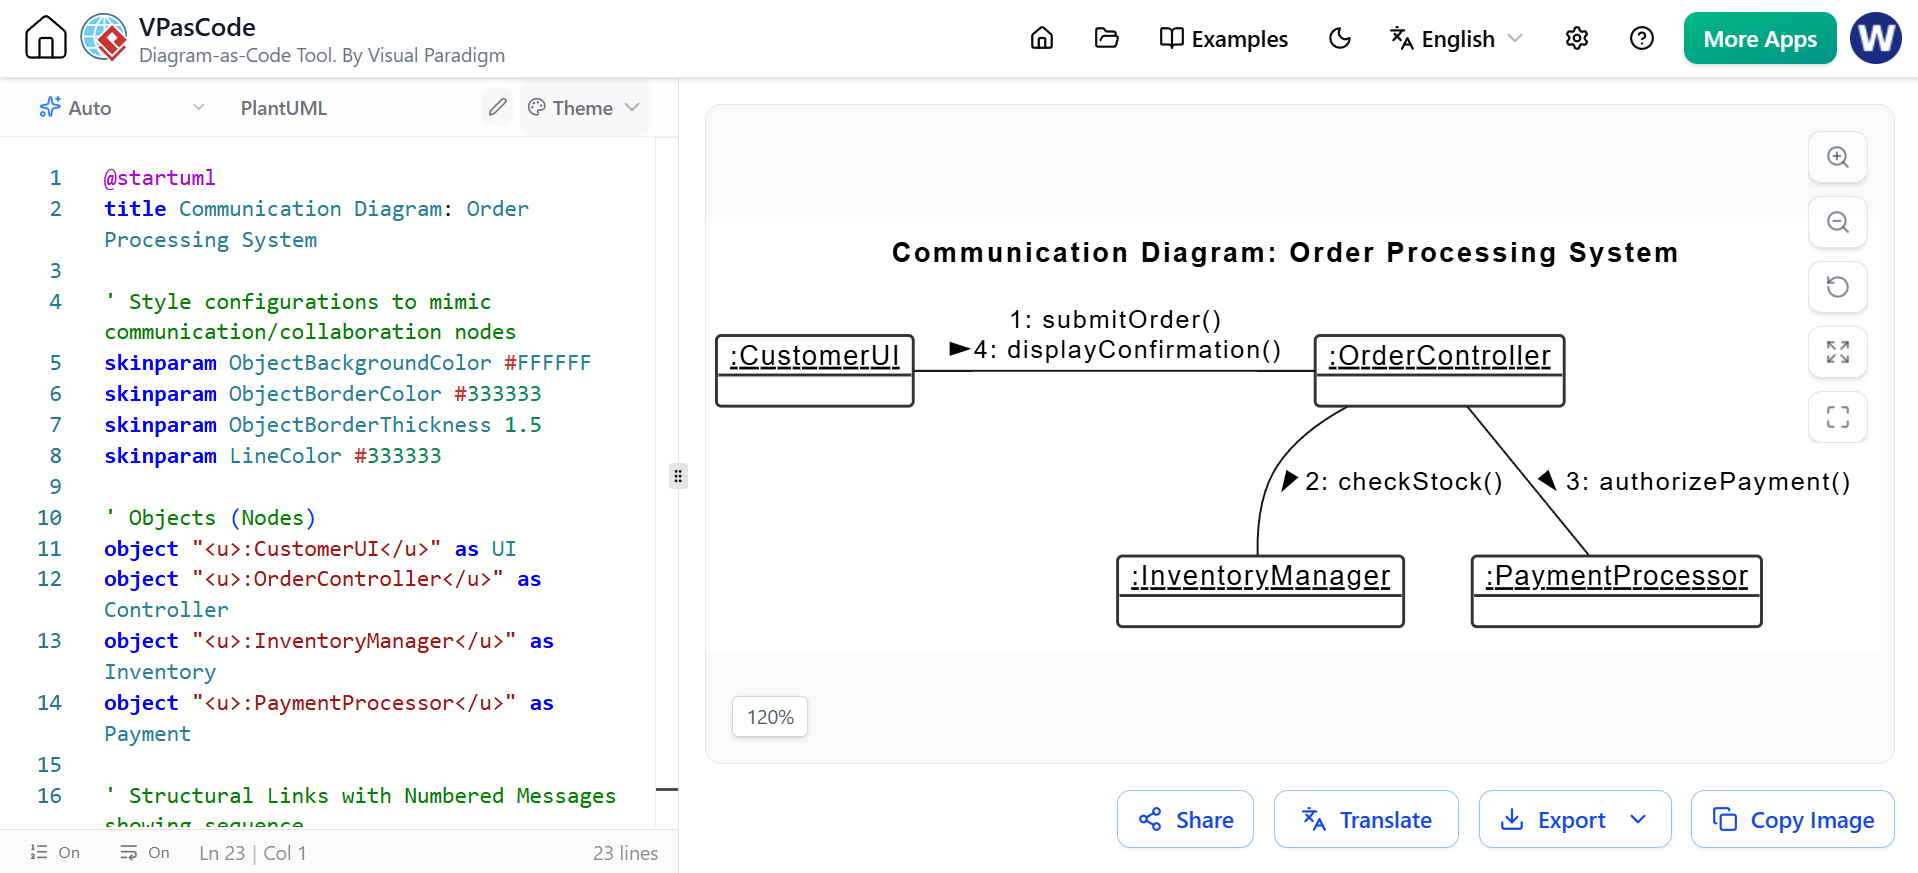
@startuml
object ":Customer" as customer
object ":OrderService" as order
object ":PaymentGateway" as payment
object ":Database" as db

customer -> order : 1: placeOrder()
order -> db : 2: saveOrder()
order -> payment : 3: processPayment()
payment --> order : 4: confirmPayment()
order -> db : 5: updateStatus()
order --> customer : 6: returnConfirmation()
@enduml
13. Timing Diagram
Purpose: Shows interactions with emphasis on timing constraints and deadlines.
When to Use: Real-time systems, performance-critical applications, embedded systems.
Key Concepts:
-
Lifelines with time axis
-
State changes over time
-
Timing constraints and deadlines
PlantUML Example:
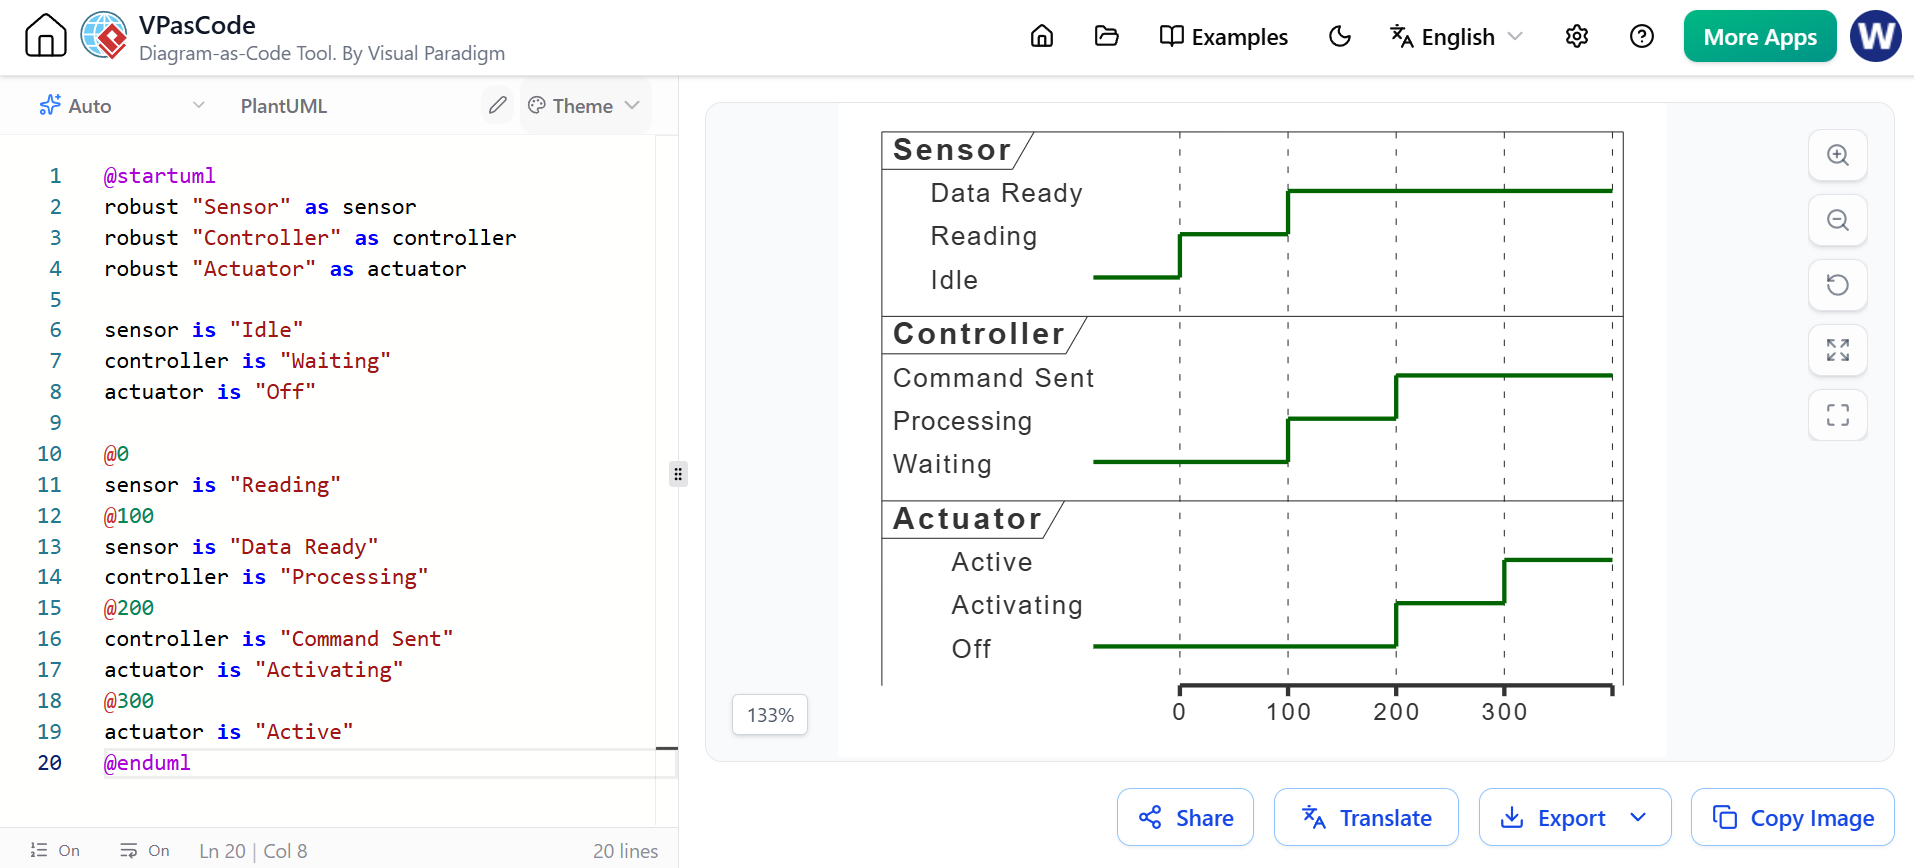
@startuml
robust "Sensor" as sensor
robust "Controller" as controller
robust "Actuator" as actuator

sensor is "Idle"
controller is "Waiting"
actuator is "Off"

@0
sensor is "Reading"
@100
sensor is "Data Ready"
controller is "Processing"
@200
controller is "Command Sent"
actuator is "Activating"
@300
actuator is "Active"
@enduml
14. Interaction Overview Diagram
Purpose: Provides a high-level overview of interactions by combining activity diagram notation with interaction fragments.
When to Use: Complex systems with multiple interacting subsystems; bridging between activity and sequence diagrams.
Key Concepts:
-
Activity-like flow
-
Interaction references (pointing to sequence diagrams)
-
Control flow between interactions
PlantUML Example:
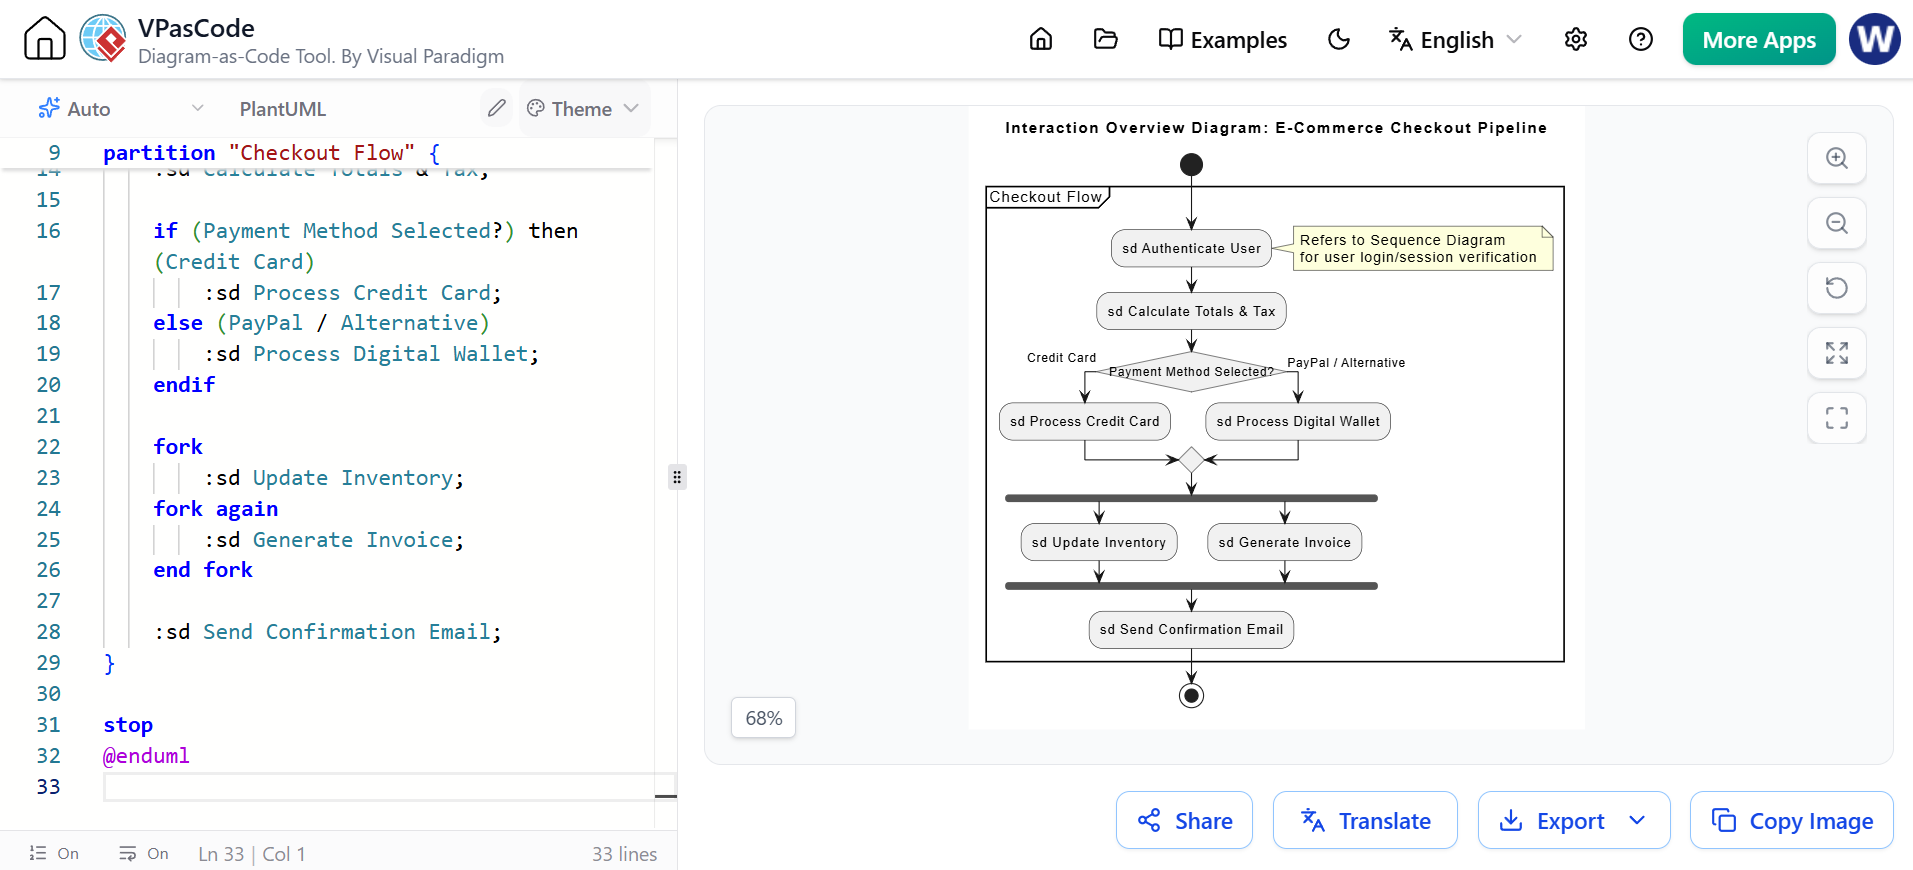
@startuml
title Interaction Overview Diagram: E-Commerce Checkout Pipeline

skinparam conditionStyle InsideDiamond
skinparam activityShape roundBox

start

partition "Checkout Flow" {

    :sd Authenticate User;
    note right: Refers to Sequence Diagram\nfor user login/session verification

    :sd Calculate Totals & Tax;

    if (Payment Method Selected?) then (Credit Card)
        :sd Process Credit Card;
    else (PayPal / Alternative)
        :sd Process Digital Wallet;
    endif

    fork
        :sd Update Inventory;
    fork again
        :sd Generate Invoice;
    end fork

    :sd Send Confirmation Email;
}

stop
@enduml
Strategic Learning Approach: The 80/20 Rule
Based on industry surveys and Grady Booch’s insight, here’s a recommended learning path:
Phase 1: Essential Diagrams (Cover 80% of Use Cases)
-
Class Diagram – Foundation of object-oriented design
-
Use Case Diagram – Requirements and scope
-
Sequence Diagram – Detailed interactions
-
Activity Diagram – Workflows and processes
Phase 2: Important Extensions
-
Component Diagram – Architecture and modules
-
State Machine Diagram – Object lifecycles
-
Deployment Diagram – Infrastructure
Phase 3: Specialized Diagrams (As Needed)
8-14. Object, Package, Communication, Timing, Interaction Overview, Composite Structure, Profile Diagrams
Leveraging AI-Powered Tooling: Visual Paradigm Ecosystem
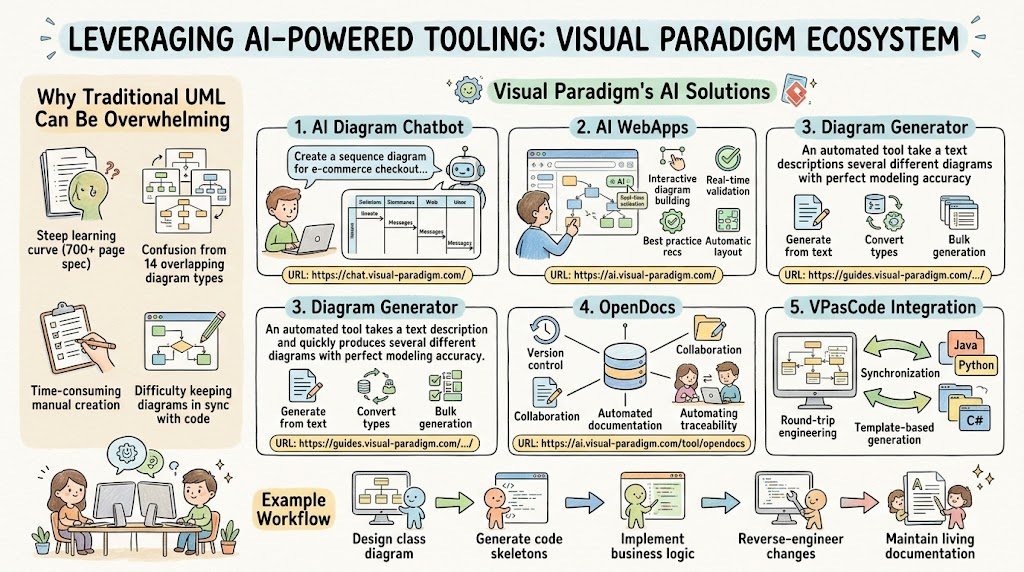
Why Traditional UML Can Be Overwhelming
-
700+ page specification creates steep learning curve
-
14 diagram types with overlapping purposes cause confusion
-
Manual diagram creation is time-consuming and error-prone
-
Keeping diagrams synchronized with code is challenging
Visual Paradigm’s AI Solutions
1. AI Diagram Chatbot
Describe your system in natural language, and the AI instantly generates the appropriate UML diagram.
Example Prompt:
“Create a sequence diagram for an e-commerce checkout process where a customer places an order, the system validates inventory, processes payment through a gateway, and sends confirmation.”
The chatbot intelligently selects the diagram type and generates accurate notation.
2. AI WebApps
Step-by-step AI-guided workflows help you create, refine, and evolve complex diagrams through an intuitive web interface. Features include:
-
Interactive diagram building with AI suggestions
-
Real-time validation and best practice recommendations
-
Automatic layout optimization
3. Diagram Generator
High-speed automated diagramming tools maintain 100% modeling accuracy while reducing manual effort. Benefits:
-
Generate diagrams from text descriptions
-
Convert between diagram types
-
Bulk diagram generation for large systems
4. OpenDocs
A central knowledge hub managing AI-generated diagrams and technical documentation in one integrated environment:
-
Version control for diagrams
-
Collaborative editing
-
Documentation generation from diagrams
-
Traceability between requirements and design
5. VPasCode Integration
Visual Paradigm’s code integration capabilities enable:
-
Round-trip engineering: Generate code from diagrams and vice versa
-
Synchronization: Keep diagrams and code aligned automatically
-
Template-based generation: Custom code templates for your tech stack
Example Workflow:
-
Design class diagram in Visual Paradigm
-
Generate Java/C#/Python code skeletons
-
Implement business logic
-
Reverse-engineer changes back to diagrams
-
Maintain living documentation
Best Practices for Effective UML Modeling
1. Start Simple
Begin with the most essential diagrams (Class, Use Case, Sequence, Activity). Add complexity only when needed.
2. Maintain Consistency
-
Use consistent naming conventions
-
Apply uniform styling across diagrams
-
Keep abstraction levels appropriate for the audience
3. Focus on Communication
Diagrams are communication tools, not art projects. Prioritize clarity over completeness.
4. Leverage AI Assistance
Use Visual Paradigm’s AI tools to:
-
Accelerate initial diagram creation
-
Validate diagram correctness
-
Suggest improvements based on best practices
-
Generate documentation automatically
5. Keep Diagrams Alive
-
Integrate with version control
-
Update diagrams as code evolves
-
Use round-trip engineering to maintain synchronization
6. Right-Size Your Models
Not every system needs all 14 diagram types. Choose diagrams based on:
-
Project complexity
-
Stakeholder needs
-
Development methodology
-
Regulatory requirements
Practical Examples: End-to-End System Modeling
Let’s model a simple Library Management System using multiple diagram types:
Use Case Diagram (Requirements)
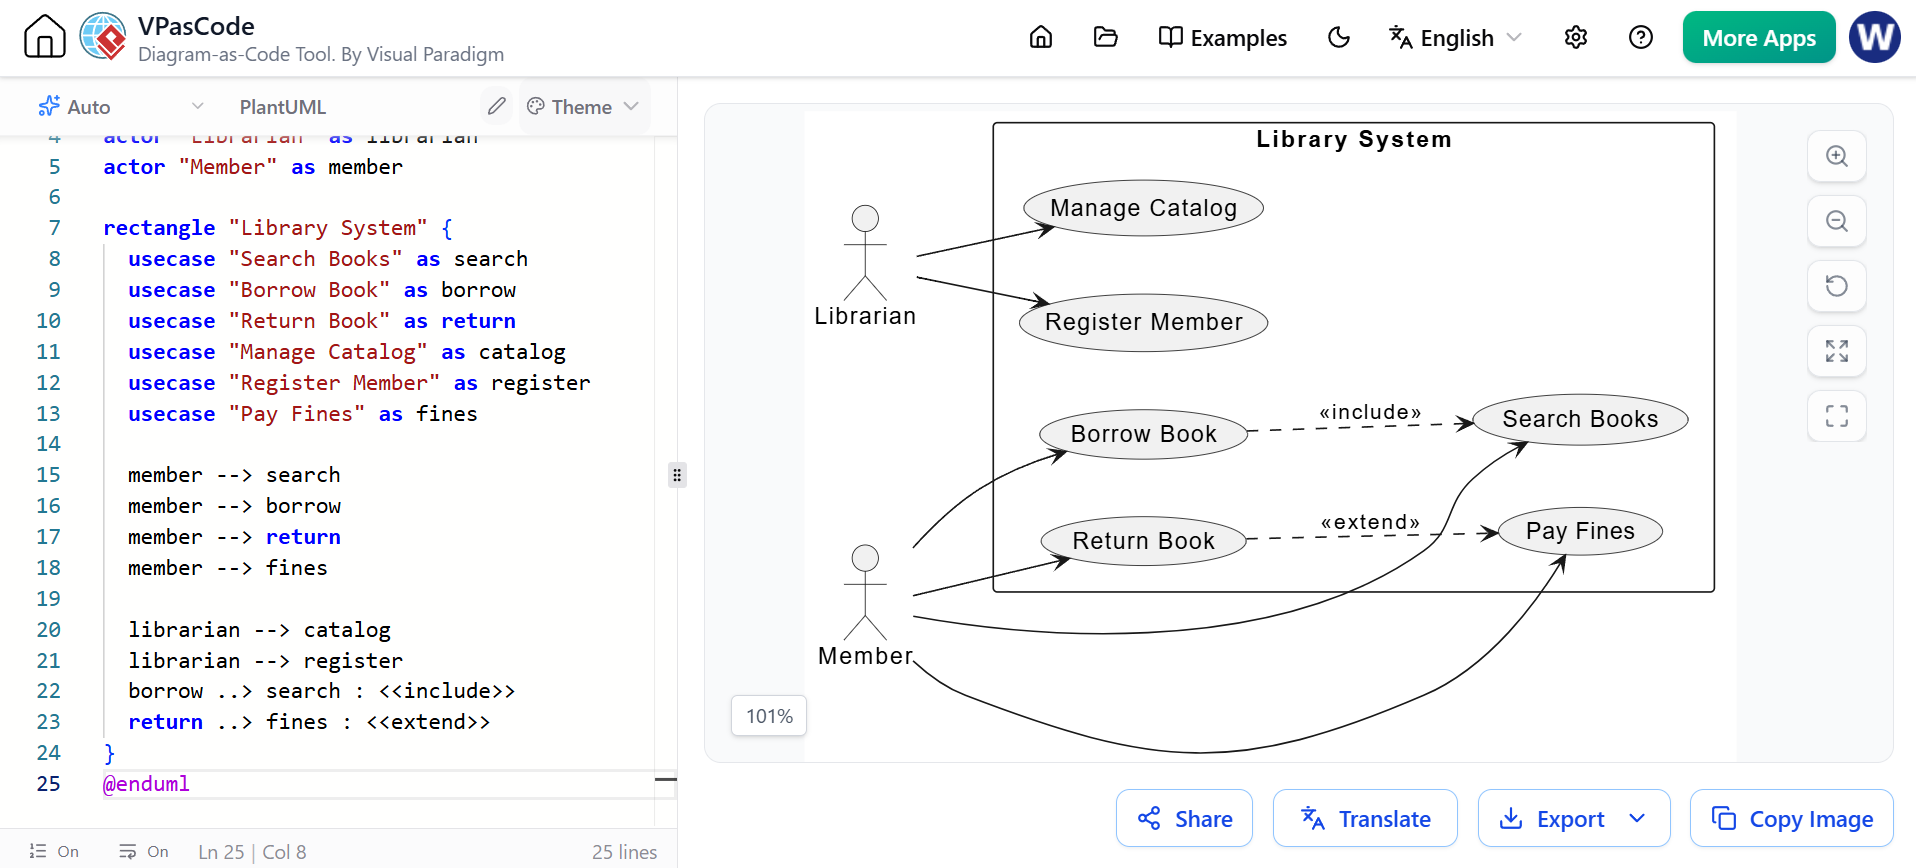
@startuml
left to right direction

actor "Librarian" as librarian
actor "Member" as member

rectangle "Library System" {
  usecase "Search Books" as search
  usecase "Borrow Book" as borrow
  usecase "Return Book" as return
  usecase "Manage Catalog" as catalog
  usecase "Register Member" as register
  usecase "Pay Fines" as fines

  member --> search
  member --> borrow
  member --> return
  member --> fines

  librarian --> catalog
  librarian --> register
  borrow ..> search : <<include>>
  return ..> fines : <<extend>>
}
@enduml
Class Diagram (Design)
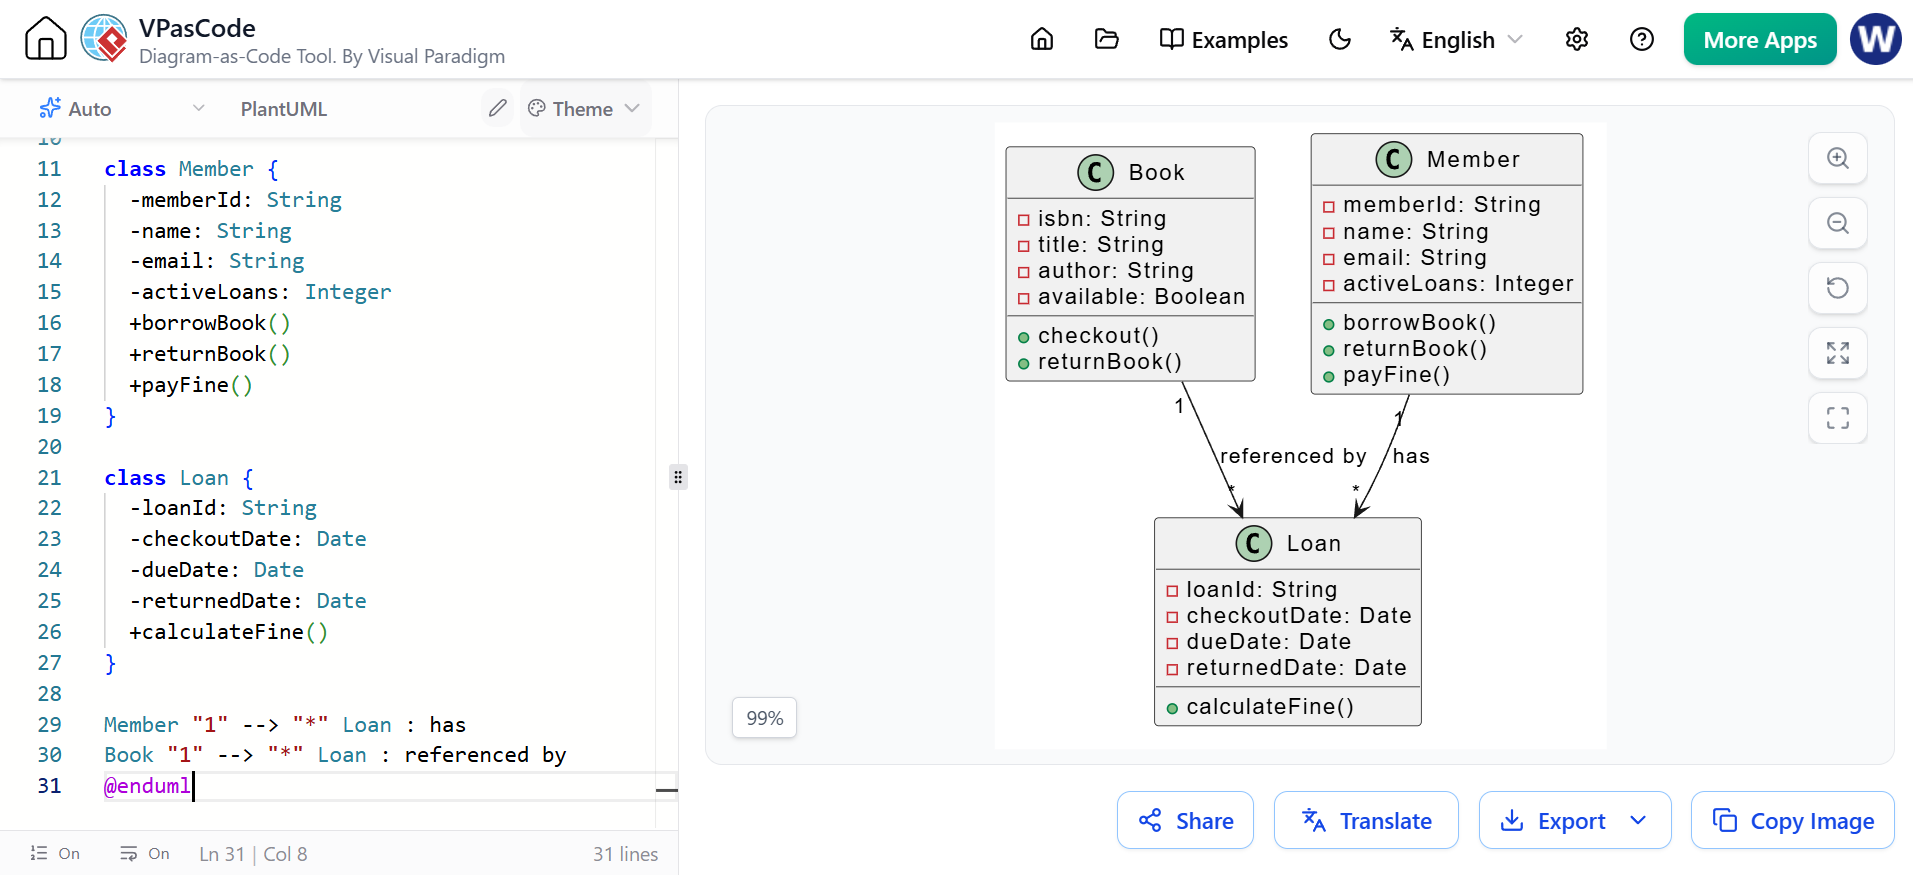
@startuml
class Book {
  -isbn: String
  -title: String
  -author: String
  -available: Boolean
  +checkout()
  +returnBook()
}

class Member {
  -memberId: String
  -name: String
  -email: String
  -activeLoans: Integer
  +borrowBook()
  +returnBook()
  +payFine()
}

class Loan {
  -loanId: String
  -checkoutDate: Date
  -dueDate: Date
  -returnedDate: Date
  +calculateFine()
}

Member "1" --> "*" Loan : has
Book "1" --> "*" Loan : referenced by
@enduml
Sequence Diagram (Interaction)
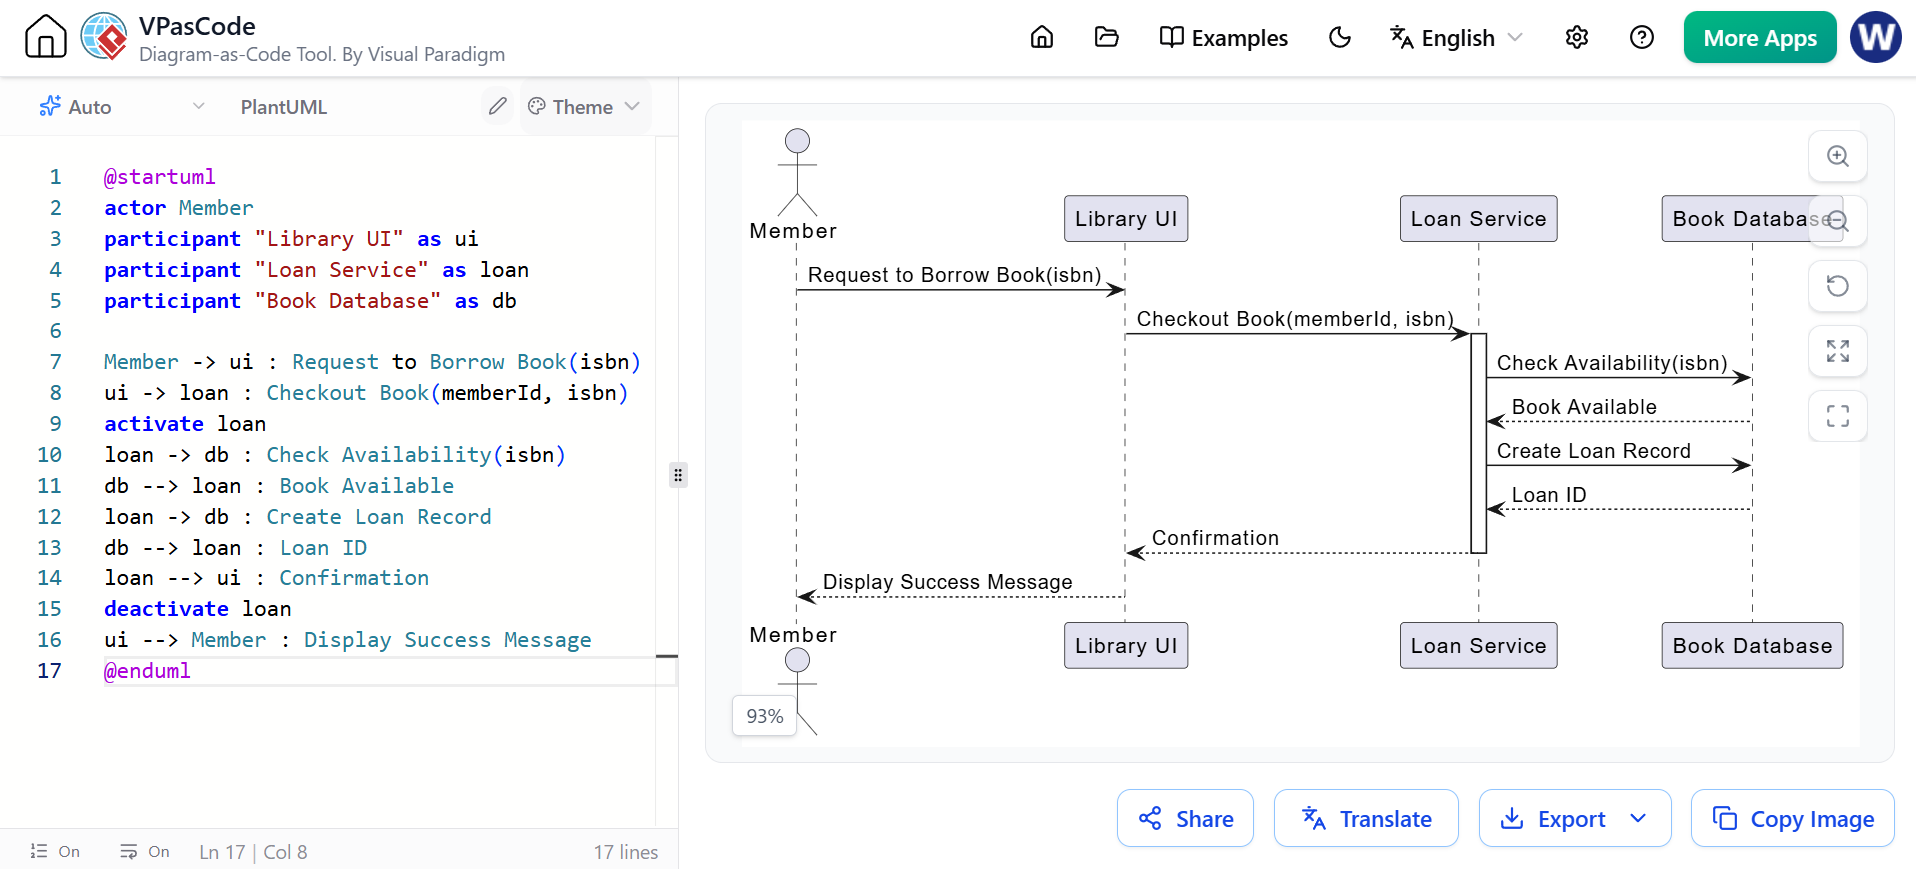
@startuml
actor Member
participant "Library UI" as ui
participant "Loan Service" as loan
participant "Book Database" as db

Member -> ui : Request to Borrow Book(isbn)
ui -> loan : Checkout Book(memberId, isbn)
activate loan
loan -> db : Check Availability(isbn)
db --> loan : Book Available
loan -> db : Create Loan Record
db --> loan : Loan ID
loan --> ui : Confirmation
deactivate loan
ui --> Member : Display Success Message
@enduml
State Machine Diagram (Book Lifecycle)
@startuml
state "Available" as available
state "Checked Out" as checkedOut
state "Reserved" as reserved
state "Lost" as lost

[*] --> available
available --> checkedOut : Member Borrows
checkedOut --> available : Returned On Time
checkedOut --> reserved : Reserved by Another
reserved --> checkedOut : Previous Member Returns
checkedOut --> lost : Not Returned
lost --> [*]
@enduml
Conclusion
UML remains an indispensable tool for software development despite its perceived complexity. With 14 diagram types spanning structural and behavioral modeling, UML provides comprehensive coverage for virtually any software-intensive system. However, the key to success lies not in mastering every diagram type, but in strategically selecting the right diagrams for your specific context.
By applying the 80/20 rule, focusing first on Class, Use Case, Sequence, and Activity diagrams, you can address the majority of modeling needs efficiently. As your projects grow in complexity, gradually incorporate Component, State Machine, and Deployment diagrams to capture architectural and behavioral nuances.
The emergence of AI-powered tooling like Visual Paradigm’s ecosystem transforms UML from a daunting specification into an accessible, productive practice. The AI Diagram Chatbot, AI WebApps, Diagram Generator, and OpenDocs dramatically reduce the learning curve and manual effort, enabling you to:
-
Generate accurate diagrams from natural language descriptions
-
Maintain consistency and best practices automatically
-
Keep diagrams synchronized with evolving code
-
Produce professional documentation with minimal overhead
Remember: UML is a means to an end—better communication, clearer design, and higher-quality software. Don’t let the 700-page specification intimidate you. Start small, leverage AI assistance, focus on the diagrams that matter most for your project, and let your models evolve naturally alongside your system.
Whether you’re documenting requirements, designing architecture, or communicating with stakeholders, UML—powered by modern AI tools—remains one of the most valuable skills in a software professional’s toolkit.
This post is also available in Deutsche, Español, فارسی, Français and English.
Related posts:
 AI-Powered Use Case Modeling: Accelerating Agile Discovery with Visual Paradigm
 Agile Modeling in Action: Accelerating Sprints with Just-in-Time Use Cases
 From Text to Architecture: Accelerating UML Modeling with Visual Paradigm’s Generative AI
 Beyond Pretty Pictures: A Modern Guide to Analysis and Design with AI, Diagram-as-Code, and Visual Paradigm
