Home » Archives for vpmiku » Page 4
-
Posted on May 25, 2022
-
/Under Chart
An In-Depth Guide to Editing Radar Charts Radar charts are a powerful visualization tool that allows you to display data in a circular format, making it easy to compare multiple variables at once. When working with radar charts, it's important to have control over various aspects of the chart, such as the maximum value for each discipline. In this article, we will explore how to edit radar charts and specifically focus on specifying the maximum value using the format panel chart. Understanding Radar Charts Before we dive into editing radar charts, let's briefly…
continue reading →
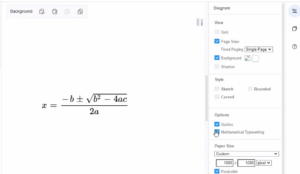
In VP Online, you can enter text in LaTeX, or AsciiMath format, then click on the diagram and select Mathematical typesetting, to turn it into a mathematical formula. In this video, you can see how to write mathematical typesetting in design. https://www.youtube.com/watch?v=xi-bJLJEayA&width=854&height=480 1. First, enter your maths equation using LaTeX or AsciiMath in a text shape. AsciiMath between `, for example: `a^2+b^2 = c^2` LaTeX between $$, for example: $$\sqrt{3×-1}+(1+x)^2$$ Inline LaTeX between \( and \), for example: \(\sqrt{3×-1}+(1+x)^2\)Tips: You can mix inline LaTeX and AsciiMath in the same text 2. After then,…
continue reading →
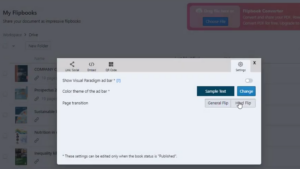
Try to create a flipbook with a new ‘hard’ flipping effect in VP Online. In this video, you can see how to apply a hardflip effect on a flipbook in VP Online. https://www.youtube.com/watch?v=Rq8SYzrXPDY&width=854&height=480 The hardflip effect mimics the reading experience when reading a board book. This effect comes close to flipping through a board book made of highly durable paperboard. It is suitable for you to create a board book or photo book with hard pages. After you create a flipbook, you can find your book in your "Workspace", "My Flipbook". Open the…
continue reading →
Flipbooks are an engaging and interactive way for businesses to present information and showcase their products and services. With the rise of digital media, flipbooks have become an increasingly popular marketing tool that can help businesses stand out in a crowded marketplace. If you're looking to create a flipbook for your business, you need an easy-to-use editor that can help you create professional-quality flipbooks quickly and easily. That's where our company's flipbook editor comes in. https://www.youtube.com/watch?v=Vga9obe7mvw&width=854&height=480 In this blog post, we'll show you how to find recently created flipbooks using our editor…
continue reading →
-
Posted on May 18, 2022
-
/Under Chart
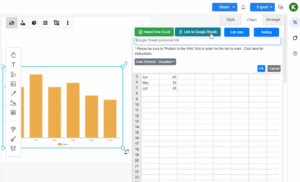
Visual Paradigm support visualizing your data into various charts. This feature gives you valuable insights to your data. The data can be visualized by entering with the build-in spreadsheet tool, uploading of Excel file, or directly linking from Google Sheets. In this article, we will show you how to feed data to your chart by link to Google Sheets. https://www.youtube.com/watch?v=bk44-JOvjpc&width=854&height=480 You can create any chart and link the chart data with Google Sheet when using the Visual Paradigm Online. In Google Sheets, you can go to "Share", and press the "Copy Link" button…
continue reading →
-
Posted on May 16, 2022
-
/Under Chart
A radar chart is a graphical method of displaying multivariate data in the form of a two-dimensional chart of three or more quantitative variables represented on axes starting from the same point. This video will show you how to create a radial chart in Visual Paradigm Online. https://www.youtube.com/watch?v=xyD5PkHtjfE&width=854&height=480 What is a radial chart? A radar chart is a graphical method of displaying multivariate data in the form of a two-dimensional chart of three or more quantitative variables represented on axes starting from the same point. The relative position and angle of the axes…
continue reading →
-
Posted on May 16, 2022
-
/Under Chart
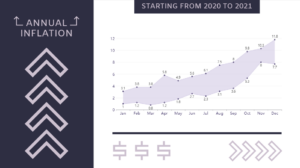
A range area chart type of data visualization is primarily used to display both high and low values for a given time period. The x-axis usually represents the time scale to show how the data changes over time. This video will show you how to create a range area chart in Visual Paradigm Online. https://www.youtube.com/watch?v=Ihnyc7HoTFU&width=854&height=480 What is a range area chart? A range area chart displays information as a range of data by plotting two Y values (low and high) for each data point. It looks like two lines, and the area between…
continue reading →
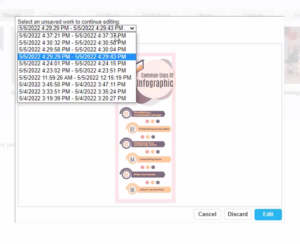
Visual Paradigm Online automatically saves your work as you edit it. Auto-save saves the project currently open from time to time on its own. It helps to avoid losing project data when your machine crashes between saves or hits a power outage suddenly. This video will show you how to restore your unsaved works in Visual Paradigm Online. https://www.youtube.com/watch?v=M6nnp-BgmL8&width=854&height=480 In VP Online, you can restore your unsaved works, in case you previously missed saving them, for example, a computer crashed. In the dashboard, simply go to My Documents, unsaved works, to show the…
continue reading →
Your design is almost finished and now it'll be perfect if you could move everything over towards the left just a little bit. Our graphic design tool has features such as the Magnet and Sweeper tool. You can move all the objects at once without selecting anything. Magnet tool will pull objects closer, while sweeper will push objects further apart. This video will show you how to move a group of shapes with the sweeper and magnet tool. https://www.youtube.com/watch?v=DPjDKaNvJCw&width=854&height=480 When editing your design, you can make some space, or reduce space within the…
continue reading →
Have you ever wondered how to convert a Word document into an eBook? Or how to read a Word document as if you are reading a flipbook? In Visual Paradigm Online, you can convert Microsoft Word documents into flipbooks. Publish and share any digital flipbooks online. This video will show you how to upload an MS Word file to become a flipbook. https://www.youtube.com/watch?v=6KkP76OZXtA&width=854&height=480 In VP Online, you can go to My Flipbooks, and press the Choose File button under Flipbook Converter, to convert your Microsoft Word document into a flipbook. The digital documents…
continue reading →


