Home » Archives for June 2022 » Page 4
-
Posted on June 10, 2022
-
/Under Chart
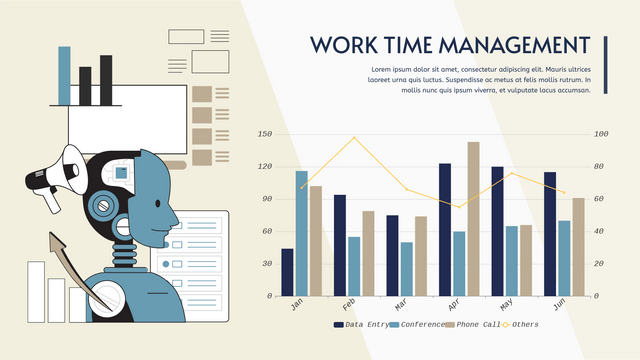
What Is A Grouped Column And Line Chart Grouped column And Line chart is a kind of combined chart consisted in grouped column chart and line chart. A line chart is placed on the top of a grouped column chart to show 2 sets of data together with widely difference. When To Use Grouped Column And Line Chart In a grouped column and line chart, Y-axis on both 2 sides are representing the value of the 2 sets of data. In this case, the difference between the ranges of their data are usually…
continue reading →
-
Posted on June 10, 2022
-
/Under Chart
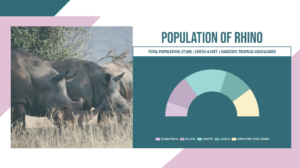
The semi-circle chart generally uses half (or more than half) circles, which has the same function as the ordinary circle chart, except that the percentage is displayed in the form of a semi-circle, which is sometimes more in line with the vision. This video will show you how to create a semi-doughnut chart in Visual Paradigm Online. https://www.youtube.com/watch?v=6QrsLD00yUg&width=854&height=480 What is a Semi-Doughnut Chart? A Semi-Doughnut Chart is a 180 degrees graph that represents a composition as a whole. The semi-circle chart generally uses half (or more than half) circles, which has the same…
continue reading →
-
Posted on June 10, 2022
-
/Under Chart
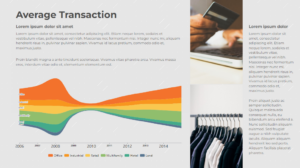
A streamgraph, or stream graph, is a type of stacked area graph which is displaced around a central axis, resulting in a flowing, organic shape. This video will show you how to create a stream chart in Visual Paradigm Online. https://www.youtube.com/watch?v=V5p4UxZEZck&width=854&height=480 What is a Stream Graph? A stream graph, or stream graph, is a type of stacked area graph which is displaced around a central axis, resulting in a flowing, organic shape. Unlike a traditional stacked area graph in which the layers are stacked on top of an axis, in a streamgraph, the…
continue reading →
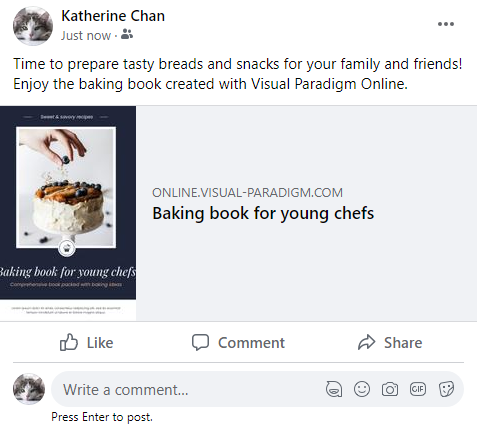
Fliplify flipbook Maker support creation of flipbook from stretch and conversion from other documents to flipbook. After online flipbook is created, we can share it with others through the internet, including Facebook. In this article, we will show you how to do so. https://www.youtube.com/watch?v=h1WiCpwuU4U&width=854&height=480 How To Share The Flipbook Via Facebook After publishing a flipbook, go to My Flipbook, then click share on the right. We can then see the following browser. Click the logo of Facebook below to share the flipbook. Introduce your flipbook in the post and share it in your…
continue reading →
You can create flipbooks easily with Fliplify in Visual Paradigm Online. You can feel free to create different kinds of flipbooks like photo books, menus, reports, and presentations with various pages that you want. You can also preview your uploaded flipbooks page by page with the flipbook maker in "My flipbooks". All your books created in Visual Paradigm Online will be listed on the page. Sometimes, you may want to delete the books that you have created. Here is a fast tutorial to guide you to delete the books created in one click.…
continue reading →
In Visual Paradigm Online, you can create flipbooks easily with Fliplify. You can feel free to create different kinds of flipbooks like photo books, menus, reports, and presentations with various pages that you want. You can also preview your uploaded flipbooks page by page with the flipbook maker in "My flipbooks". The books you uploaded will be listed on that page. Sometimes, you may find it hard to find the books that you have created on the list. Here will introduce a search function of books that you can find your uploaded books…
continue reading →
-
Posted on June 9, 2022
-
/Under Chart
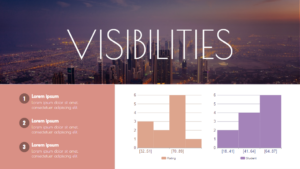
A histogram is an approximate representation of the distribution of numerical data. To construct a histogram, the first step is to "bin" (or "bucket") the range of values—that is, divide the entire range of values into a series of intervals—and then count how many values fall into each interval. This video will show you how to create a Histogram in Visual Paradigm Online. https://www.youtube.com/watch?v=o54-u_G3oBY&width=854&height=480 What is a Histogram? Histograms give a rough sense of the density of the underlying distribution of the data, and often for density estimation: estimating the probability density function…
continue reading →
In today’s digital landscape, creating engaging and reader-friendly content is crucial. With Fliplify, you can design a wide variety of flipbooks, from interactive catalogs and portfolios to dynamic presentations and photobooks. One standout feature that enhances the reading experience is the Distraction-Free Reading Mode. This mode provides a clean and focused environment by removing unnecessary elements and interruptions, allowing readers to immerse themselves fully in the content. In this blog post, we will explore how to activate and utilize the Distraction-Free Reading Mode in your Fliplify flipbooks. https://www.youtube.com/watch?v=pTrMYjKoHcA&feature=youtu.be&width=854&height=480 Click the reading mode button…
continue reading →
-
Posted on June 8, 2022
-
/Under Chart
In Visual Paradigm Online, you can easily create graphics with the online design tool for free. Sometimes, we need to record data for a particular use and sometimes we may need to present the data through graphics. In Visual Paradigm Online, you can create various charts freely like bar charts, column charts, pie charts, etc. This chart tool can help you to display any data by using text, symbols, and graphics. You can easily visualize the data that you have collected as graphics and they are presentable. This is a guide for teaching…
continue reading →
-
Posted on June 7, 2022
-
/Under Chart
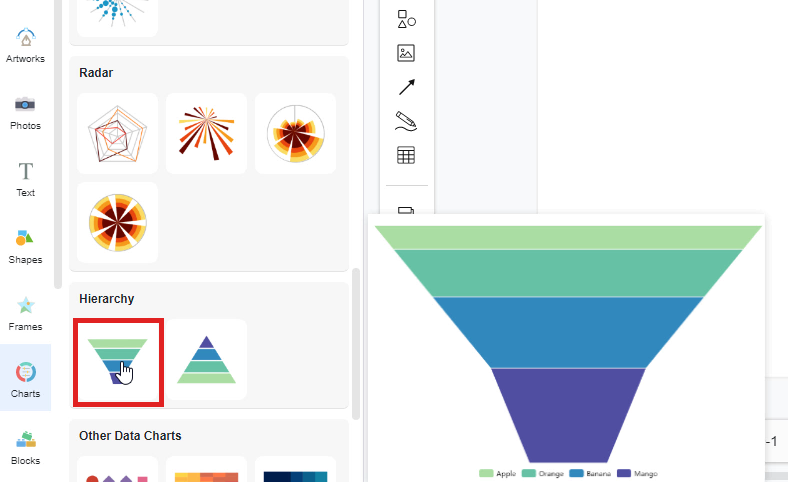
Visual Paradigm Online provide you an online design tool for everyone to use. We often record data for a particular use and sometimes we may need to present the data through graphics. In Visual Paradigm Online, you can create various charts freely like bar charts, column charts, pie charts, etc. This chart tool can help you to display any data by using text, symbols, and graphics. You can easily visualize the data that you have collected as graphics and they are presentable. This is a guide for teaching you to create a funnel…
continue reading →

