

Beyond Static Images: Unlocking the Power of Diagram-as-Code with Mermaid and AI Tooling
The Documentation Crisis
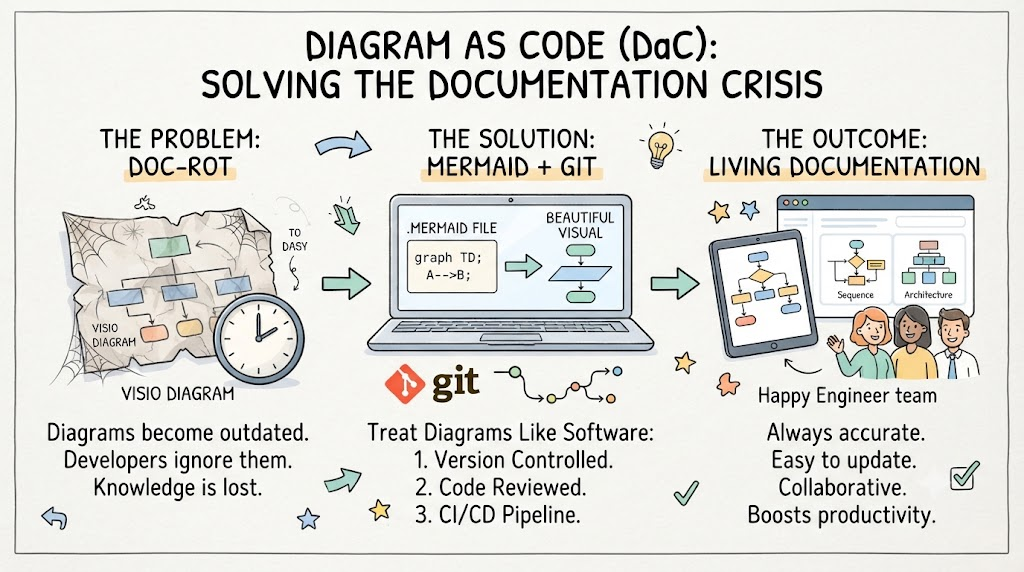
Every engineering team knows the pain. You spend weeks designing a beautiful microservices architecture, meticulously crafting Visio diagrams that impress stakeholders. Six months later, the system has evolved—new services added, databases migrated, API endpoints deprecated—but the diagram is frozen in time. It’s a relic. A lie, even.
This is “doc-rot,” and it’s the silent killer of engineering productivity. When diagrams lie, developers ignore them. When developers ignore documentation, tribal knowledge takes over. When the one person who knows the system leaves, you’re left with a complex codebase and no map.
Diagram as Code (DaC) is the solution. And at its heart is Mermaid, the JavaScript-based diagramming tool that turns plain text into beautiful visuals.
The Core Philosophy: Treat Diagrams Like Software
The fundamental shift with Diagram as Code is treating your diagrams with the same rigor as your application code. This means:
1. Version Control is Standard
When your diagram is a .mermaid file, it lives in your Git repository alongside your source code. Every change is tracked. You can git blame to see who added that new service, git diff to review changes before merging, and roll back to any previous state.
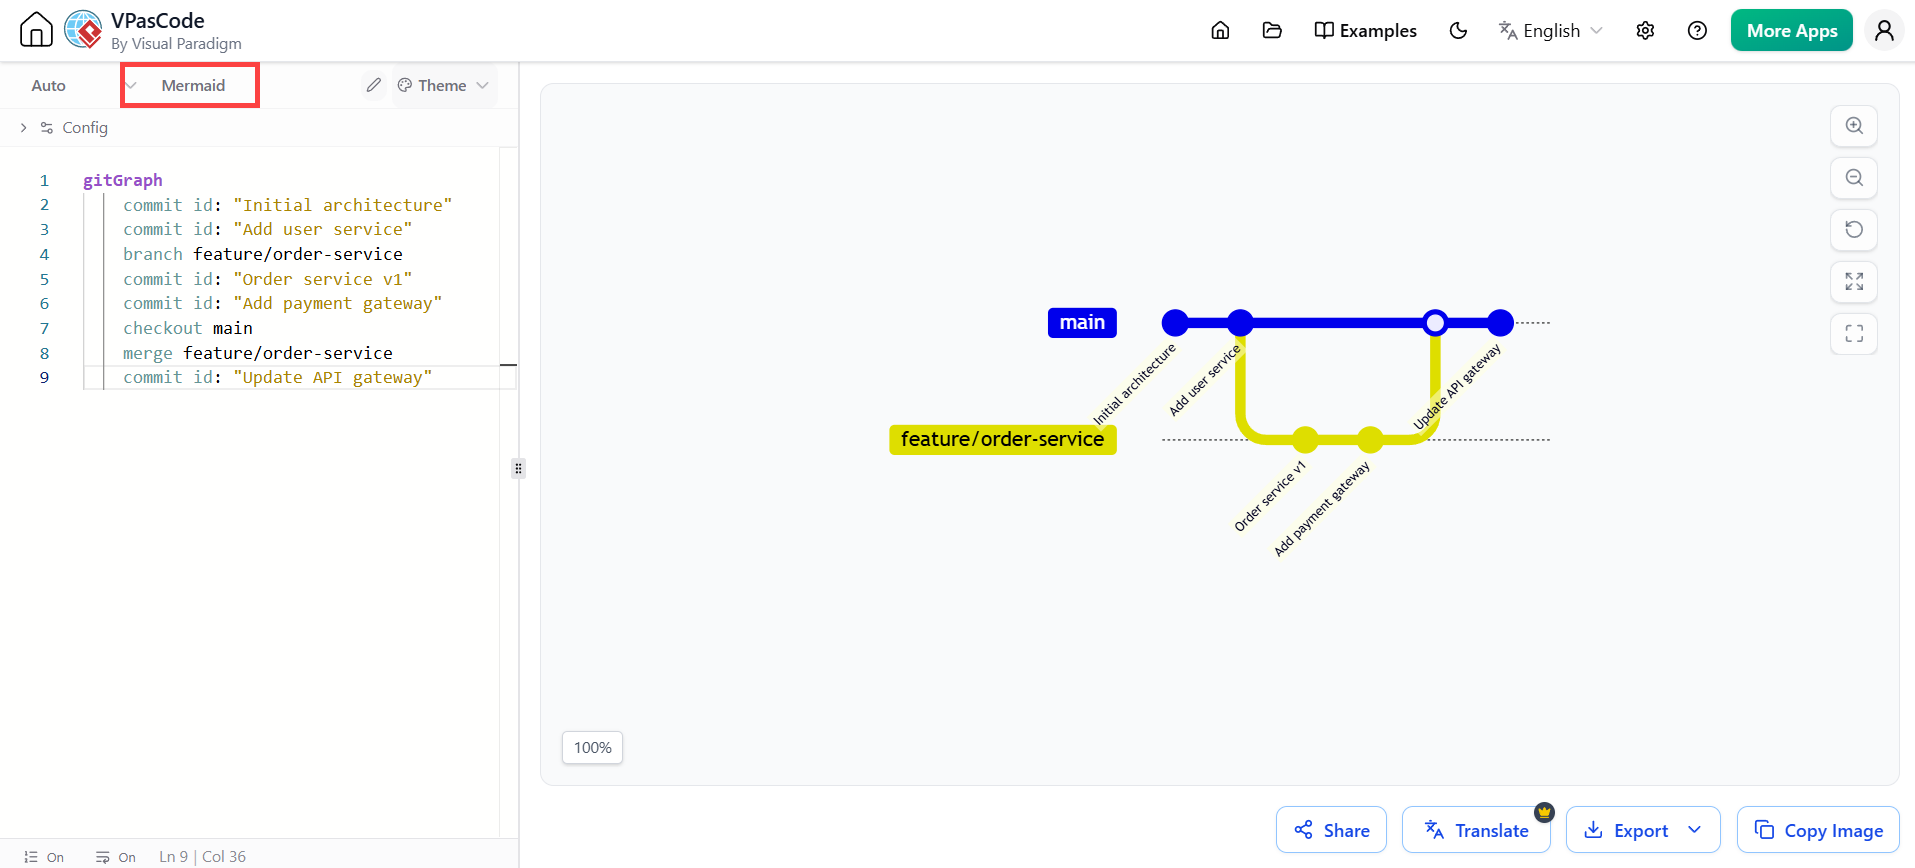
gitGraph
    commit id: "Initial architecture"
    commit id: "Add user service"
    branch feature/order-service
    commit id: "Order service v1"
    commit id: "Add payment gateway"
    checkout main
    merge feature/order-service
    commit id: "Update API gateway"
Example: Visualizing your diagram’s own Git history using Mermaid’s Git Graph syntax
2. Code Reviews for Diagrams
Pull requests aren’t just for code anymore. When a developer proposes a new service or changes a data flow, that change appears as a readable diff in the PR. Reviewers can comment on the diagram itself, ensuring architectural decisions are discussed and approved before they’re merged.
3. CI/CD Pipeline Integration
Your diagrams can be automatically generated and validated in your pipeline. Imagine a GitHub Action that:
-
Renders all Mermaid diagrams as PNG/SVG
-
Uploads them to your documentation site
-
Fails the build if invalid Mermaid syntax is detected

flowchart LR
    A[Developer Pushes Code] --> B[CI Pipeline Runs]
    B --> C[Run Tests]
    B --> D[Render Mermaid Diagrams]
    D --> E{Valid Syntax?}
    E -->|Yes| F[Upload to Documentation]
    E -->|No| G[Fail Build & Alert Team]
    F --> H[Deploy Application]
    G --> I[Developer Fixes Syntax]
    I --> A
Example: A CI/CD workflow for diagram validation and deployment
Mermaid in Action: Real-World Examples
Let’s explore the types of diagrams Mermaid supports with practical, real-world examples.
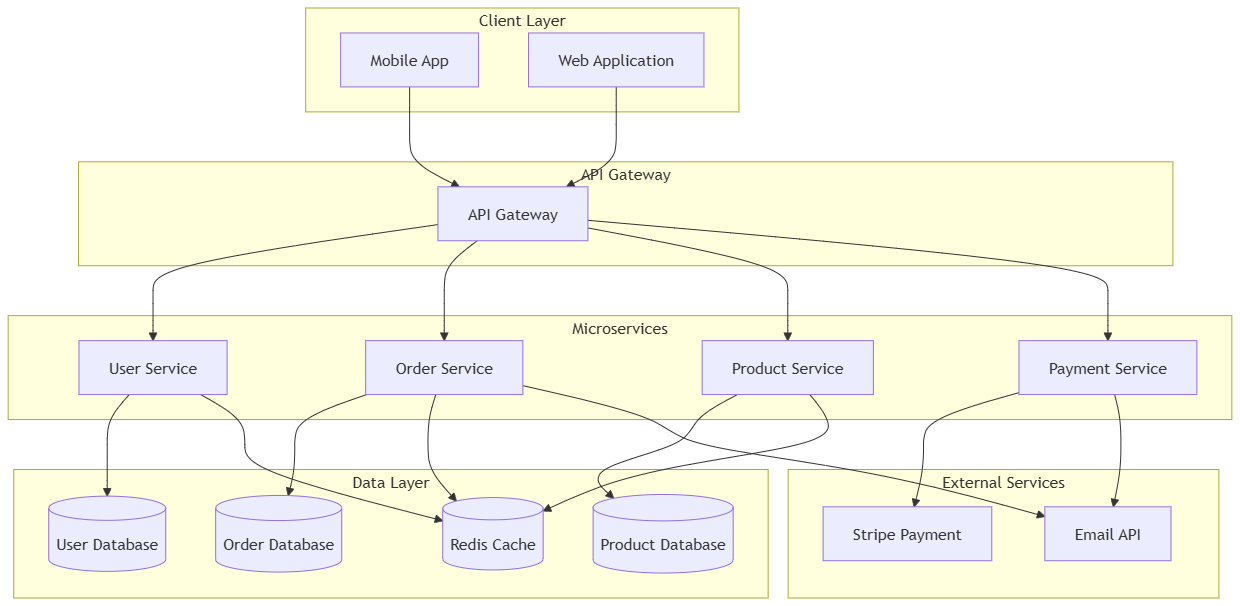
Example 1: Microservices Architecture (Flowchart)
This is the most common use case—visualizing how your services communicate.
flowchart TB
    subgraph "Client Layer"
        MobileApp[Mobile App]
        WebApp[Web Application]
    end

    subgraph "API Gateway"
        Gateway[API Gateway]
    end

    subgraph "Microservices"
        UserSvc[User Service]
        OrderSvc[Order Service]
        ProductSvc[Product Service]
        PaymentSvc[Payment Service]
    end

    subgraph "Data Layer"
        UserDB[(User Database)]
        OrderDB[(Order Database)]
        ProductDB[(Product Database)]
        Redis[(Redis Cache)]
    end

    subgraph "External Services"
        Stripe[Stripe Payment]
        EmailAPI[Email API]
    end

    MobileApp --> Gateway
    WebApp --> Gateway
    Gateway --> UserSvc
    Gateway --> OrderSvc
    Gateway --> ProductSvc
    Gateway --> PaymentSvc

    UserSvc --> UserDB
    UserSvc --> Redis
    OrderSvc --> OrderDB
    OrderSvc --> Redis
    ProductSvc --> ProductDB
    ProductSvc --> Redis

    PaymentSvc --> Stripe
    OrderSvc --> EmailAPI
    PaymentSvc --> EmailAPI
Example: A complete microservices architecture with caching, databases, and external dependencies
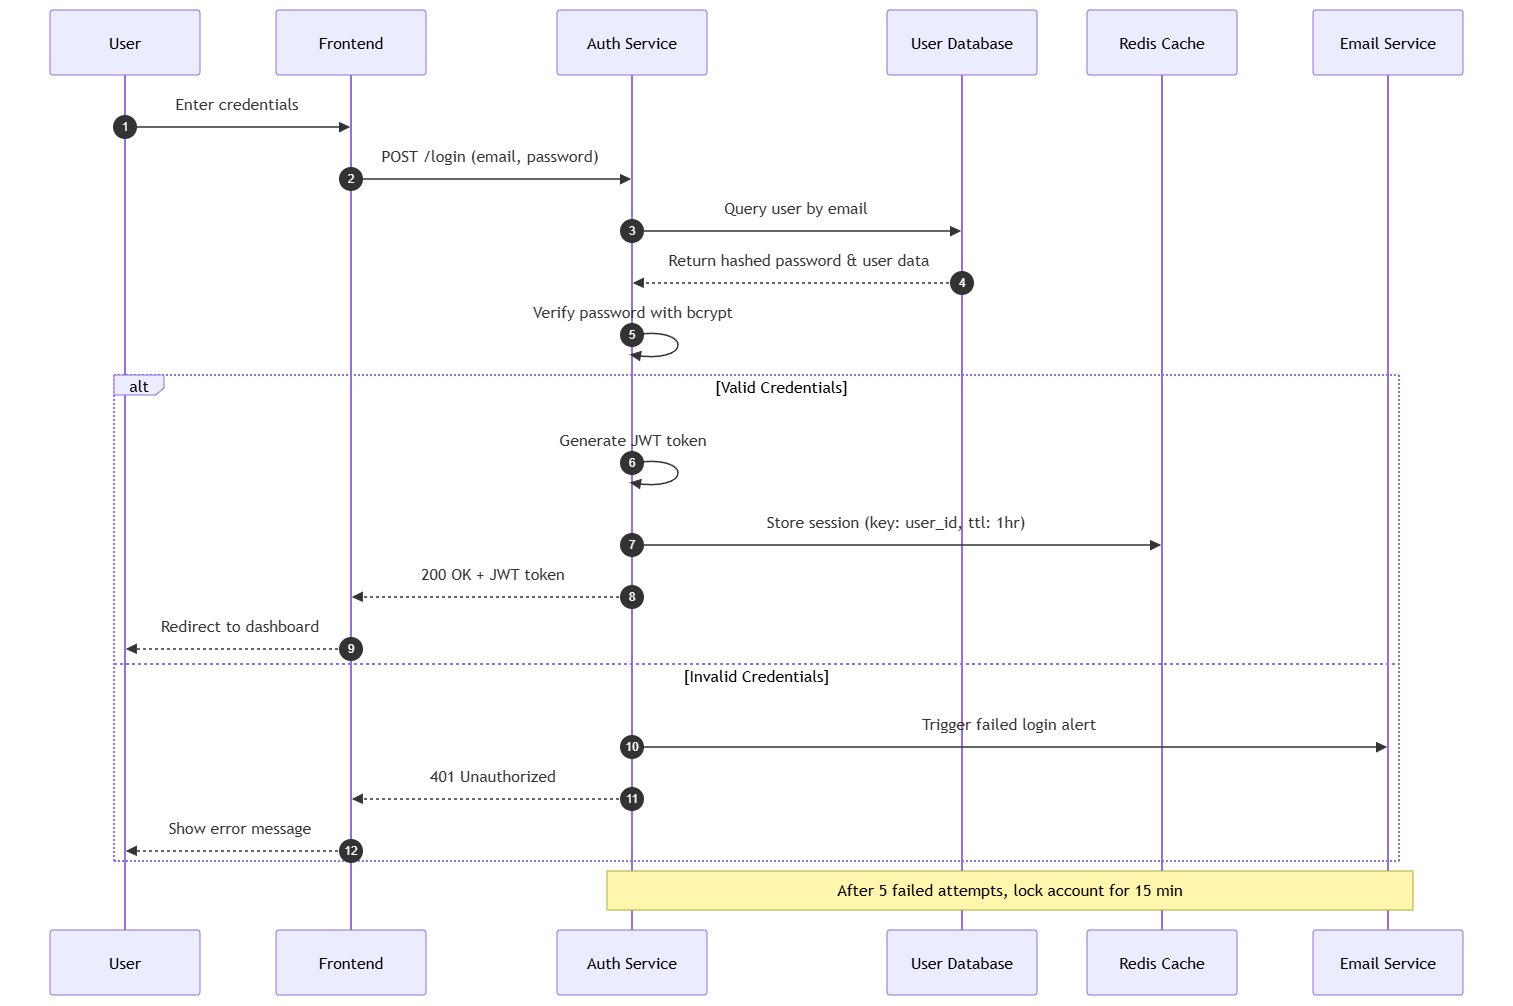
Example 2: User Authentication Flow (Sequence Diagram)
Sequence diagrams are perfect for documenting complex interactions between services.
sequenceDiagram
    autonumber
    participant User
    participant Frontend
    participant AuthSvc as Auth Service
    participant UserDB as User Database
    participant Cache as Redis Cache
    participant EmailSvc as Email Service

    User->>Frontend: Enter credentials
    Frontend->>AuthSvc: POST /login (email, password)
    AuthSvc->>UserDB: Query user by email
    UserDB-->>AuthSvc: Return hashed password & user data
    AuthSvc->>AuthSvc: Verify password with bcrypt

    alt Valid Credentials
        AuthSvc->>AuthSvc: Generate JWT token
        AuthSvc->>Cache: Store session (key: user_id, ttl: 1hr)
        AuthSvc-->>Frontend: 200 OK + JWT token
        Frontend-->>User: Redirect to dashboard
    else Invalid Credentials
        AuthSvc->>EmailSvc: Trigger failed login alert
        AuthSvc-->>Frontend: 401 Unauthorized
        Frontend-->>User: Show error message
    end

    Note over AuthSvc,EmailSvc: After 5 failed attempts, lock account for 15 min
Example: A detailed authentication flow showing success and failure paths, including side effects like caching and alerts
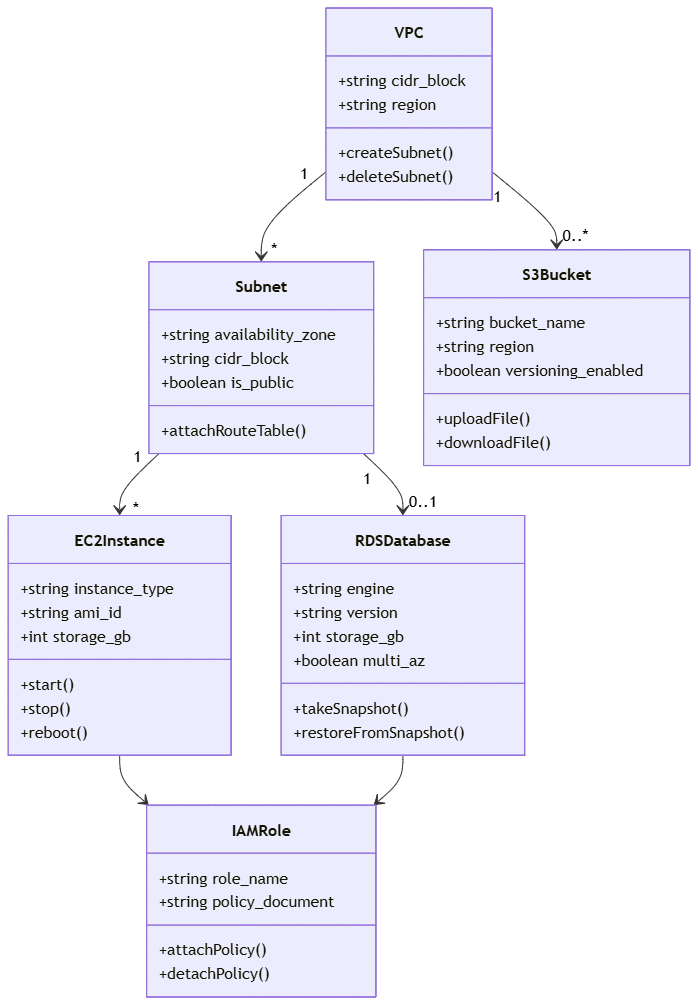
Example 3: Cloud Infrastructure on AWS (Class Diagram)
Class diagrams aren’t just for code—they can model cloud resources and their relationships.
classDiagram
    class VPC {
        +string cidr_block
        +string region
        +createSubnet()
        +deleteSubnet()
    }

    class Subnet {
        +string availability_zone
        +string cidr_block
        +boolean is_public
        +attachRouteTable()
    }

    class EC2Instance {
        +string instance_type
        +string ami_id
        +int storage_gb
        +start()
        +stop()
        +reboot()
    }

    class RDSDatabase {
        +string engine
        +string version
        +int storage_gb
        +boolean multi_az
        +takeSnapshot()
        +restoreFromSnapshot()
    }

    class S3Bucket {
        +string bucket_name
        +string region
        +boolean versioning_enabled
        +uploadFile()
        +downloadFile()
    }

    class IAMRole {
        +string role_name
        +string policy_document
        +attachPolicy()
        +detachPolicy()
    }

    VPC "1" --> "*" Subnet
    Subnet "1" --> "*" EC2Instance
    Subnet "1" --> "0..1" RDSDatabase
    VPC "1" --> "0..*" S3Bucket
    EC2Instance --> IAMRole
    RDSDatabase --> IAMRole
Example: Modeling AWS infrastructure as classes with properties and methods, useful for documentation and Infrastructure-as-Code planning
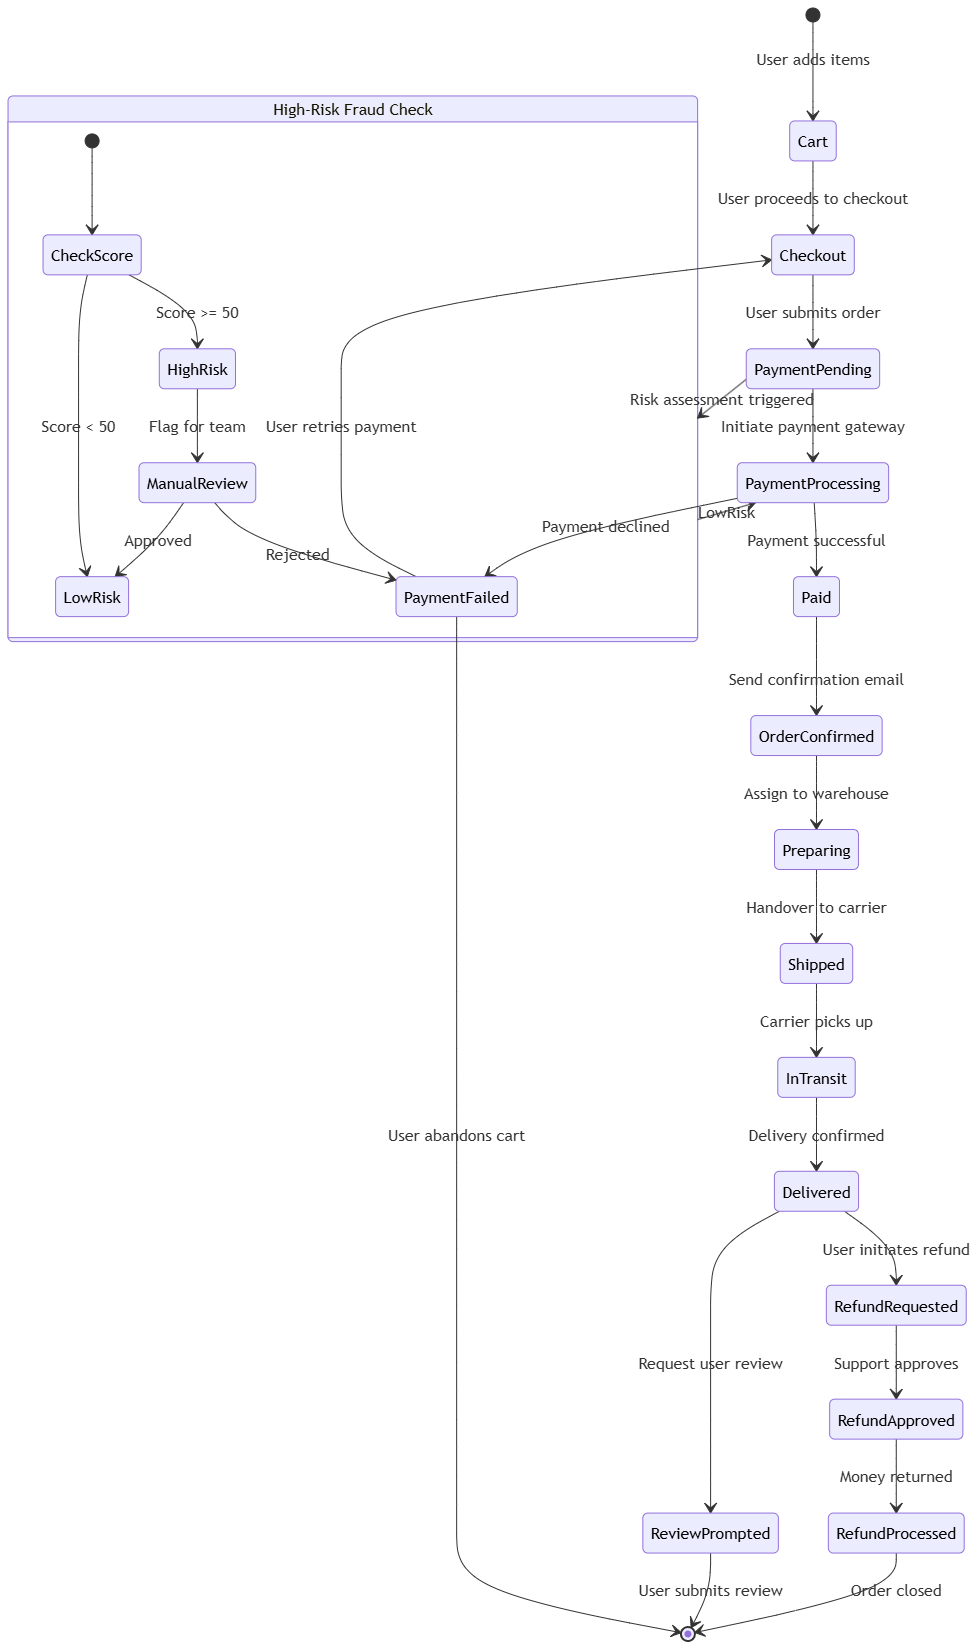
Example 4: E-Commerce Order Processing (State Diagram)
State diagrams excel at showing how entities transition through different statuses.
stateDiagram-v2
    [*] --> Cart: User adds items
    Cart --> Checkout: User proceeds to checkout

    Checkout --> PaymentPending: User submits order
    PaymentPending --> PaymentProcessing: Initiate payment gateway

    PaymentProcessing --> Paid: Payment successful
    PaymentProcessing --> PaymentFailed: Payment declined

    PaymentFailed --> Checkout: User retries payment
    PaymentFailed --> [*]: User abandons cart

    Paid --> OrderConfirmed: Send confirmation email
    OrderConfirmed --> Preparing: Assign to warehouse

    Preparing --> Shipped: Handover to carrier
    Shipped --> InTransit: Carrier picks up

    InTransit --> Delivered: Delivery confirmed
    Delivered --> ReviewPrompted: Request user review

    ReviewPrompted --> [*]: User submits review
    Delivered --> RefundRequested: User initiates refund

    RefundRequested --> RefundApproved: Support approves
    RefundApproved --> RefundProcessed: Money returned
    RefundProcessed --> [*]: Order closed

    state "High-Risk Fraud Check" as FraudCheck {
        [*] --> CheckScore
        CheckScore --> LowRisk: Score < 50
        CheckScore --> HighRisk: Score >= 50
        HighRisk --> ManualReview: Flag for team
        ManualReview --> LowRisk: Approved
        ManualReview --> PaymentFailed: Rejected
    }

    PaymentPending --> FraudCheck: Risk assessment triggered
    FraudCheck --> PaymentProcessing: LowRisk
Example: Complete e-commerce order state machine with fraud detection nested state
Example 5: Sprint Planning with GitHub Issues (Git Graph)
Git graphs can represent workflows beyond Git itself.
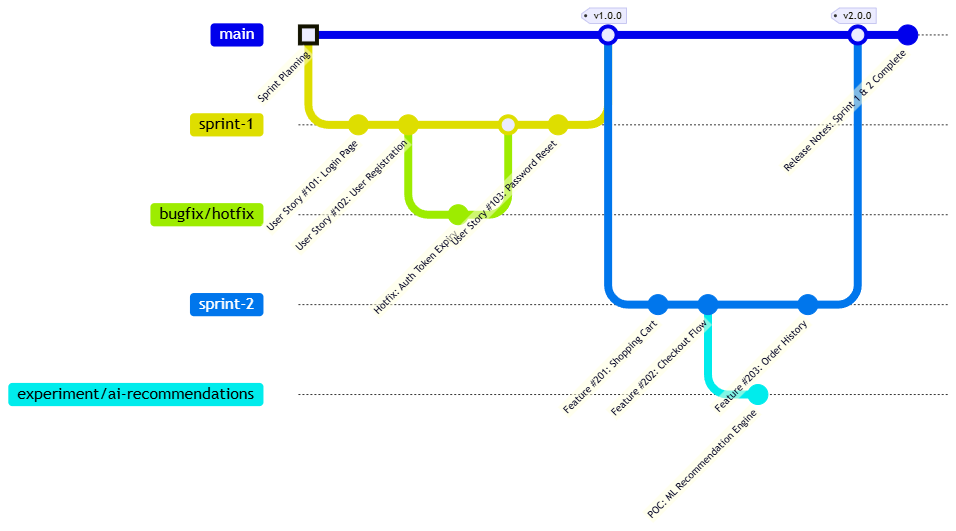
gitGraph
    commit id: "Sprint Planning" type: HIGHLIGHT

    branch sprint-1
    commit id: "User Story #101: Login Page"
    commit id: "User Story #102: User Registration"

    branch bugfix/hotfix
    commit id: "Hotfix: Auth Token Expiry"
    checkout sprint-1
    merge bugfix/hotfix

    commit id: "User Story #103: Password Reset"

    checkout main
    merge sprint-1 tag: "v1.0.0"

    branch sprint-2
    commit id: "Feature #201: Shopping Cart"
    commit id: "Feature #202: Checkout Flow"

    branch experiment/ai-recommendations
    commit id: "POC: ML Recommendation Engine"

    checkout sprint-2
    commit id: "Feature #203: Order History"

    checkout main
    merge sprint-2 tag: "v2.0.0"

    commit id: "Release Notes: Sprint 1 & 2 Complete"
Example: Visualizing project management, sprints, and feature branches as a Git graph
The AI Revolution in Diagramming
Despite Mermaid’s elegance, the syntax can be a barrier. Who wants to debug a misaligned arrow or a missing bracket when you’re trying to document a system?
This is where AI-powered tools change everything.
AI Auto-Fix
Tools like VPasCode (Visual Paradigm’s Diagram as Code platform) and Mermaid Chart have integrated AI models (like Google Gemini and OpenAI) that can:
-
Auto-detect syntax errors
-
Fix broken diagrams with a single click
-
Suggest improvements to diagram structure
Let’s see this in action:
Broken Mermaid Code:
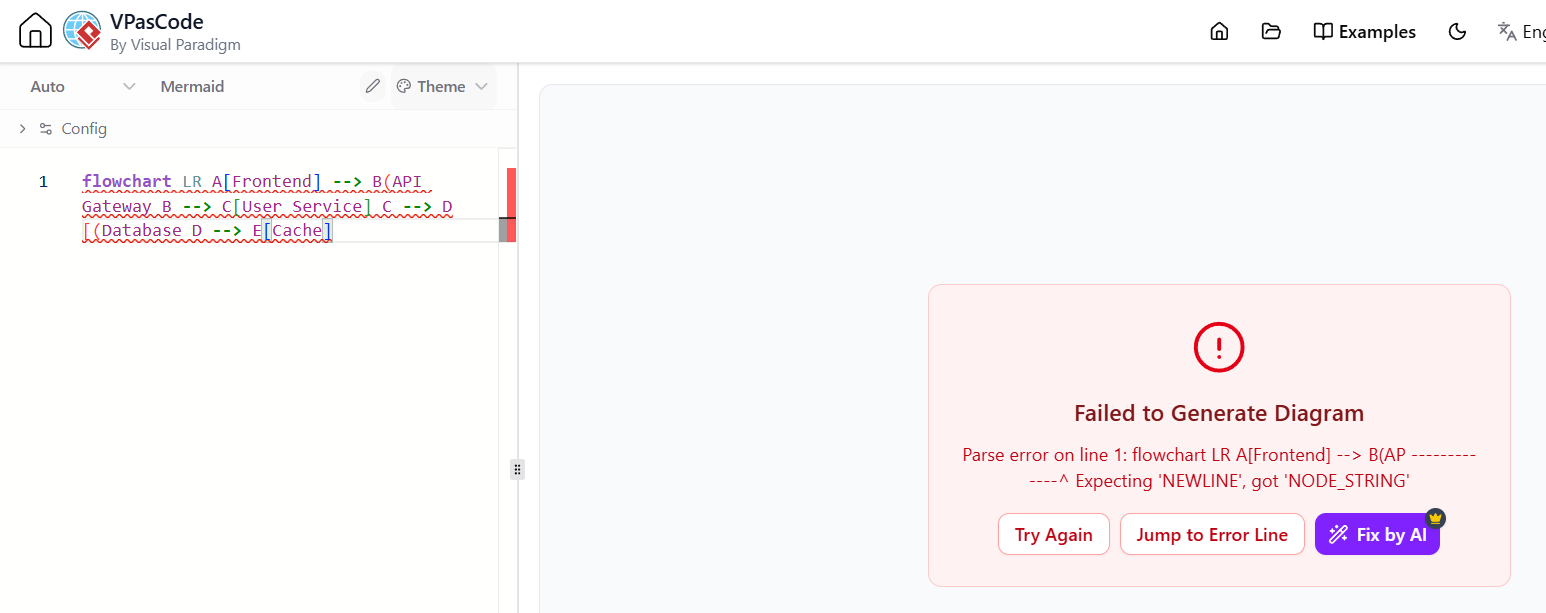
flowchart LR
    A[Frontend] --> B(API Gateway
    B --> C[User Service]
    C --> D[(Database
    D --> E[Cache]
AI-Fixed Code:
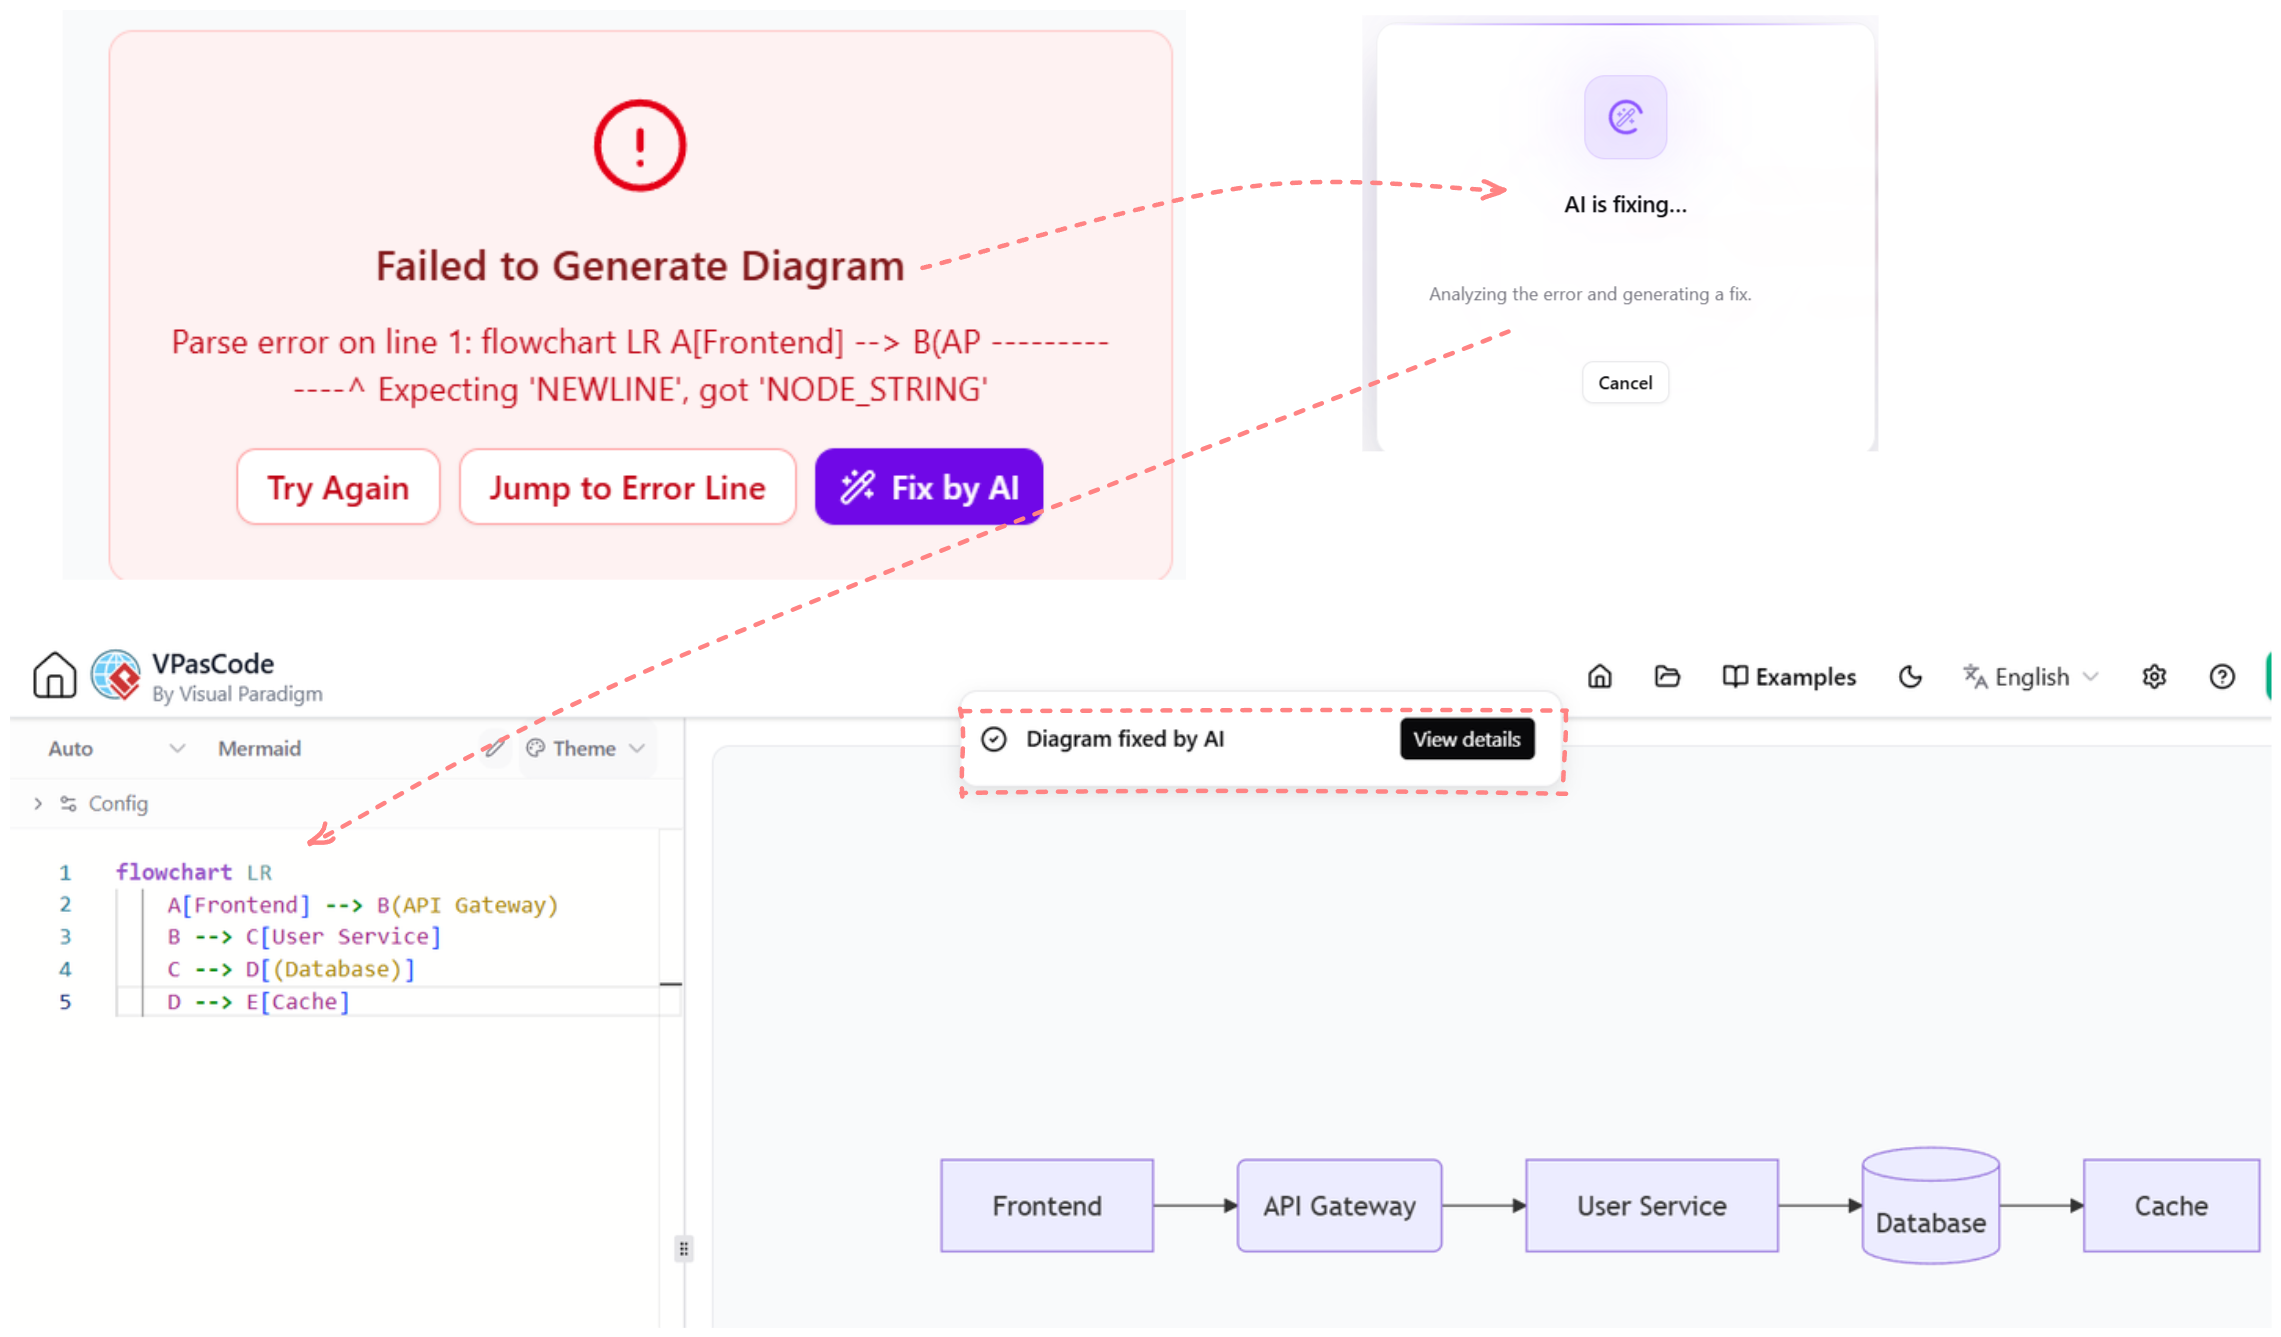
flowchart LR
    A[Frontend] --> B(API Gateway)
    B --> C[User Service]
    C --> D[(Database)]
    D --> E[Cache]
The AI recognizes missing closing parentheses and brackets, fixing them instantly.
Natural Language to Diagram
Perhaps the most powerful feature is generating diagrams from natural language descriptions. With tools like OpenDocs (VP’s documentation platform), you can simply describe what you want:
“Create a flowchart showing a user logging in. If the credentials are valid, redirect to the dashboard. If invalid, show an error and allow 3 attempts. After 3 failures, lock the account.”
AI-Generated Mermaid:
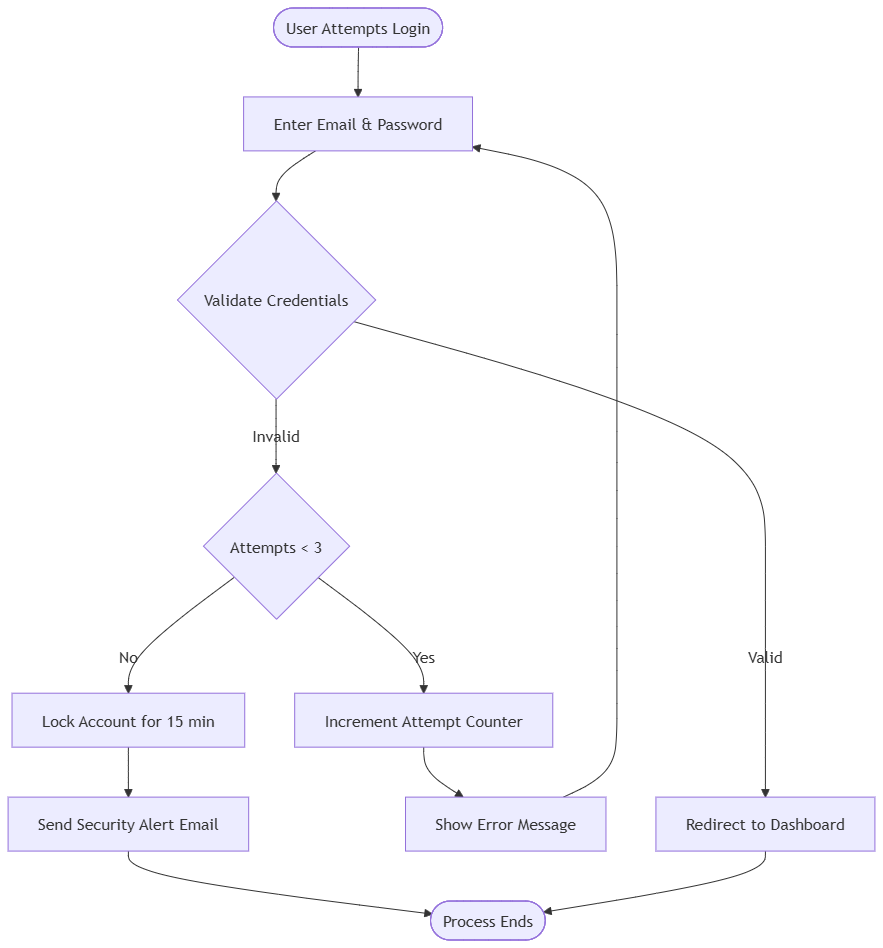
flowchart TD
    Start([User Attempts Login]) --> EnterCreds[Enter Email & Password]
    EnterCreds --> Validate{Validate Credentials}
    Validate -->|Valid| Dashboard[Redirect to Dashboard]
    Validate -->|Invalid| CheckAttempts{Attempts < 3}
    CheckAttempts -->|Yes| Increment[Increment Attempt Counter]
    Increment --> ShowError[Show Error Message]
    ShowError --> EnterCreds
    CheckAttempts -->|No| LockAccount[Lock Account for 15 min]
    LockAccount --> SendAlert[Send Security Alert Email]
    SendAlert --> End([Process Ends])
    Dashboard --> End
Translation Between Diagram Types
AI can also translate between different diagram formats. Need a PlantUML diagram converted to Mermaid? AI tools can handle that:
PlantUML Input:
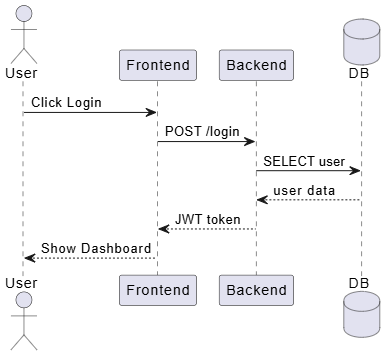
@startuml
actor User
participant "Frontend" as FE
participant "Backend" as BE
database "DB" as DB

User -> FE: Click Login
FE -> BE: POST /login
BE -> DB: SELECT user
DB --> BE: user data
BE --> FE: JWT token
FE --> User: Show Dashboard
@enduml
AI-Converted Mermaid:
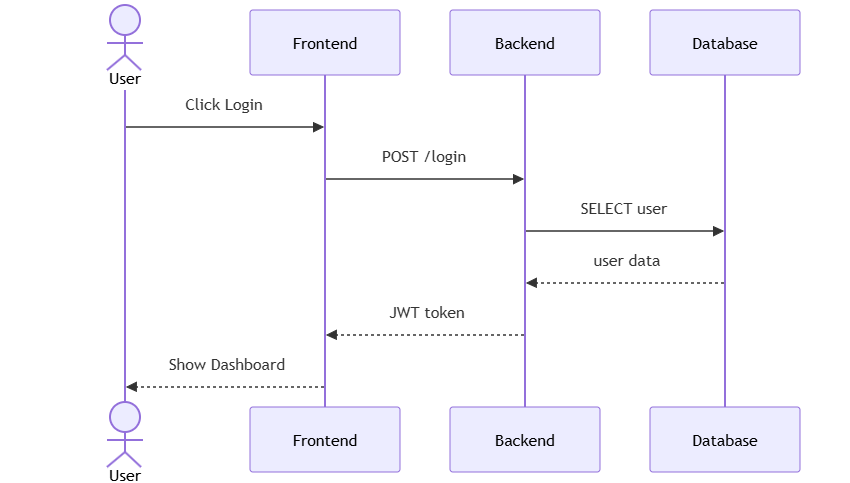
sequenceDiagram
    actor User
    participant Frontend
    participant Backend
    participant Database

    User->>Frontend: Click Login
    Frontend->>Backend: POST /login
    Backend->>Database: SELECT user
    Database-->>Backend: user data
    Backend-->>Frontend: JWT token
    Frontend-->>User: Show Dashboard
Interactive Chatbot Integration
Some platforms now offer chatbot interfaces for diagram creation. You can have a conversation:
User: “Add a new service called ‘Inventory Service’ to my architecture diagram.”
AI: “I’ll add an Inventory Service connected to your existing Product and Order services.”
Diagram updates automatically
User: “Actually, make it also connect to a new database called ‘InventoryDB’.”
AI: “Done. Inventory Service now connects to Product Service, Order Service, and the new InventoryDB.”
Integrating Diagram as Code into Your Workflow
Step 1: Start Small
Don’t try to diagram your entire system at once. Start with a single component—perhaps your authentication flow or a new feature you’re building.
Step 2: Embed in Documentation
Keep your .mermaid files alongside your documentation (e.g., in a /docs folder). Use tools like mermaid-cli to render them during the build process.
Step 3: Leverage VPasCode’s Unified Engine
If you’re working in a team with diverse preferences, VPasCode is invaluable. It supports multiple diagram-as-code languages in one place:
# In VPasCode, you can mix and match:
diagrams/
  ├── architecture.mermaid
  ├── deployment.puml      # PlantUML
  ├── database-erd.mermaid
  └── workflow.d2          # D2 language
Step 4: Automate with CI/CD
Add a step to your GitHub Actions or GitLab CI:
- name: Render Mermaid Diagrams
  run: |
    for file in $(find docs -name "*.mermaid"); do
      npx @mermaid-js/mermaid-cli -i $file -o ${file%.mermaid}.png
    done

- name: Upload to Documentation Site
  run: |
    aws s3 sync docs/ s3://your-docs-bucket/
Step 5: Review in Pull Requests
Make it a policy that all architecture changes require diagram updates. Use PR comments to discuss visual changes:
Reviewer: “Shouldn’t the cache sit between the Order Service and the Database? Currently it’s only attached to User Service.”
Author: “Good catch. I’ll update the diagram.”
Real-World Impact: A Case Study
Consider a fintech startup that adopted Diagram as Code with Mermaid and VPasCode:
-
Before: 47 static Visio files, most over 6 months old. New hires spent 3 weeks understanding the architecture.
-
After: 12 Mermaid diagrams, all stored in Git, updated with every feature. New hires were productive in week 1.
The team’s CTO noted: “We went from diagrams being a compliance checkbox to being a living part of our development process. When we debate a new architecture, we open the Mermaid editor and literally sketch it out in code. It’s a game-changer.”
The Future: Continuous Documentation
The ultimate goal is “continuous documentation,” where diagrams are generated automatically from your infrastructure or code. Tools are already emerging that can:
-
Scan your Kubernetes manifests and generate service topology diagrams
-
Parse OpenAPI/Swagger files and create API flow diagrams
-
Monitor your cloud resources and auto-update architecture diagrams
Mermaid is at the center of this movement, providing a simple, text-based format that machines can generate and humans can understand.
Getting Started Today
Ready to move beyond static images? Here’s your action plan:
-
Install the Mermaid extension in your favorite IDE (VS Code, IntelliJ)
-
Create your first diagram in a
.mdfile using Mermaid’s syntax -
Explore VPasCode’s free tier to experience AI-powered diagramming
-
Start a living documentation repository alongside your codebase
-
Share this article with your team and start the conversation
Your architecture deserves better than a dusty diagram in a forgotten folder. It’s time to treat your diagrams like the critical assets they are.