




From Code to Clarity: A Beginner’s Guide to Seamless Diagramming with VPasCode and OpenDocs
This guide is designed to walk you through the complete workflow of creating professional diagrams using Mermaid syntax in VPasCode and seamlessly publishing them to your knowledge base in OpenDocs. We’ll cover the entire pipeline from setup to publishing, with realistic, ready-to-use examples.
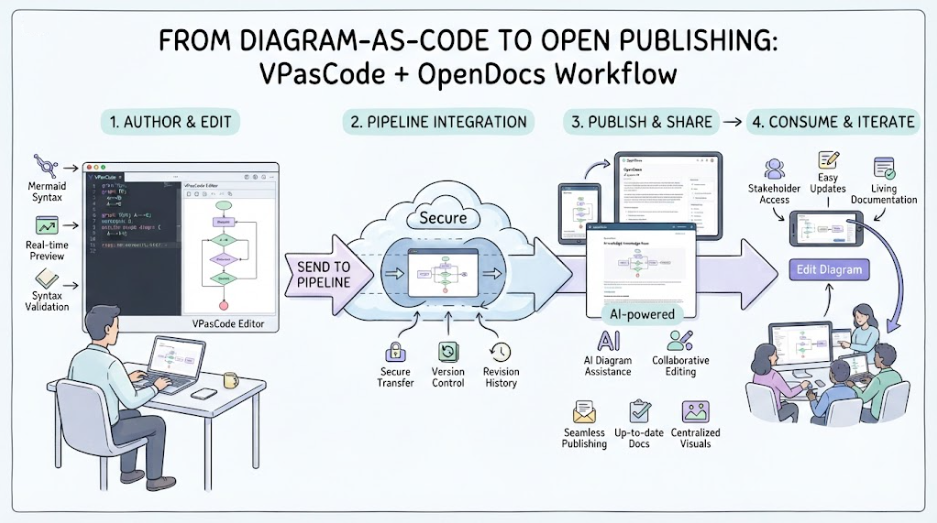
Why This Workflow Matters
Documentation in software development often lags behind code. Engineers spend hours crafting complex system architectures, while technical writers struggle to keep visuals updated in static documents. The result? Outdated diagrams, broken links, and a knowledge base that doesn’t reflect reality .
VPasCode and OpenDocs solve this problem. VPasCode allows you to create professional diagrams using simple text syntax (like Mermaid), while OpenDocs serves as an AI-powered knowledge management platform. The magic happens when you connect them: with the VPasCode to OpenDocs Pipeline Integration, you can send diagrams directly from your code editor into your documentation with a single click. No more exporting, downloading, or re-uploading .
Setup & Tooling
Getting Started
Before diving into diagram creation, ensure you have access to the necessary tools:
-
VPasCode: An interactive, browser-based Diagram-as-Code (DaC) playground and editor. It supports Mermaid.js, PlantUML, and Graphviz in a unified interface .
-
OpenDocs: A web-based knowledge management platform specifically engineered to be “diagram-aware” .
-
Visual Paradigm Account: While free tiers offer real-time previewing and exports, paid editions unlock advanced AI features like error fixing and translation .
Understanding VPasCode’s Interface
VPasCode features a responsive two-column layout that balances code authoring with immediate visual feedback :
-
Left Panel: Code Editor – Contains syntax highlighting, engine selector, and real-time error counting .
-
Right Panel: Visual Preview – Instantly renders your diagram as you type.
-
Status Bar: Shows real-time syntax validation and error counts .
Connecting the Pipeline
The integration is built-in, so no complex API keys are required. Simply log in to both platforms with the same Visual Paradigm credentials . When you’re ready to share a diagram, the “Send to OpenDocs Pipeline” button in VPasCode securely routes your visual to your OpenDocs workspace .
The Pipeline acts as the secure, cloud-based central repository for all your visual assets. It tracks asset versions, maintains revision history, and captures user comments—all without requiring manual file saving .
Practical Mermaid Examples
Let’s explore how to create real-world diagrams using Mermaid syntax in VPasCode.
Example 1: User Authentication Flowchart
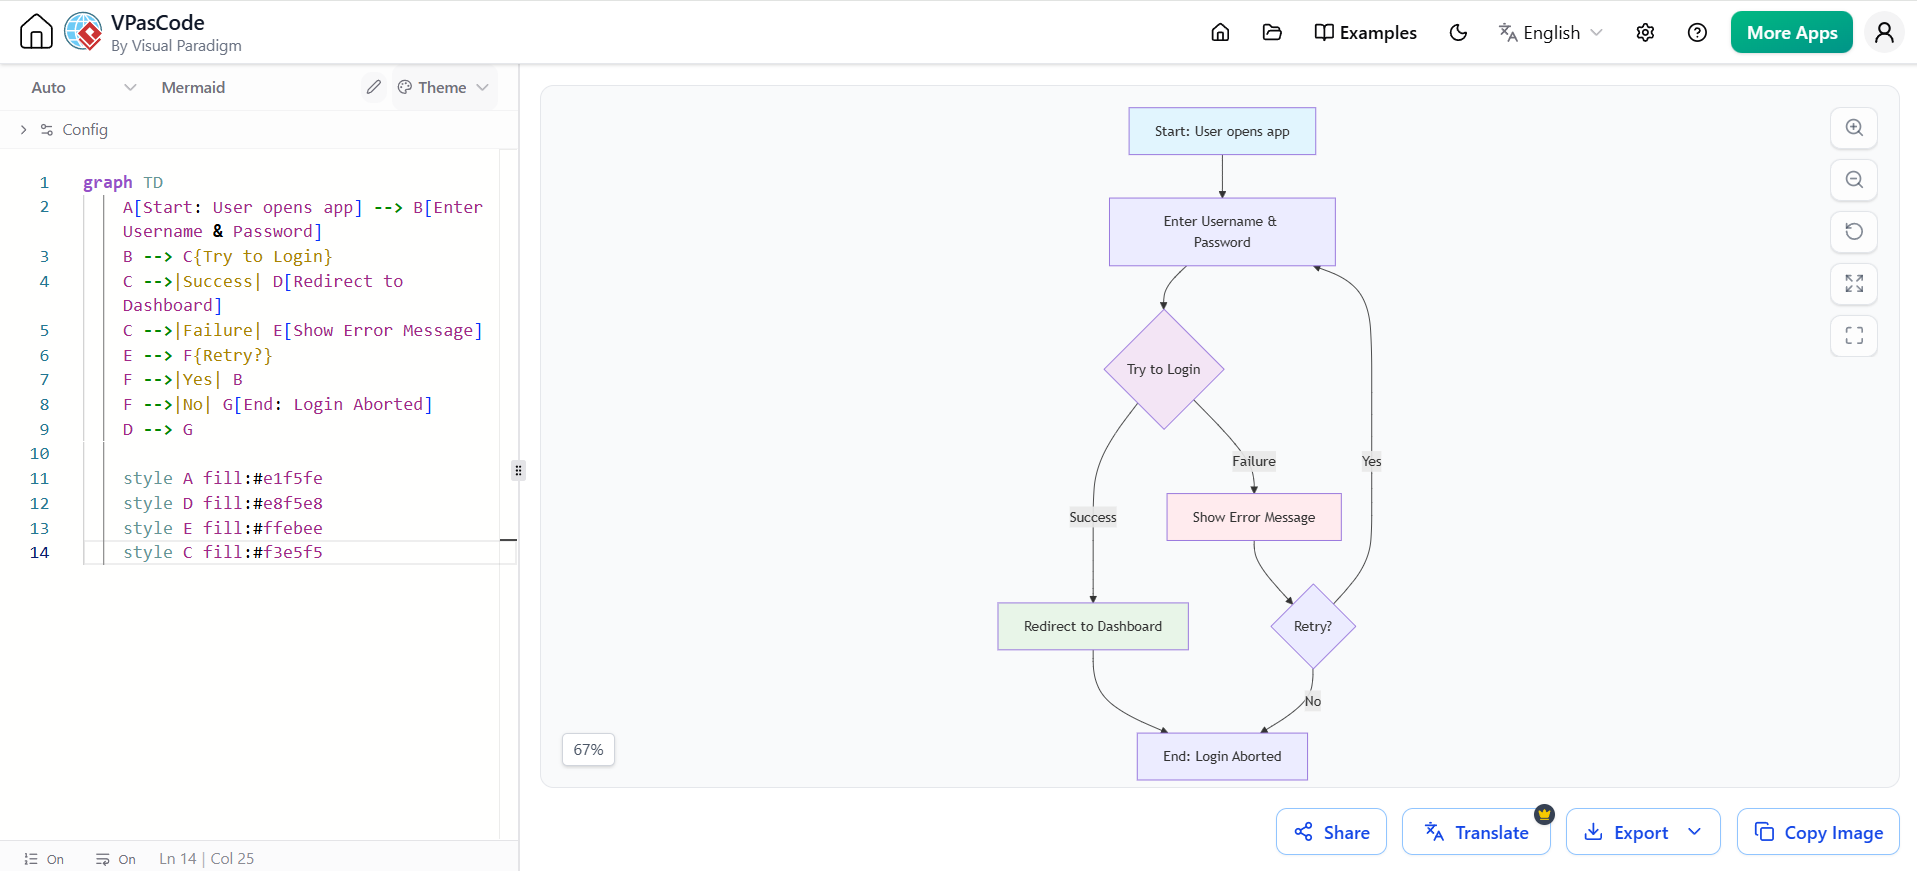
This example shows a basic login process using a flowchart. Flowcharts are ideal for documenting business logic, user journeys, and process flows .
graph TD
    A[Start: User opens app] --> B[Enter Username & Password]
    B --> C{Try to Login}
    C -->|Success| D[Redirect to Dashboard]
    C -->|Failure| E[Show Error Message]
    E --> F{Retry?}
    F -->|Yes| B
    F -->|No| G[End: Login Aborted]
    D --> G

    style A fill:#e1f5fe
    style D fill:#e8f5e8
    style E fill:#ffebee
    style C fill:#f3e5f5
How to use this: Copy this code into VPasCode’s editor, select “Mermaid” as the engine, and watch the flowchart render instantly. Click “Send to OpenDocs Pipeline” to push this diagram directly into your technical specification document .
Example 2: REST API Authentication Sequence Diagram
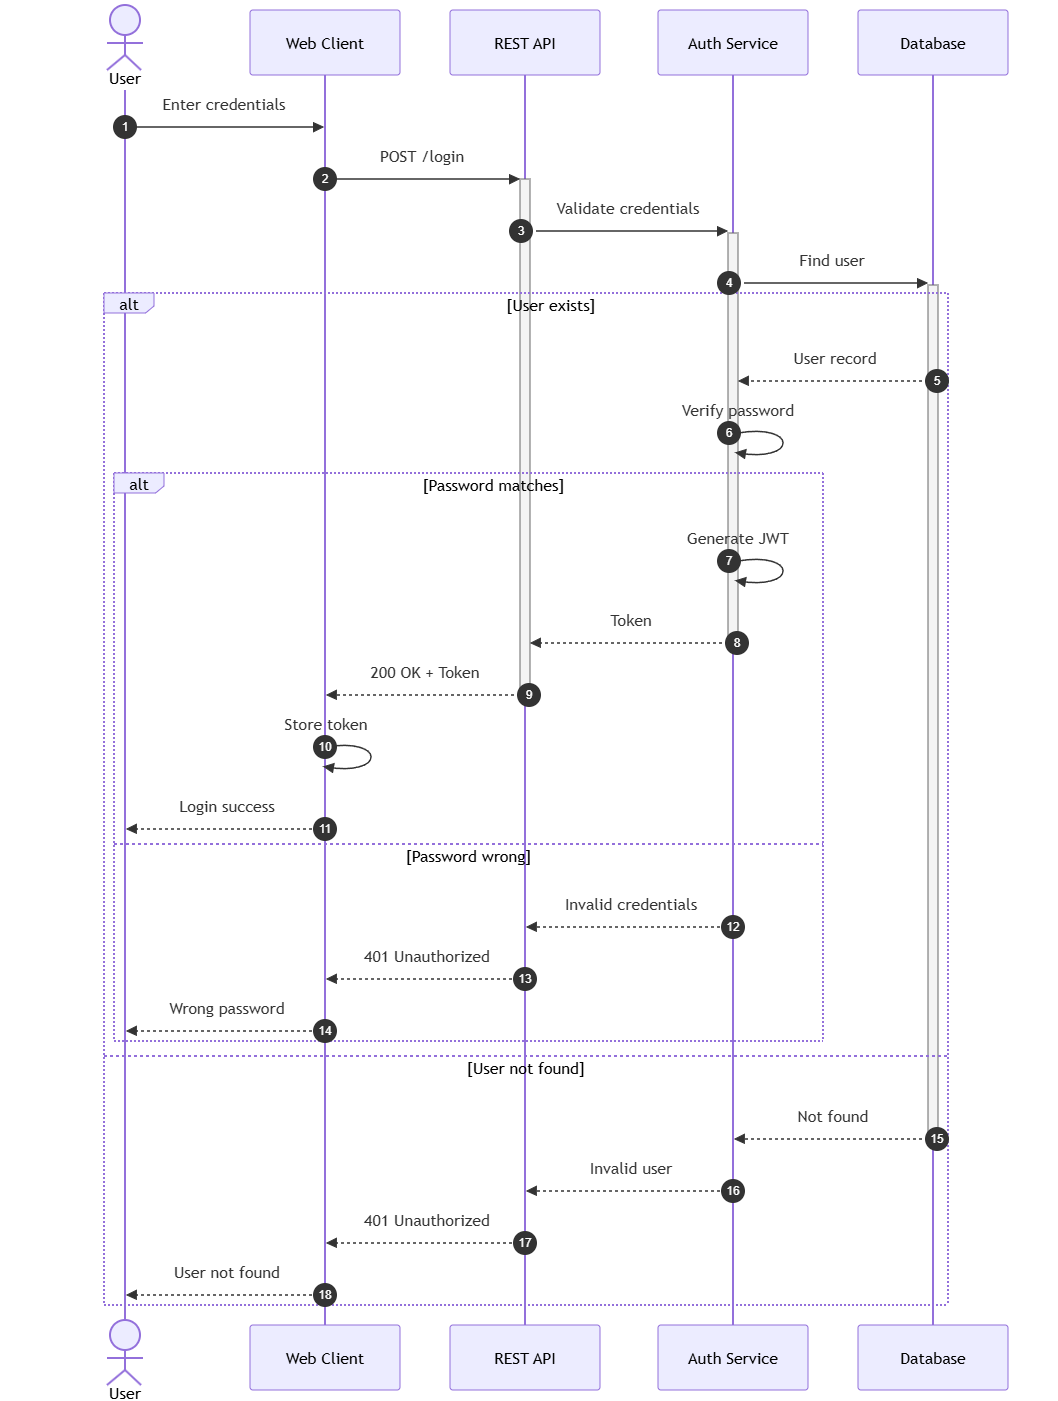
For documenting interactions between system components, sequence diagrams are invaluable. This example shows a complete REST API authentication flow with JWT token generation .
sequenceDiagram
    autonumber

    actor User
    participant Client as Web Client
    participant API as REST API
    participant Auth as Auth Service
    participant DB as Database

    User->>Client: Enter credentials
    Client->>+API: POST /login
    API->>+Auth: Validate credentials
    Auth->>+DB: Find user

    alt User exists
        DB-->>Auth: User record
        Auth->>Auth: Verify password

        alt Password matches
            Auth->>Auth: Generate JWT
            Auth-->>-API: Token
            API-->>-Client: 200 OK + Token
            Client->>Client: Store token
            Client-->>User: Login success
        else Password wrong
            Auth-->>API: Invalid credentials
            API-->>Client: 401 Unauthorized
            Client-->>User: Wrong password
        end
    else User not found
        DB-->>-Auth: Not found
        Auth-->>API: Invalid user
        API-->>Client: 401 Unauthorized
        Client-->>User: User not found
    end
Key features demonstrated:
-
autonumberautomatically numbers each step -
actorandparticipantdefine different types of entities -
altblocks show conditional paths -
+and-symbols indicate activation and deactivation of services
Example 3: C4 Container Diagram for Microservices Architecture
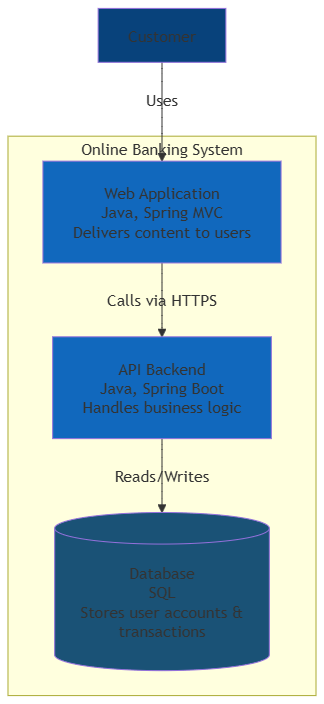
For high-level architecture documentation, the C4 model provides excellent clarity. This example shows a container diagram for an online banking system .
graph TD
    subgraph "Online Banking System"
        WebApp[Web Application<br/>Java, Spring MVC<br/>Delivers content to users]
        API[API Backend<br/>Java, Spring Boot<br/>Handles business logic]
        DB[(Database<br/>SQL<br/>Stores user accounts & transactions)]
    end

    User[Customer] -->|Uses| WebApp
    WebApp -->|Calls via HTTPS| API
    API -->|Reads/Writes| DB

    style User fill:#08427b,color:#fff
    style WebApp fill:#1168bd,color:#fff
    style API fill:#1168bd,color:#fff
    style DB fill:#1a5276,color:#fff
Why this works: This visualization helps stakeholders understand system boundaries without getting bogged down in code details . The subgraph groups related components, and styles make the diagram more professional.
Example 4: Complex OAuth 2.0 Flow
For more advanced authentication scenarios, this example shows the OAuth 2.0 Authorization Code Flow with token refresh .
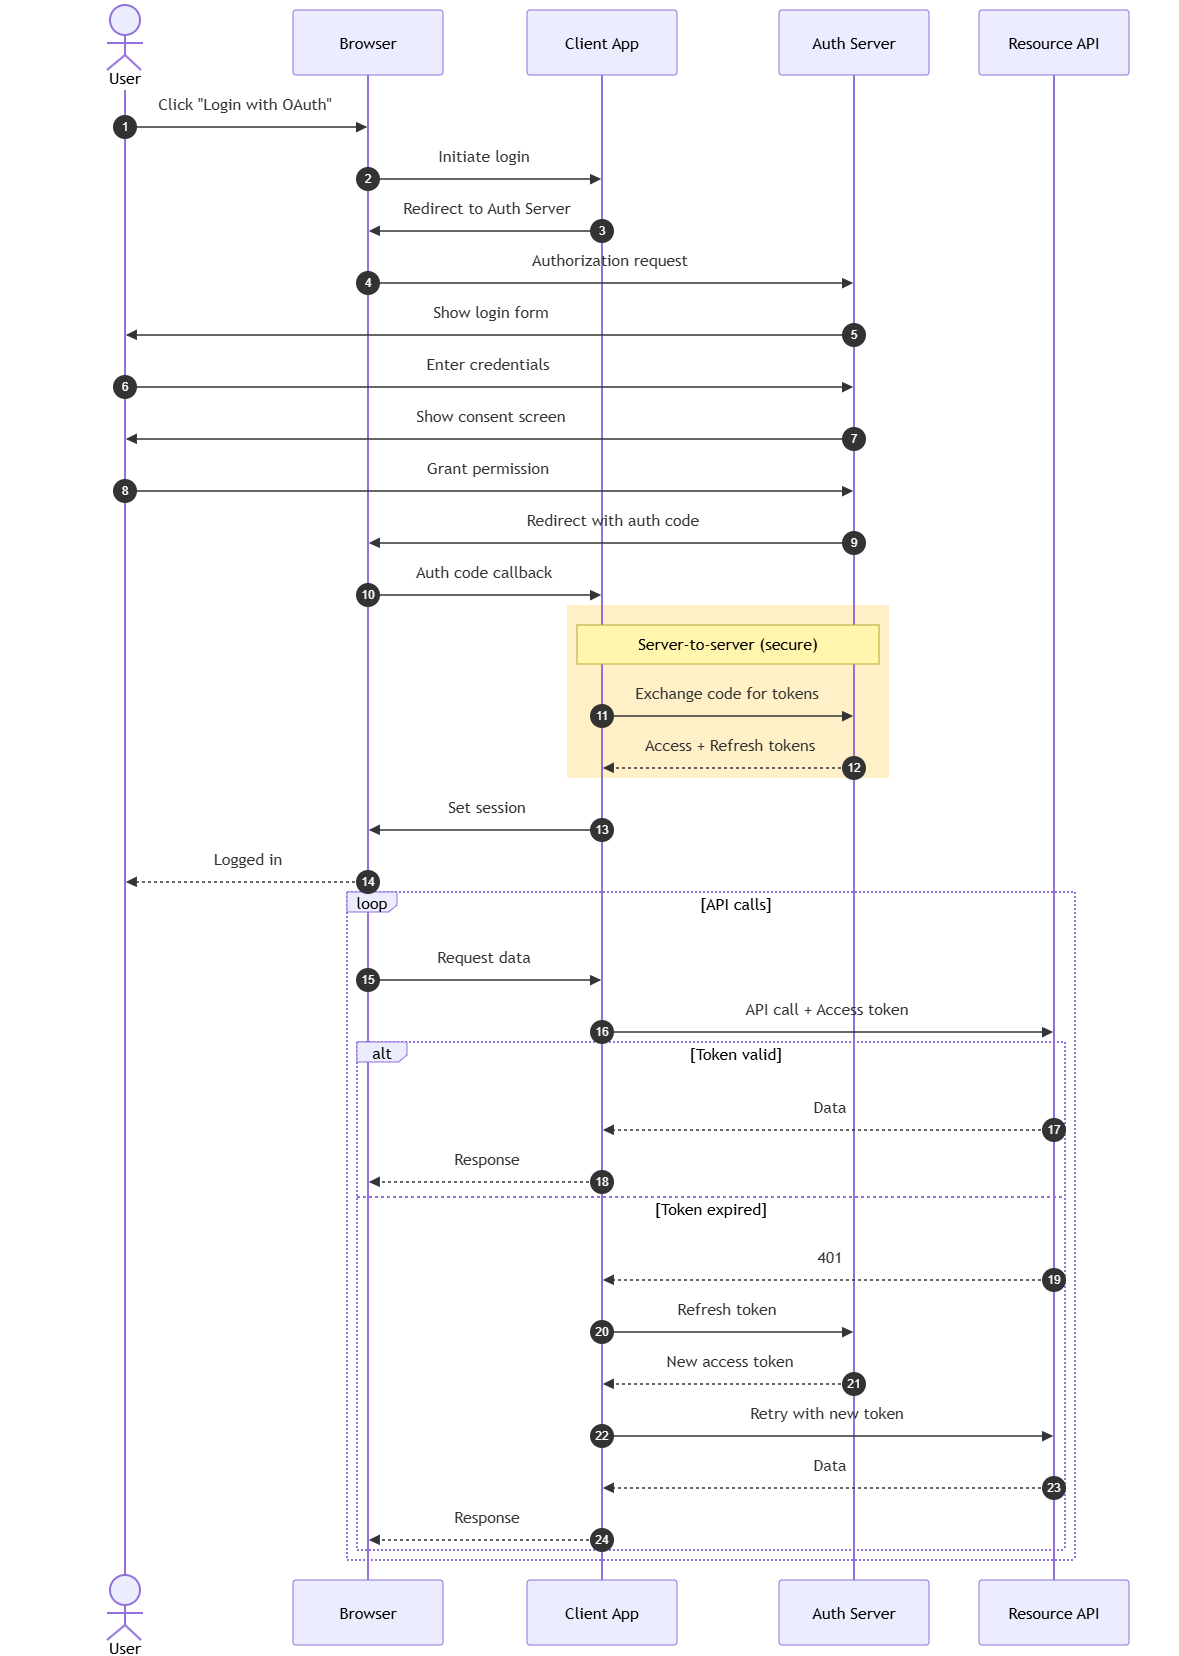
sequenceDiagram
    autonumber

    actor User
    participant Browser
    participant App as Client App
    participant Auth as Auth Server
    participant Resource as Resource API

    User->>Browser: Click "Login with OAuth"
    Browser->>App: Initiate login
    App->>Browser: Redirect to Auth Server
    Browser->>Auth: Authorization request

    Auth->>User: Show login form
    User->>Auth: Enter credentials
    Auth->>User: Show consent screen
    User->>Auth: Grant permission

    Auth->>Browser: Redirect with auth code
    Browser->>App: Auth code callback

    rect rgb(255, 240, 200)
        Note over App,Auth: Server-to-server (secure)
        App->>Auth: Exchange code for tokens
        Auth-->>App: Access + Refresh tokens
    end

    App->>Browser: Set session
    Browser-->>User: Logged in

    loop API calls
        Browser->>App: Request data
        App->>Resource: API call + Access token

        alt Token valid
            Resource-->>App: Data
            App-->>Browser: Response
        else Token expired
            Resource-->>App: 401
            App->>Auth: Refresh token
            Auth-->>App: New access token
            App->>Resource: Retry with new token
            Resource-->>App: Data
            App-->>Browser: Response
        end
    end
Advanced features demonstrated:
-
rectcreates a highlighted section with custom background color -
Note overadds explanatory text -
loopshows repetitive interactions -
altblocks handle error conditions
Example 5: Decision Flow with Subgraphs
For complex workflows with multiple phases, using subgraphs organizes the diagram logically .
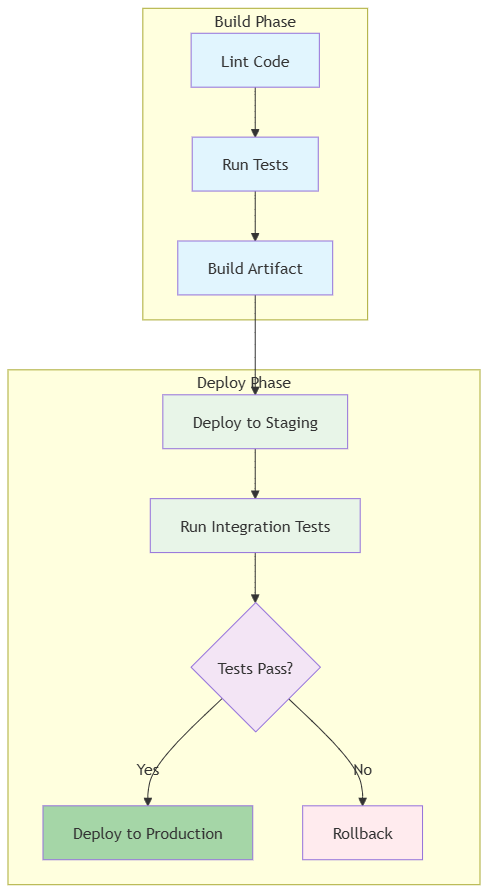
graph TD
    subgraph "Build Phase"
        A[Lint Code] --> B[Run Tests] --> C[Build Artifact]
    end

    subgraph "Deploy Phase"
        D[Deploy to Staging] --> E[Run Integration Tests]
        E --> F{Tests Pass?}
        F -->|Yes| G[Deploy to Production]
        F -->|No| H[Rollback]
    end

    C --> D

    style A fill:#e1f5fe
    style B fill:#e1f5fe
    style C fill:#e1f5fe
    style D fill:#e8f5e8
    style E fill:#e8f5e8
    style F fill:#f3e5f5
    style G fill:#a5d6a7
    style H fill:#ffebee
Best practice: For workflows with 5+ jobs, use subgraphs to group related steps .
Publishing to OpenDocs Through the Pipeline
Once your diagram is ready, publishing is a one-click process:
-
Send to Pipeline: In VPasCode, click “Send to OpenDocs Pipeline” .
-
Optional Comment: Add context like “v2.1 – Updated authentication flow” to help identify the version .
-
OpenDocs Insertion: In OpenDocs, edit your document, click Insert > Pipeline, and select your diagram from the asset list .
The Pipeline eliminates the friction of manual downloads and uploads. It preserves the editability of your models and ensures every stakeholder is looking at the most recent revision of a design .
AI-Powered Features
Visual Paradigm’s AI capabilities take diagramming to the next level :
Prompt-to-Diagram: In OpenDocs, use the AI chatbot to generate a diagram from natural language. For example, type “Create a sequence diagram for a payment processing flow” and the AI will generate the code, which you can then refine in VPasCode .
AI Code Error Fixing: Made a syntax mistake? The AI can detect and suggest fixes .
AI Translation: Need to localize documentation? Use AI to translate diagram labels into multiple languages .
Best Practices & Tips
To maximize efficiency, follow these best practices :
-
Use Descriptive Titles: Add titles to your diagrams for clarity in documentation.
-
Leverage the Pipeline Pane: In OpenDocs, use the Pipeline pane to organize sent diagrams.
-
Iterate with the Pencil Button: If a diagram needs updates, click the pencil icon in OpenDocs to reopen it in VPasCode. Make changes, resend, and replace the old version seamlessly.
-
Keep Diagrams Version-Controlled: Since diagrams are code-based, you can track changes in Git, making it easy to revert or compare versions .
Conclusion
The integration of VPasCode and OpenDocs represents a significant leap forward in technical documentation. By treating diagrams as code, you gain precision, version control, and ease of updates. The seamless pipeline eliminates manual steps, allowing engineers and writers to focus on content rather than formatting .
Start by experimenting with simple Mermaid diagrams in VPasCode and sending them to OpenDocs. As you grow comfortable, explore AI features and integrate with the broader Visual Paradigm ecosystem. With this workflow, your documentation will no longer be an afterthought—it will be a living, breathing part of your development process .
This post is also available in Deutsche, Español, فارسی, Français, English, 日本語, Polski, Portuguese, Ру́сский and 简体中文.
Related posts:
 VPasCode Deep Dive: Unifying Mermaid, PlantUML, and AI in One Platform
 From Static Snapshots to Living Knowledge: Unifying Documentation and Modeling with Visual Paradigm OpenDocs
 Beyond Pretty Pictures: A Modern Guide to Analysis and Design with AI, Diagram-as-Code, and Visual Paradigm
Mastering Apache ECharts in Visual Paradigm: From AI Prompt to Final Asset
Beyond Pretty Pictures: A Modern Guide to Analysis and Design with AI, Diagram-as-Code, and Visual Paradigm
Mastering Apache ECharts in Visual Paradigm: From AI Prompt to Final Asset
