



A practical guide to PERT charts in PlantUML
Introduction
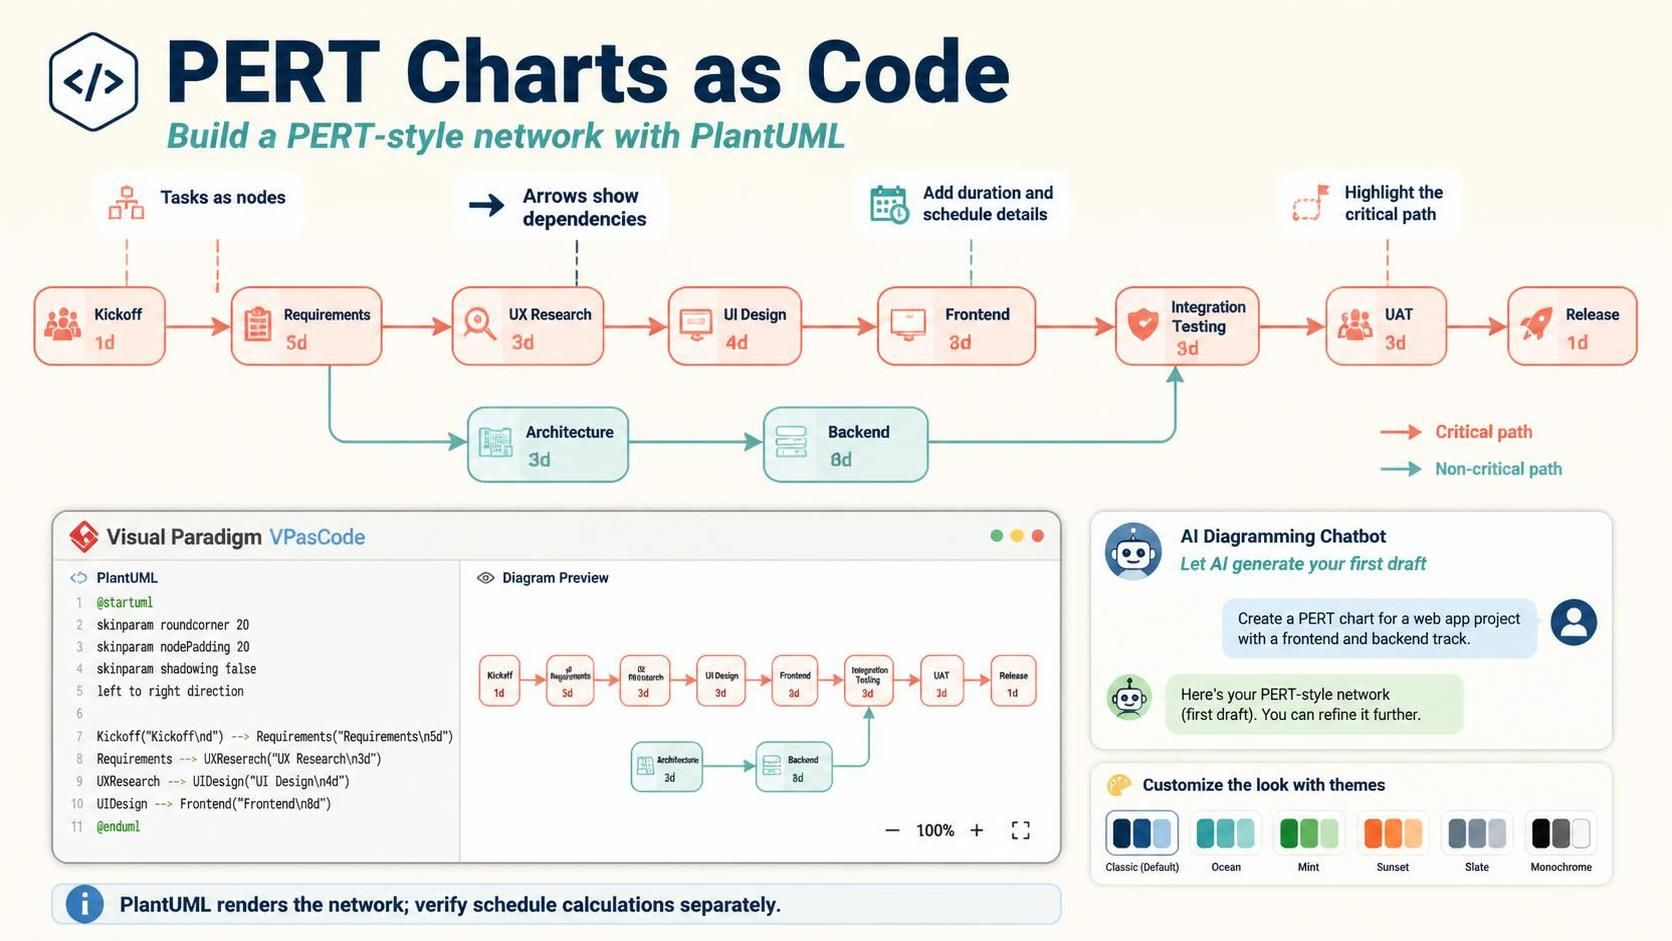
PERT charts help teams visualize project activities, dependencies, and the sequence of work that determines a project’s duration. Although PlantUML has no dedicated @startpert command, you can create a PERT-style network with PlantUML syntax by representing tasks as nodes and connecting them with dependency arrows. This guide explains how to build that diagram, add schedule details, highlight the critical path, and use Visual Paradigm’s VPasCode and AI Diagramming Chatbot to draft and refine the result.

PlantUML – Pert Chart as Code
PlantUML does not use an @startpert command, but it does document a way to create PERT diagrams using map elements inside an ordinary @startuml block. You can also use object-diagram syntax to make an activity-on-node chart with task details inside each node. Both approaches use text and arrows; neither automatically calculates the schedule or critical path.
Choose a representation
A PERT chart shows activities and their dependencies. Decide what each node will represent before writing code:
-
Map-based PERT: Use PlantUML’s documented
mapexample to make a PERT-style network. It is a good fit for a compact diagram, though its example uses simpleStartandEndentries. -
Object-based activity network: Use
objectnodes when you want task names, durations, and schedule fields displayed inside each node. PlantUML supports object declarations, fields, and relationships between objects.
The example below uses the second approach because it puts useful schedule information directly on each task.
Start with a task list
Before diagramming, record the work, duration, and immediate predecessors for every activity. A predecessor is a task that must finish before another can begin.
For the mobile banking example:
| Activity | Duration | Immediate predecessor(s) |
|---|---|---|
| Requirements | 5 days | Project Kickoff |
| UX Research | 7 days | Requirements |
| Solution Architecture | 6 days | Requirements |
| UI Design | 8 days | UX Research |
| Backend Development | 15 days | Solution Architecture |
| Frontend Development | 12 days | UI Design |
| Integration Testing | 8 days | Backend Development, Frontend Development |
| Security Audit | 5 days | Integration Testing |
| UAT | 7 days | Integration Testing, Security Audit |
| Release Preparation | 4 days | UAT |
The dependencies matter as much as the durations. If a task requires two predecessors, it cannot start until both are complete.
Calculate the schedule
PlantUML lays out the diagram, but you calculate the dates yourself. For a basic forward pass:
-
Early Start (ES): the latest Early Finish among a task’s predecessors.
-
Early Finish (EF): Early Start plus task duration.
For example, UI Design follows UX Research. UX Research finishes on day 12, so UI Design starts on day 12 and finishes on day 20.
For the integration branch, Backend Development finishes on day 27 and Frontend Development finishes on day 32. Integration Testing depends on both, so it starts on day 32 and finishes on day 40.
This schedule assumes day zero is the project start and treats each activity as a duration in the same units. Use a consistent convention for whether a finish on day 5 means the next activity may start on day 5 or day 6.
Write the diagram
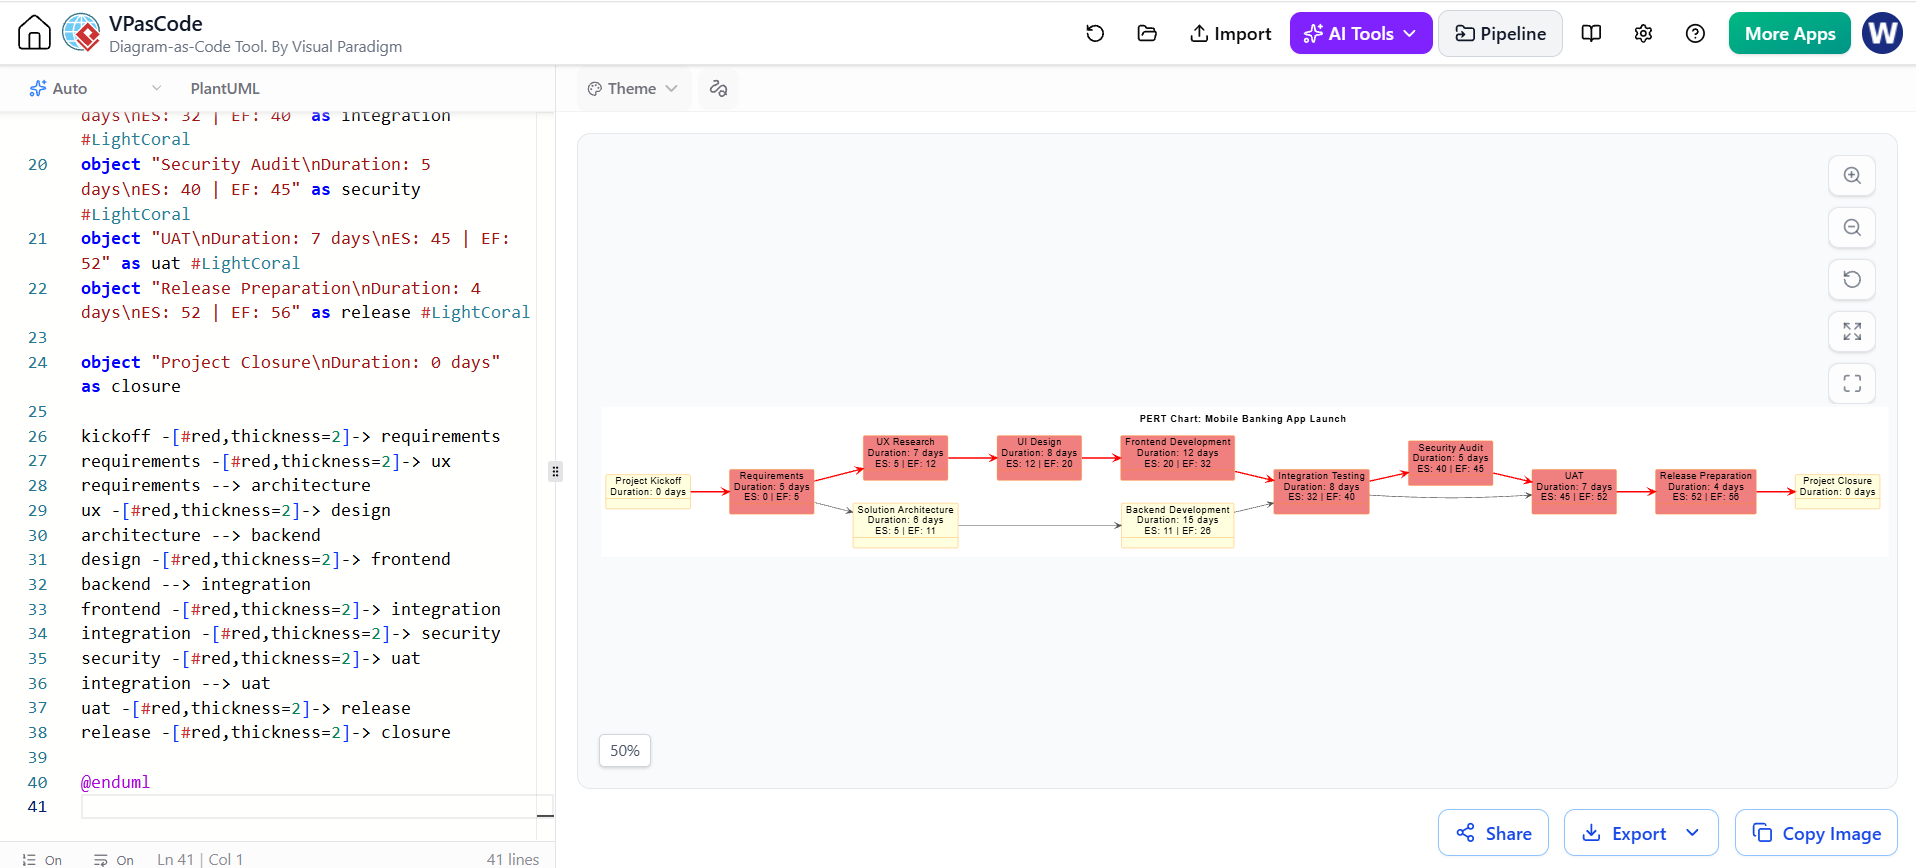
The following code presents the schedule values in task labels. Red arrows highlight one critical path; the red-filled nodes mark the activities on that path.
Diagram Rendered in VPasCode in PlantUML for the PERT Chart
@startuml
left to right direction
title PERT Chart: Mobile Banking App Launch

skinparam object {
  BackgroundColor LightYellow
  BorderColor DarkOrange
}
skinparam ArrowColor #555555

object "Project Kickoff\nDuration: 0 days" as kickoff

object "Requirements\nDuration: 5 days\nES: 0 | EF: 5" as requirements #LightCoral
object "UX Research\nDuration: 7 days\nES: 5 | EF: 12" as ux #LightCoral
object "Solution Architecture\nDuration: 6 days\nES: 5 | EF: 11" as architecture
object "UI Design\nDuration: 8 days\nES: 12 | EF: 20" as design #LightCoral
object "Backend Development\nDuration: 15 days\nES: 11 | EF: 26" as backend
object "Frontend Development\nDuration: 12 days\nES: 20 | EF: 32" as frontend #LightCoral
object "Integration Testing\nDuration: 8 days\nES: 32 | EF: 40" as integration #LightCoral
object "Security Audit\nDuration: 5 days\nES: 40 | EF: 45" as security #LightCoral
object "UAT\nDuration: 7 days\nES: 45 | EF: 52" as uat #LightCoral
object "Release Preparation\nDuration: 4 days\nES: 52 | EF: 56" as release #LightCoral

object "Project Closure\nDuration: 0 days" as closure

kickoff -[#red,thickness=2]-> requirements
requirements -[#red,thickness=2]-> ux
requirements --> architecture
ux -[#red,thickness=2]-> design
architecture --> backend
design -[#red,thickness=2]-> frontend
backend --> integration
frontend -[#red,thickness=2]-> integration
integration -[#red,thickness=2]-> security
security -[#red,thickness=2]-> uat
integration --> uat
uat -[#red,thickness=2]-> release
release -[#red,thickness=2]-> closure

@enduml
This version follows the dependencies in the task list: UAT waits for both Integration Testing and Security Audit, so it cannot begin until Security Audit finishes. That makes the critical path Requirements → UX Research → UI Design → Frontend Development → Integration Testing → Security Audit → UAT → Release Preparation, totaling 56 days.
The red styling is applied manually. If durations or dependencies change, recalculate the schedule and update the labels and highlighting; PlantUML will not update them for you.
Use PlantUML’s map-based PERT form
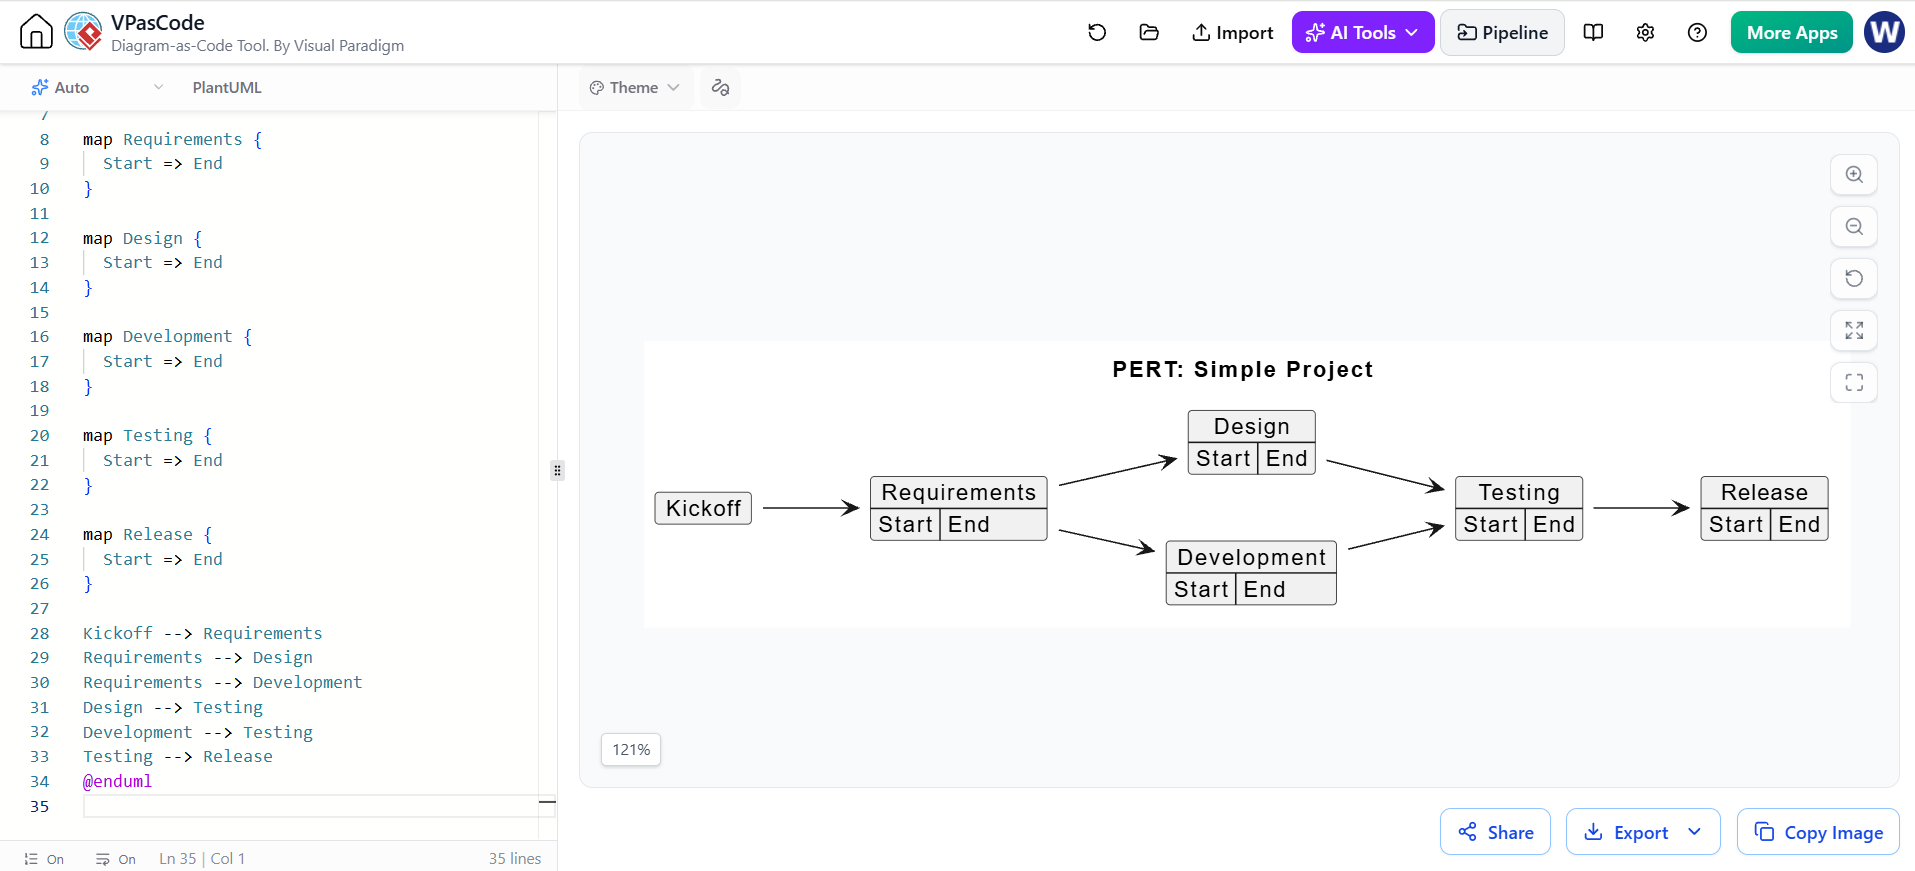
For a simpler network, PlantUML’s documented PERT example uses map elements, with Start and End entries connected by arrows.
@startuml
left to right direction
title PERT: Simple Project

map Kickoff {
}

map Requirements {
  Start => End
}

map Design {
  Start => End
}

map Development {
  Start => End
}

map Testing {
  Start => End
}

map Release {
  Start => End
}

Kickoff --> Requirements
Requirements --> Design
Requirements --> Development
Design --> Testing
Development --> Testing
Testing --> Release
@enduml
Use this when a compact PERT-style network is enough. Use object nodes when you want task metadata to be prominent. You can try either script in a PlantUML renderer or an editor that supports PlantUML preview; Visual Paradigm’s VPasCode is one such text-to-diagram option.
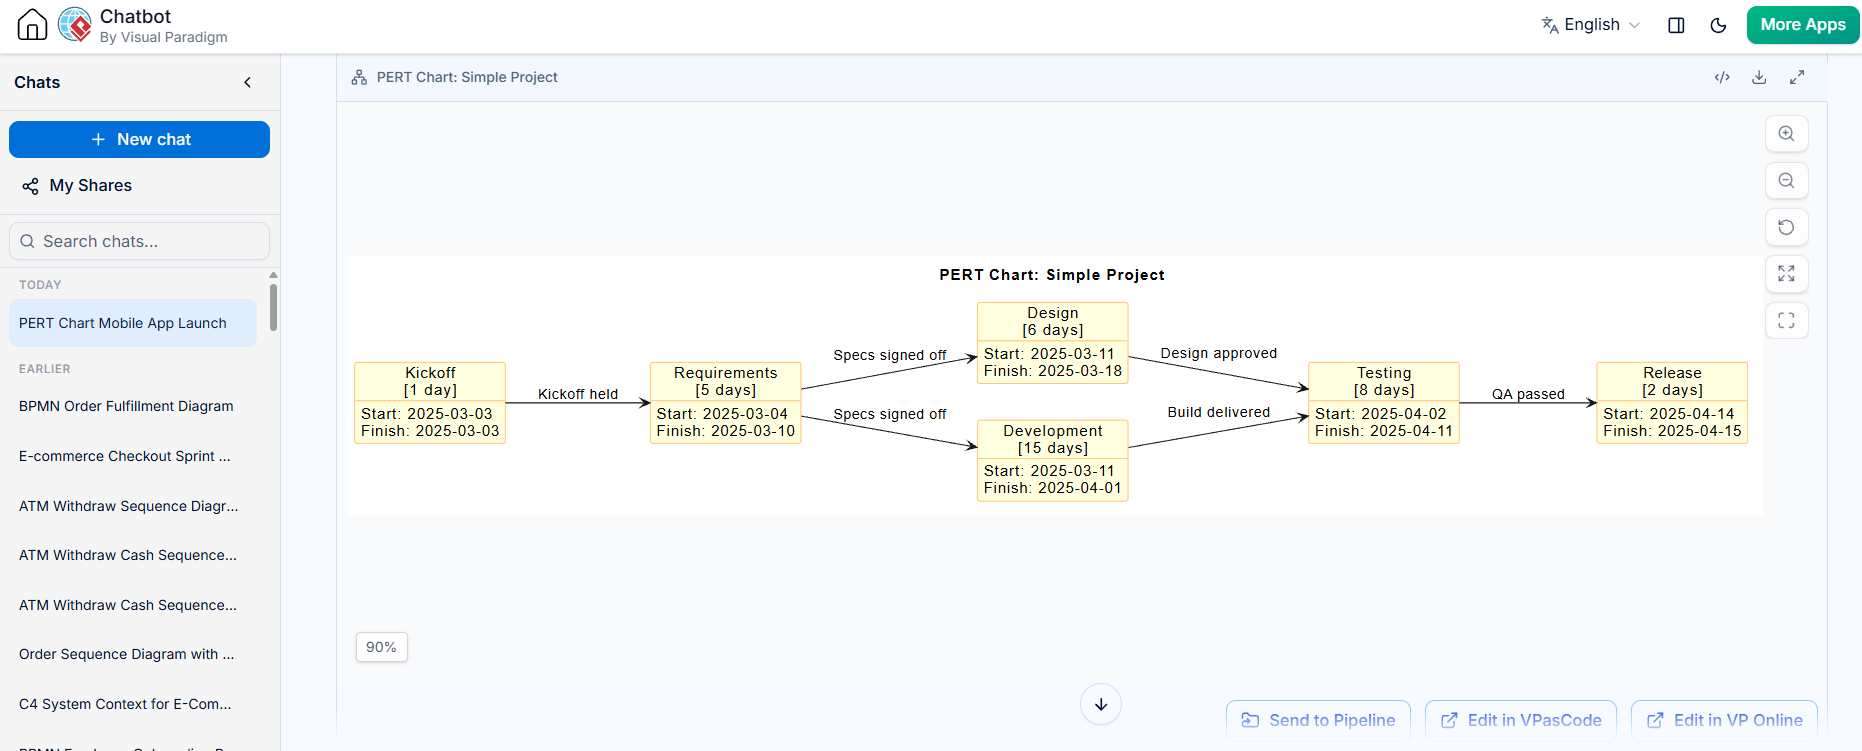
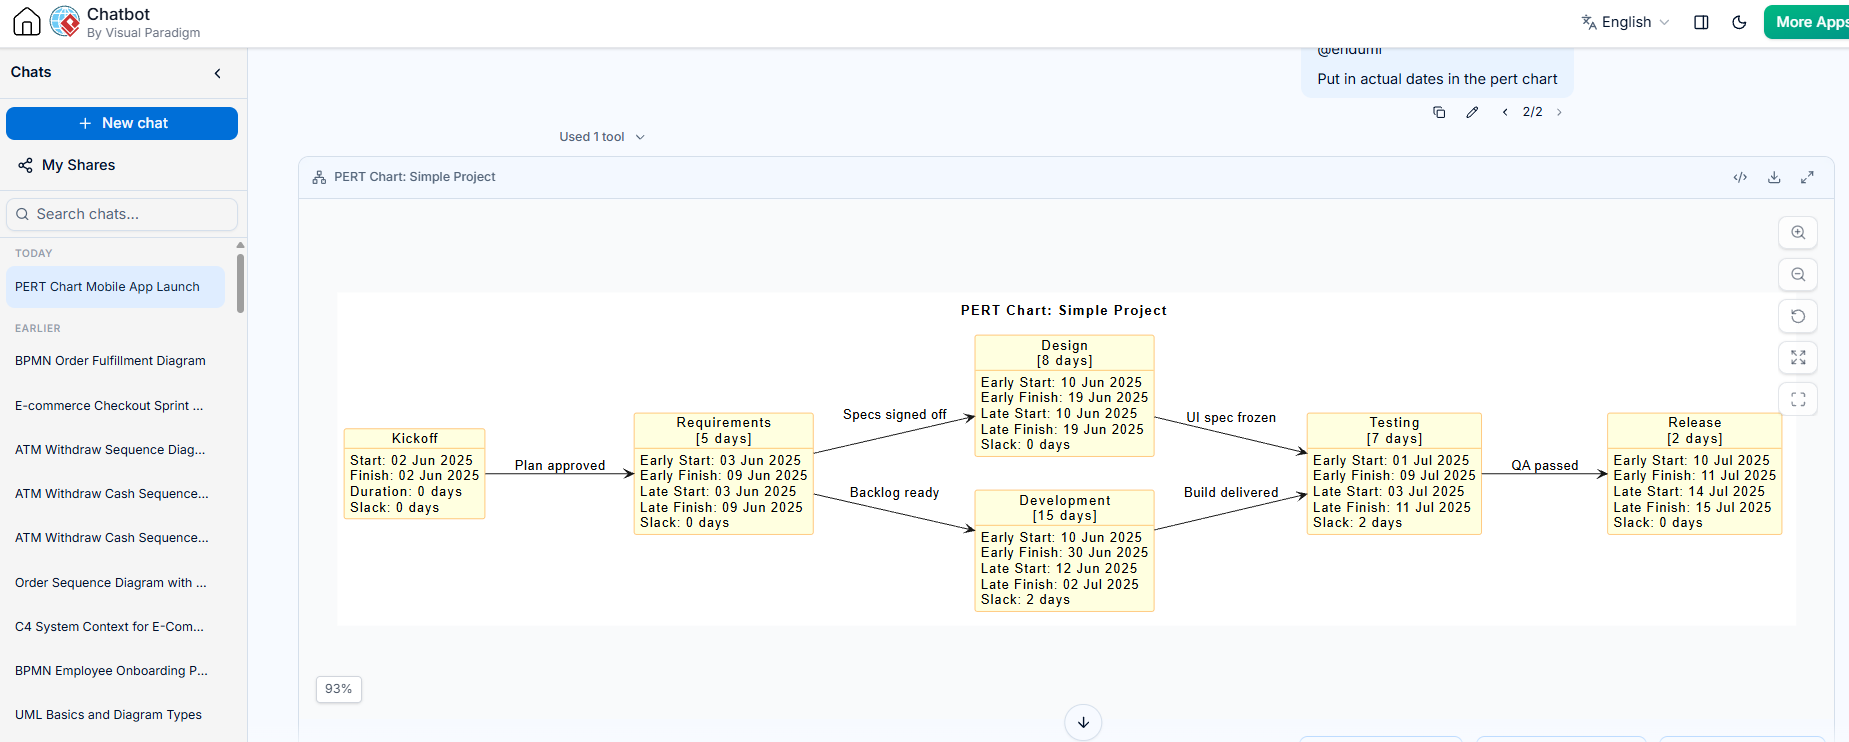
Generate by Visual Paradigm AI Chatbot with beautiful Theme and the actual dates
Add late dates, slack, and critical-path information
The example displays ES and EF, but a fuller schedule may also track:
-
Late Start (LS) and Late Finish (LF): the latest a task can start or finish without delaying the overall project.
-
Slack (float): how long a task can slip without delaying the project.
-
Critical path: the longest-duration path through the dependency network; tasks on it have zero slack under the schedule assumptions.
To calculate these, work backward from the project finish: set the final activity’s LF to the planned project finish, then calculate its LS as LF minus its duration. For each predecessor, use the earliest LS among its immediate successors as its LF. Slack is LS − ES (equivalently, LF − EF). These are manual calculations; PlantUML displays the values you put into the diagram.
You can include the additional values in an object label, for example:
object "UI Design\nDuration: 8 days\nES: 12 | EF: 20\nLS: 12 | LF: 20\nSlack: 0 days" as design
Only add calculated values after checking them against the complete dependency network.
Keep the diagram maintainable
-
Give every node a short, unique alias such as
backendorintegration; use the displayed label for the human-readable task name. -
Draw an arrow from each prerequisite to the activity it enables.
-
Keep duration units consistent, and state the scheduling convention for day counts.
-
Recalculate schedule values after changing any duration or dependency.
-
Use color or line styling consistently and, if needed, add a small legend.
-
For large projects, split the network into phases or sub-diagrams so labels and dependencies remain legible.
A PlantUML PERT chart is best treated as a diagram-as-code representation of a schedule, not a scheduling calculator. Its benefit is that the network and its annotations can be reviewed and revised as text, while the schedule analysis remains explicit and auditable.
Tooling with Visual Paradigm: VPasCode and AI
Visual Paradigm offers two complementary ways to generate and refine a PlantUML-based PERT chart: VPasCode, for editing and previewing diagram code, and the AI Diagramming Chatbot, for generating a first draft from a written description. A useful workflow is to use AI to establish the network, then review and maintain the code in VPasCode. VPasCode runs in a browser and provides a code editor with a live diagram preview.
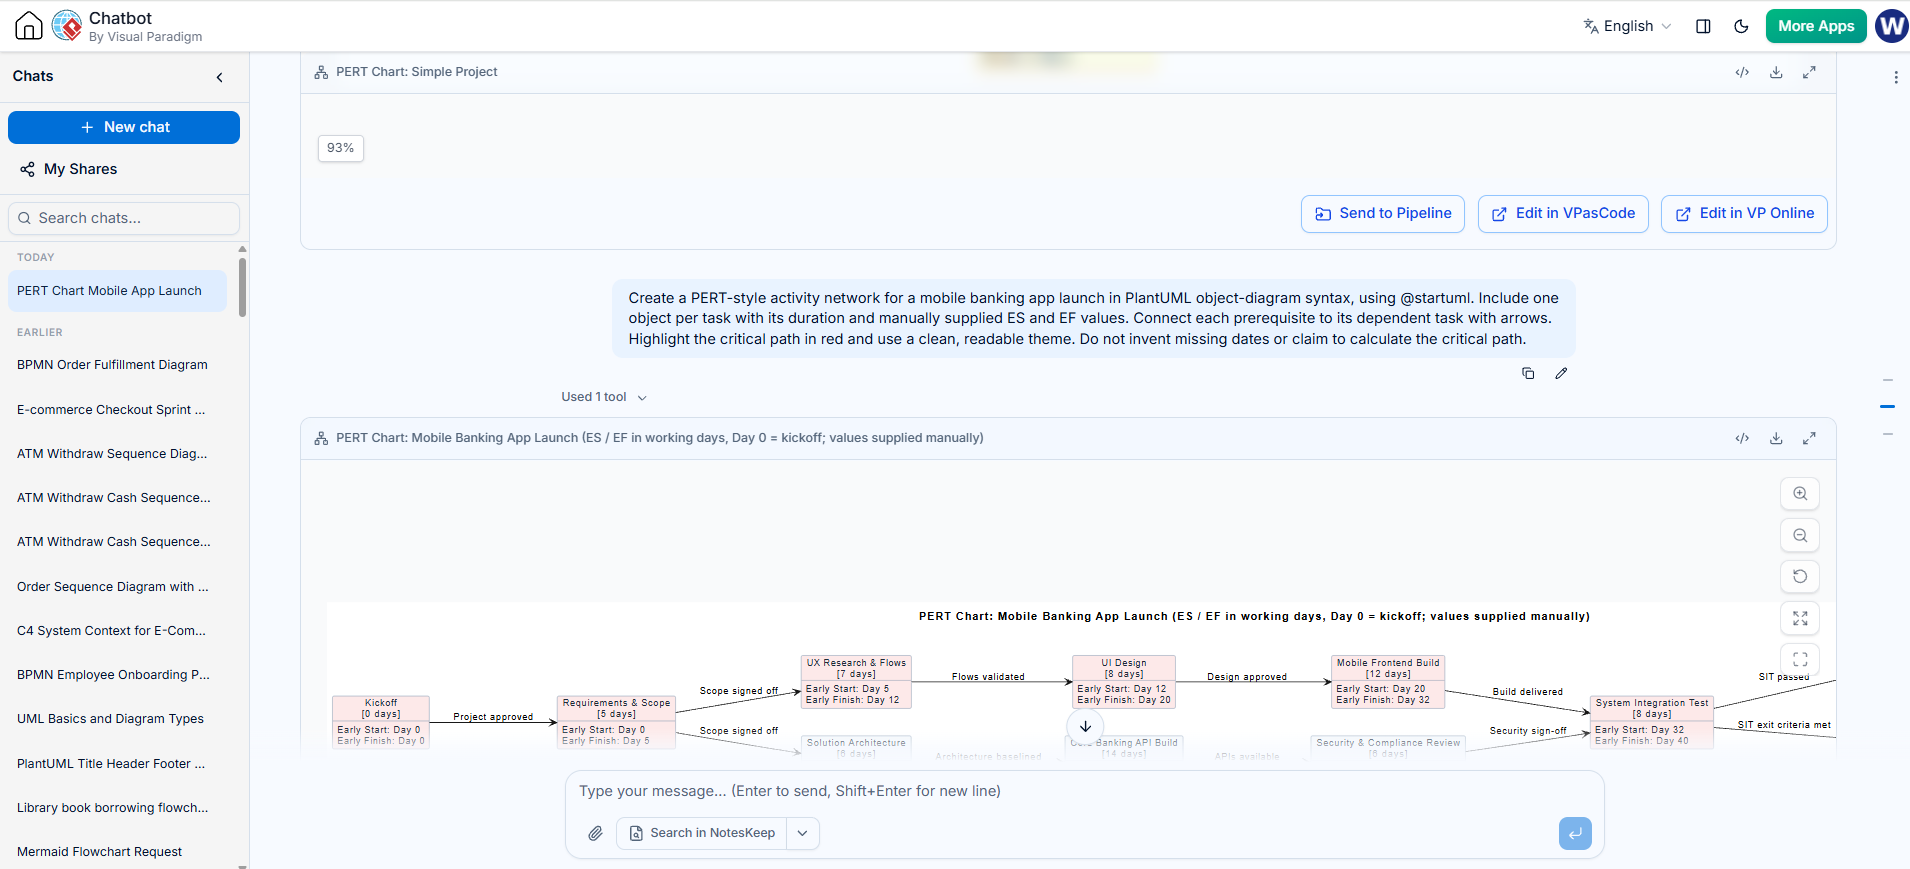
Refine in the VP AI Chatbot:
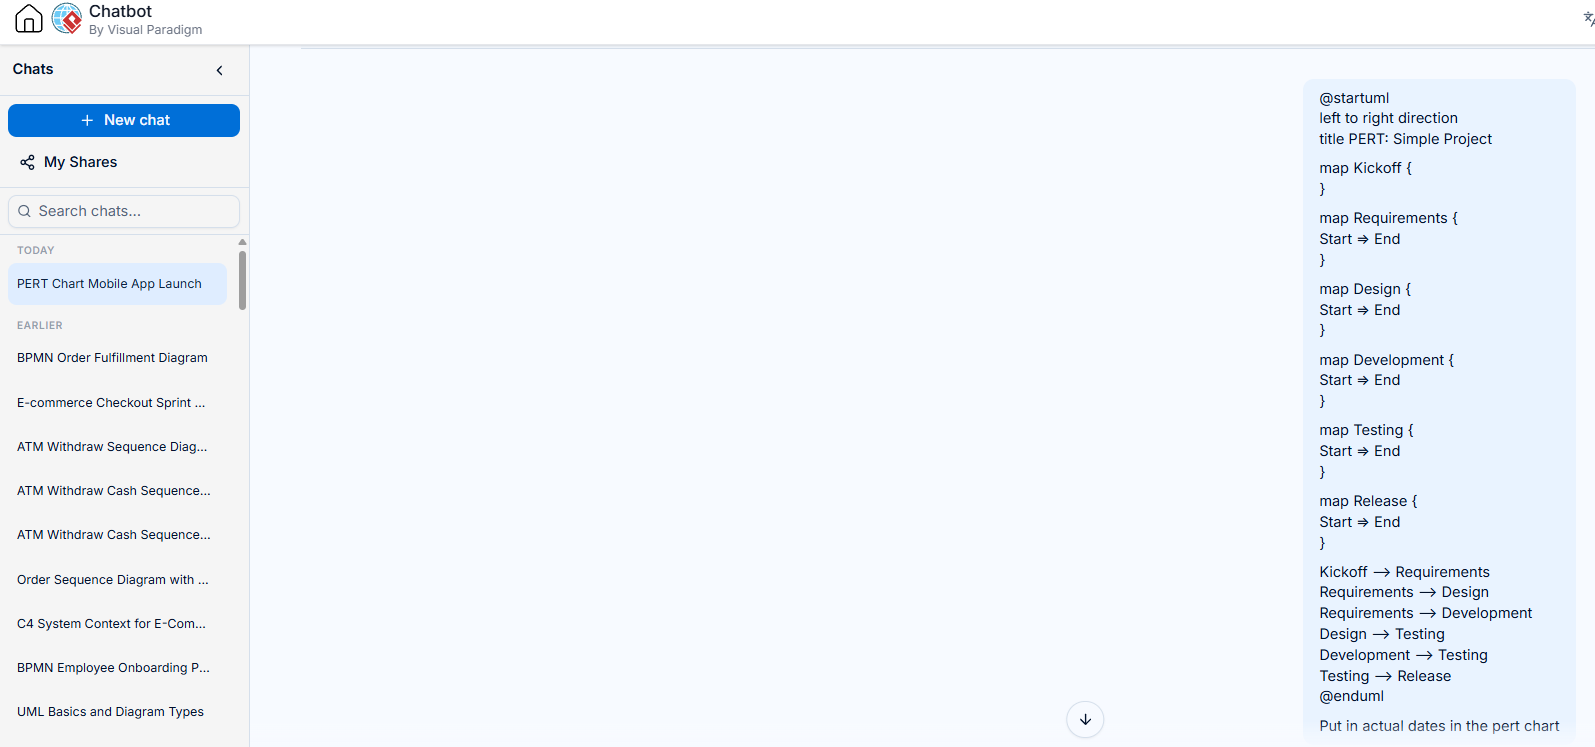
VP AI Chatbot updated Pert Chart
Generate and edit the chart in VPasCode
-
Open Visual Paradigm’s VPasCode workspace and select PlantUML as the diagram language.
-
Paste in the
@startumlPERT-style object diagram, or start with a small example. -
Check the live preview as you work. Add or revise objects for activities, then connect them with arrows to show prerequisites.
-
Put task names, durations, and any manually calculated schedule values in the object labels. For example, include
Duration,ES,EF,LS,LF, orSlackwhere useful.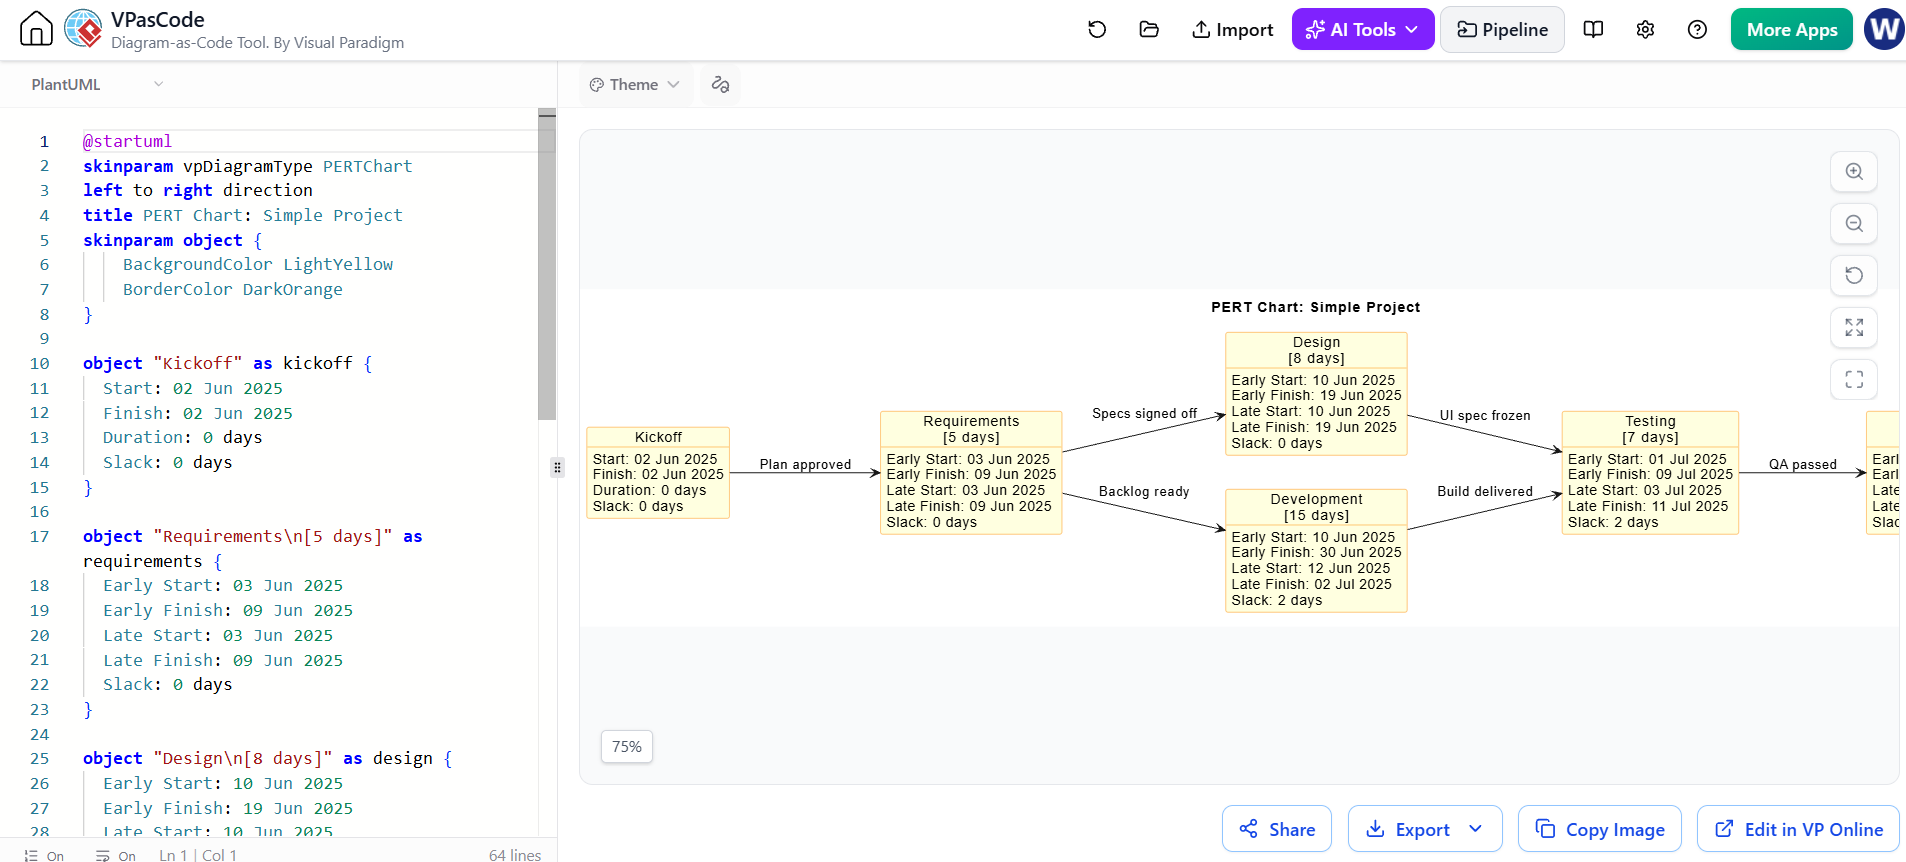
-
Review every dependency and schedule value before sharing the diagram. VPasCode renders the code; it does not calculate PERT dates, slack, or the critical path for you.
VPasCode also offers AI-assisted generation and modification within its editing workflow. You can prompt it to create an initial diagram or request changes to existing code, then inspect the resulting script and preview.
Apply a PlantUML theme
VPasCode’s PlantUML editor includes a theme selector. Choose a theme in the interface to update the script and preview; Visual Paradigm highlights Visual Paradigm and Rose themes among its options. You can also specify a theme directly in PlantUML code using a !theme directive, if the theme is supported by the renderer.
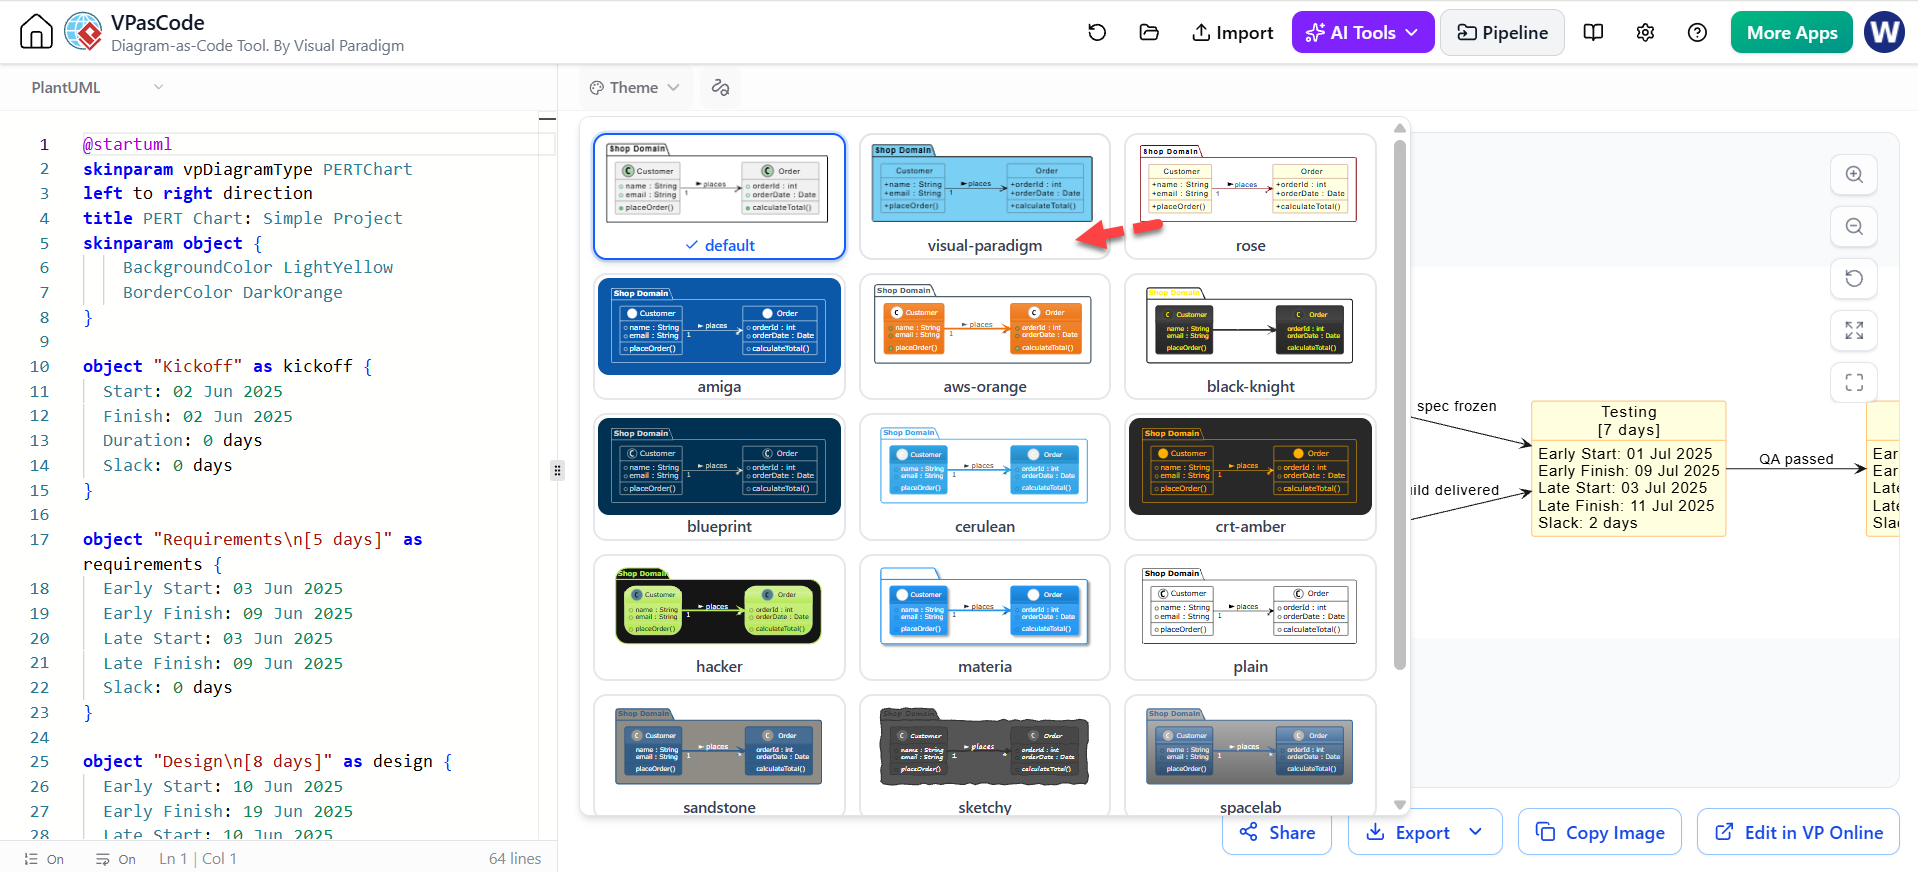
For example:
@startuml
!theme rose
title PERT Chart: Mobile Banking App Launch

' Add task objects and dependency arrows here

@enduml
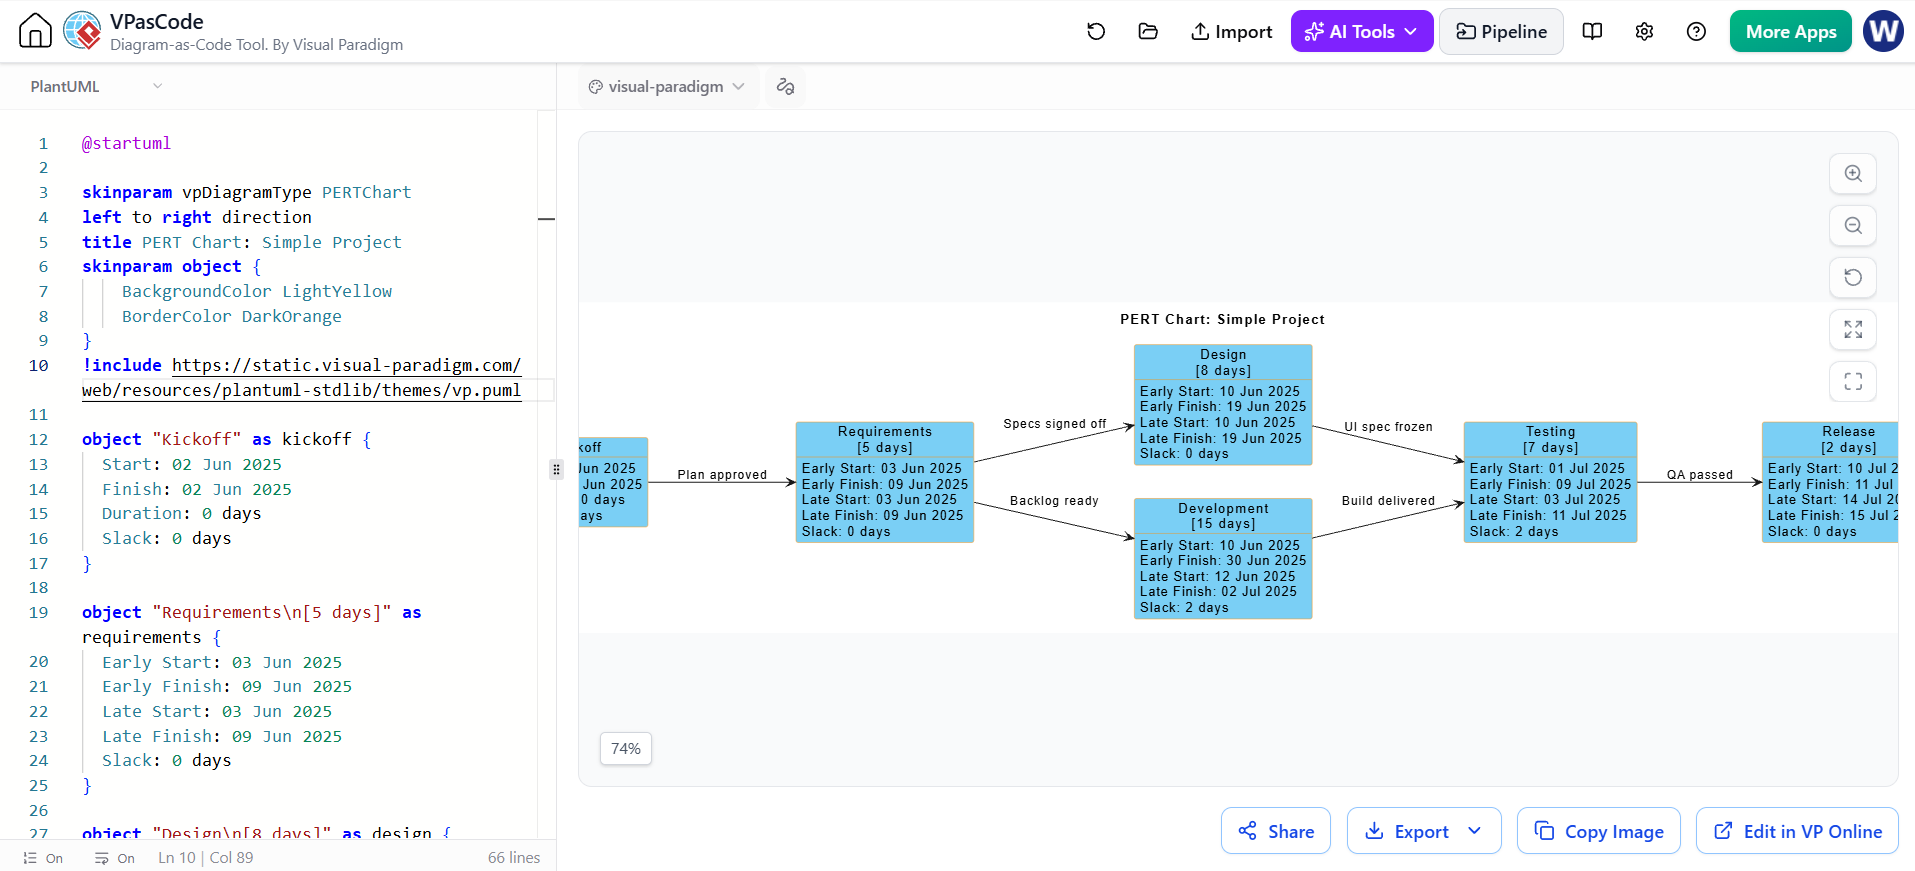
Choose a theme for visual consistency, then check that task labels and critical-path styling remain clear in the rendered output. Theme appearance may affect colors and other styling, so verify the final preview rather than relying on the code alone.
Generate a first draft with the AI Diagramming Chatbot
Use the Visual Paradigm AI Diagramming Chatbot when you want to start from a natural-language description instead of writing the whole network by hand. Provide the activities, durations, dependencies, and desired look. Ask explicitly for PlantUML object-diagram syntax if you want editable PlantUML code, and explain that the chart is PERT-style rather than assuming the AI will calculate the schedule correctly.
For example, use a prompt like:
Create a PERT-style activity network for a mobile banking app launch in PlantUML object-diagram syntax, using
@startuml. Include one object per task with its duration and manually supplied ES and EF values. Connect each prerequisite to its dependent task with arrows. Highlight the critical path in red and use a clean, readable theme. Do not invent missing dates or claim to calculate the critical path.
@startuml
skinparam vpDiagramType PERTChart
left to right direction
title PERT Chart: Mobile Banking App Launch (ES / EF in working days, Day 0 = kickoff; values supplied manually)
skinparam backgroundColor #FFFFFF
skinparam defaultFontName Helvetica
skinparam defaultFontSize 12
skinparam shadowing false
skinparam object {
    BackgroundColor #F4F7FB
    BorderColor #5B7A99
    FontColor #1E2A38
    RoundCorner 8
}

' ---- Critical path nodes (highlighted red) ----
object "Kickoff\n[0 days]" as n1 #FDE9E9 {
  Early Start: Day 0
  Early Finish: Day 0
}

object "Requirements & Scope\n[5 days]" as n2 #FDE9E9 {
  Early Start: Day 0
  Early Finish: Day 5
}

object "UX Research & Flows\n[7 days]" as n3 #FDE9E9 {
  Early Start: Day 5
  Early Finish: Day 12
}

object "UI Design\n[8 days]" as n5 #FDE9E9 {
  Early Start: Day 12
  Early Finish: Day 20
}

object "Mobile Frontend Build\n[12 days]" as n7 #FDE9E9 {
  Early Start: Day 20
  Early Finish: Day 32
}

object "System Integration Test\n[8 days]" as n9 #FDE9E9 {
  Early Start: Day 32
  Early Finish: Day 40
}

object "User Acceptance Test\n[7 days]" as n11 #FDE9E9 {
  Early Start: Day 40
  Early Finish: Day 47
}

object "App Store Release\n[4 days]" as n12 #FDE9E9 {
  Early Start: Day 47
  Early Finish: Day 51
}

' ---- Non-critical nodes ----
object "Solution Architecture\n[6 days]" as n4 {
  Early Start: Day 5
  Early Finish: Day 11
}

object "Core Banking API Build\n[14 days]" as n6 {
  Early Start: Day 11
  Early Finish: Day 25
}

object "Security & Compliance Review\n[6 days]" as n8 {
  Early Start: Day 25
  Early Finish: Day 31
}

object "Regression Testing\n[5 days]" as n10 {
  Early Start: Day 32
  Early Finish: Day 37
}

' ---- Dependencies ----
n1 --> n2 : "Project approved"
n2 --> n3 : "Scope signed off"
n2 --> n4 : "Scope signed off"
n3 --> n5 : "Flows validated"
n4 --> n6 : "Architecture baselined"
n5 --> n7 : "Design approved"
n6 --> n8 : "APIs available"
n7 --> n9 : "Build delivered"
n8 --> n9 : "Security sign-off"
n9 --> n10 : "SIT exit criteria met"
n9 --> n11 : "SIT passed"
n11 --> n12 : "UAT sign-off"
@enduml
Review the generated result before relying on it. Check that the activities match your task list, the arrows match the dependencies, and any dates or critical-path markings are correct. Visual Paradigm describes a workflow in which diagrams generated in the chatbot can be opened in VPasCode for code editing and styling.
Recommended workflow
Use the chatbot to draft the diagram, VPasCode to inspect and refine the PlantUML, and the theme selector to adjust its presentation. Keep the task schedule and critical-path calculations independently verified, then save or export the reviewed result in the format your documentation or presentation requires. VPasCode supports diagram preview and export options.
Conclusion
PlantUML makes PERT-style charts editable as code: tasks, dependencies, labels, and styling can all be reviewed and revised in a text-based workflow. Visual Paradigm’s AI Chatbot can help create a starting draft, while VPasCode lets you inspect the PlantUML and preview the diagram with a selected theme. Because the tools render the network rather than calculate its schedule, verify durations, dates, slack, and critical-path markings before using the chart to guide project decisions.
