Home » Archives for Admin » Page 43
If you're looking for a high-quality infographic about Tesla, you've come to the right place! Our "Facts And Statistics Of Tesla Infographic" is perfect for anyone who wants to learn more about this innovative company. The design is clean, modern, and easy to read, with bold colors and eye-catching graphics. The infographic covers a range of topics, from Tesla's history and mission, to their product lines and market share. Customize this Infographic Template Creating a professional infographic like this one is easy with Visual Paradigm Online's graphic design editor. Our online infographic maker…
continue reading →
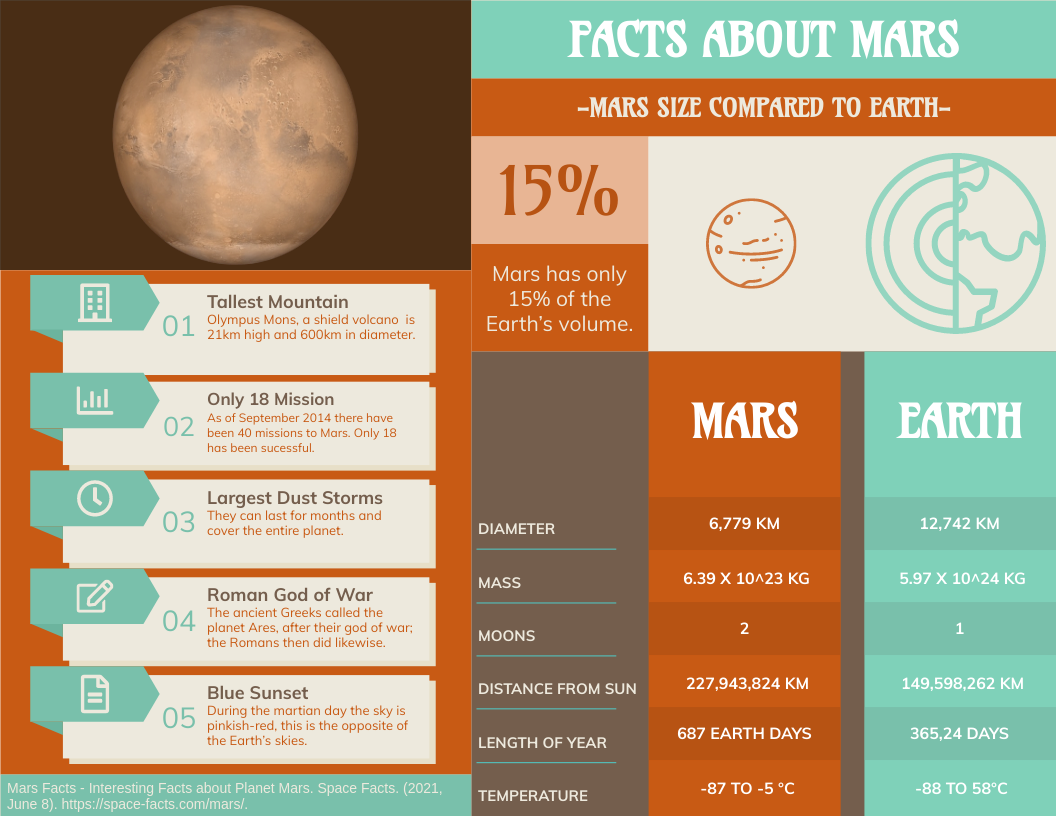
Introducing the "Mars Data Analytics Horizontal Infographic," a visually appealing and informative graphic designed for businesses and organizations to showcase data analytics on the planet Mars. With this fully customizable design, you can modify the theme, colors, and content to fit your specific needs. This infographic is perfect for those who want to present complex data in a visually engaging way. Using Visual Paradigm Online, an online infographic maker and online infographic tool, you can create high-quality infographics like this one without any design experience. Visual Paradigm Online provides a user-friendly interface, making…
continue reading →
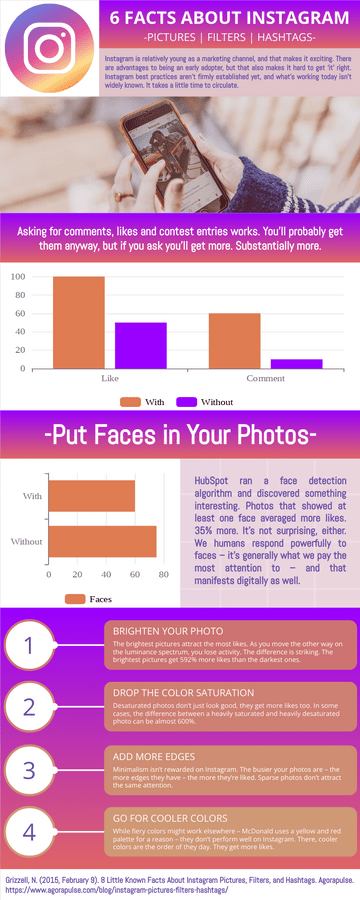
Introducing our latest infographic template, "6 Facts About Instagram"! This horizontal infographic is designed to provide businesses and organizations with essential information about Instagram. The design is sleek, modern, and easy to read, making it perfect for sharing on social media or adding to presentations. With Visual Paradigm Online, creating high-quality infographics like this one has never been easier. Our online infographic maker offers a user-friendly interface, intuitive drag-and-drop tools, and a wide range of design elements to choose from. You don't need any prior graphic design experience to create stunning infographics that…
continue reading →
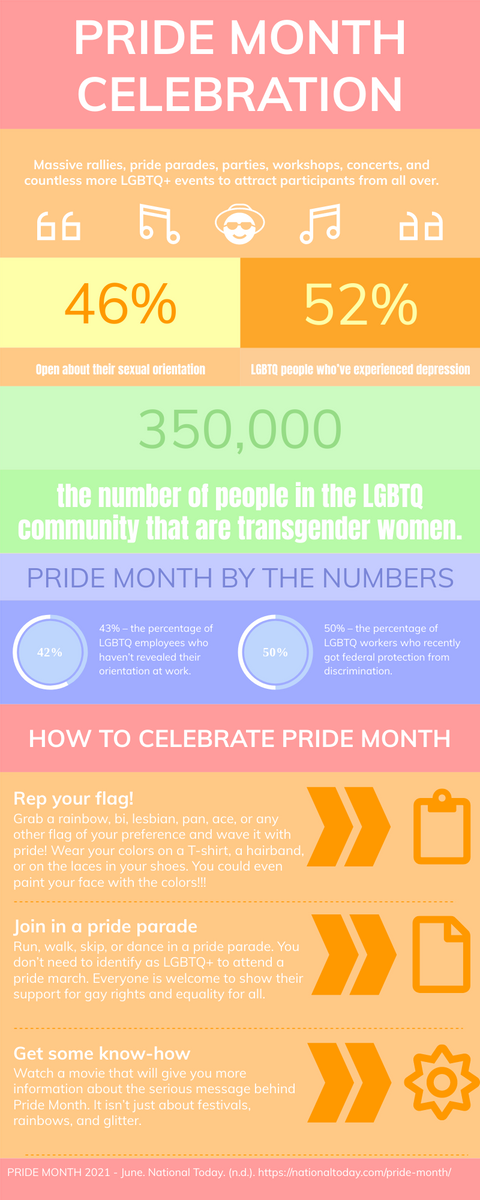
Looking for a high-quality infographic maker to celebrate Pride Month? Look no further than Visual Paradigm Online! Our "Pride Month Celebration Infographic" is a stunning design that showcases the history and importance of Pride Month. Using our online infographic tool, you can easily create professional designs without any graphic design experience. Our drag-and-drop editor and customizable templates make it simple to create beautiful designs in minutes. You can customize every aspect of your design, including fonts, colors, and images. Customize this Infographic Template At Visual Paradigm Online, we believe that creating high-quality…
continue reading →
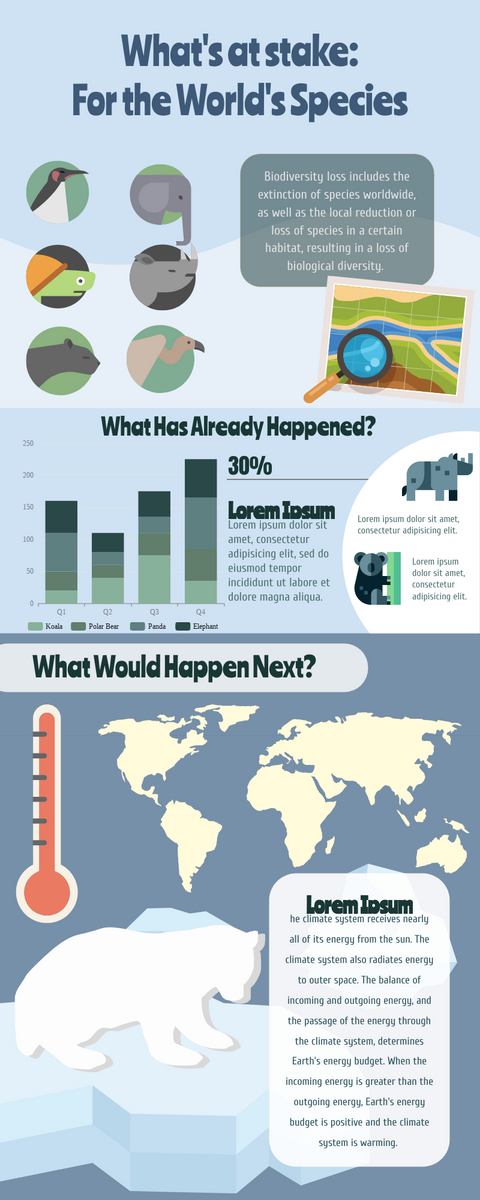
The theme of World Environment Day 2020 is biodiversity. In response to the recent outbreak of various environmental disasters, locust plagues from Africa, as well as forest fires in the Amazon, Indonesia, Russia, Siberia, Australia and other surrounding areas, the global epidemic has not subsided, indicating that ecosystems are not only closely related to human survival, but also face a severe test. What exactly is biodiversity? What is the impact of reduced biodiversity on humans? Why was it rated by the United Nations as the most important issue of the year? The Importance…
continue reading →
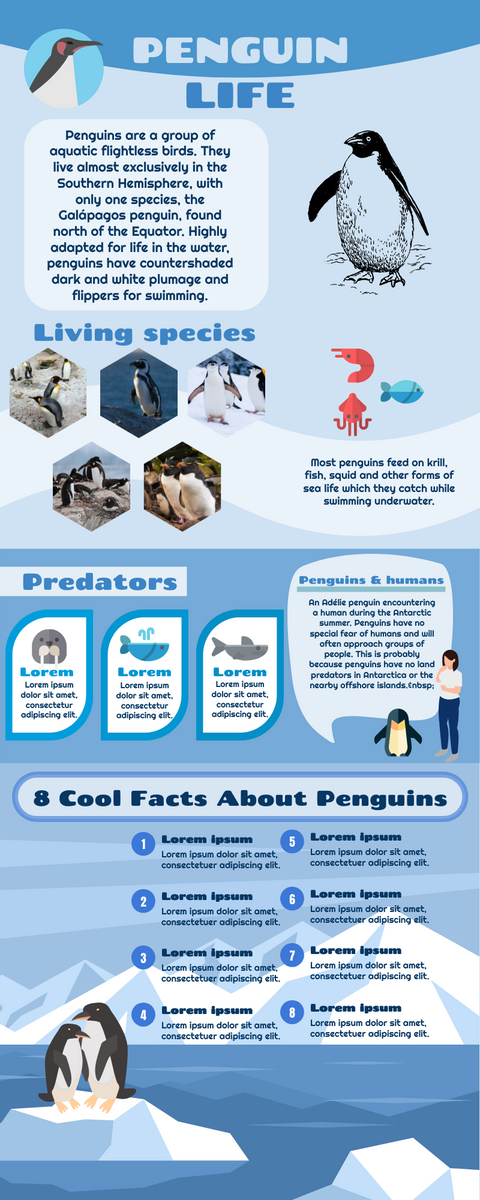
You know what makes penguins so special and interesting? Penguins are some of the world’s most famous and beloved birds, and even have their very own holiday – World Penguin Day on April 25. Penguins are also some of the most unique and amazing birds due to their physical adaptations to survive in unusual climatic conditions and mainly live at sea. Threats to Penguins There are 18 unique penguin species in the world, although two species – the northern rock and fish and the southern rock are fish – are sometimes considered to…
continue reading →
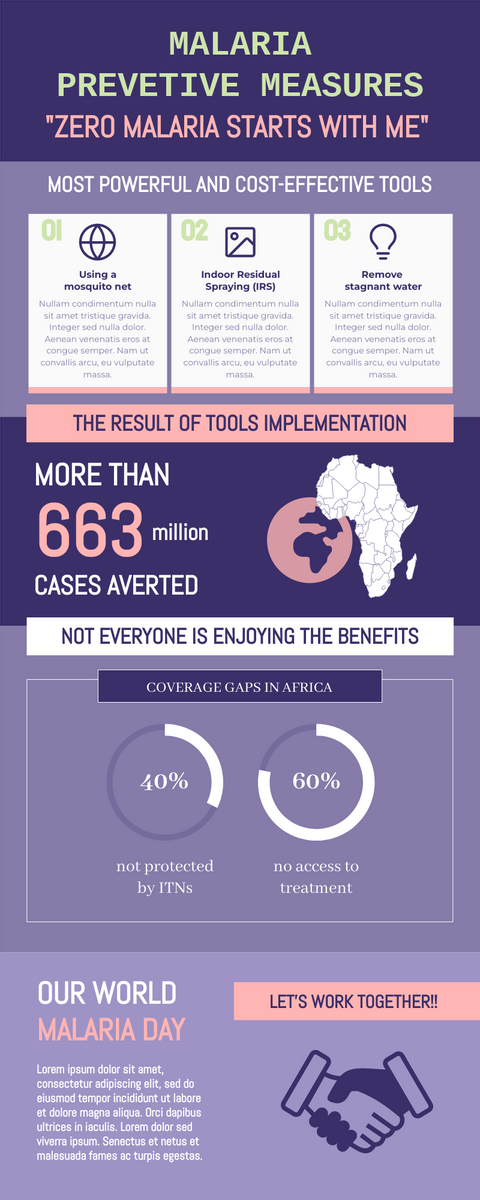
Malaria occurs most often in tropical regions, especially in undeveloped areas. The risk of infection for travellers depends on where they travel in their local country and the type of activity they are involved in. Symptoms of Malaria: High fever (over 38.5 degrees Celsius) Cold and uncontrollable shaking, sweating heavily Headaches Muscle aches Tired or weak Jaundice in some cases (yellowing of eyes and skin) Insanity/coma Malaria Disease Prevention According to the mosquito’s night feeding habits, malaria transmission occurs mainly between dusk and dawn. Therefore, preventive measures need to be taken, especially during…
continue reading →
The ability to absorb as well as perceive messages accurately during an communication process is known as listening. Communication can only take place when the listener is fully and actively hearing and holding the message. If one does not have the ability to listen effectively, the message can easily be misinterpreted, the communication process will break down, and the sender will feel frustrated. Listening vs Hearing Hearing is simply the act of sensing sound through the ear. If you don’t have hearing impairment, hearing can naturally happen. However, listening is something you consciously…
continue reading →
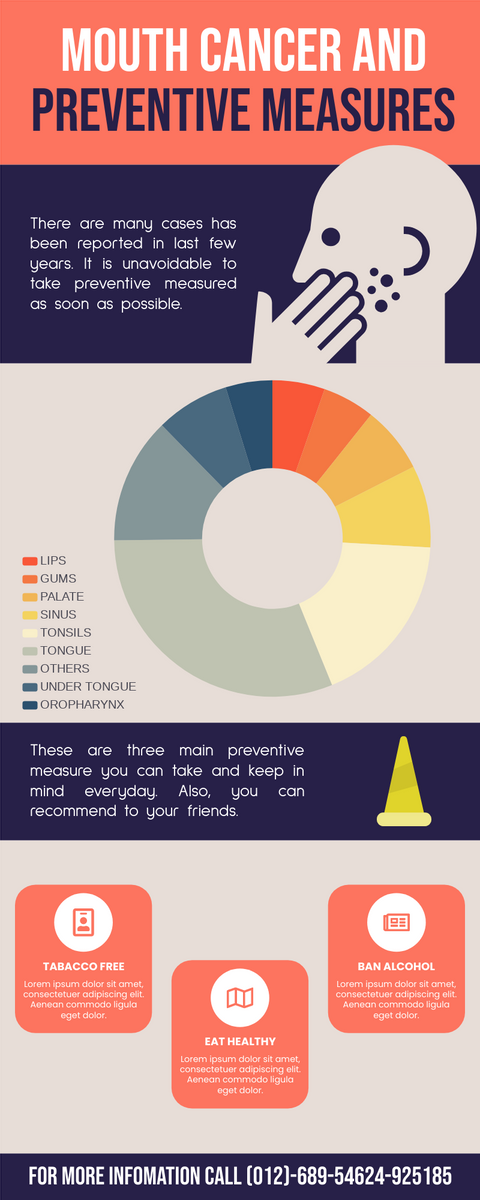
The oral cavity is also called oral cancer. This area of the body includes the lining of lips, lips and cheeks (called bucket mucosa), teeth, gums, most of the tongue, bottom of the mouth, and etc. Mouth Cancer in the U.S. Oral cancer accounts for about 3% of all cancers in the United States. About 30,000 cases are diagnosed every year, and about 8,000 people die from oral cancer every year. The incidence of oral cancer is rising. Key Facts About 95% of oral cancers occur in people over 40. The average age…
continue reading →
The United States is the only country in the world that has practiced democracy for more than 200 years. The adoption of the U.S. Constitution in 1788 was also the world’s largest official blueprint for modern democracy. The race for the White House has begun as the world waits for the 59th presidential election between Democratic nominee Joe Biden and interim President Donald Trump. It will be one of the most fiercely fought polls in the United States. After months of fierce election and controversy, the US presidential election is finally over. Before…
continue reading →


