Home » Archives for Admin » Page 8
-
Posted on September 21, 2023
-
/Under Diagram
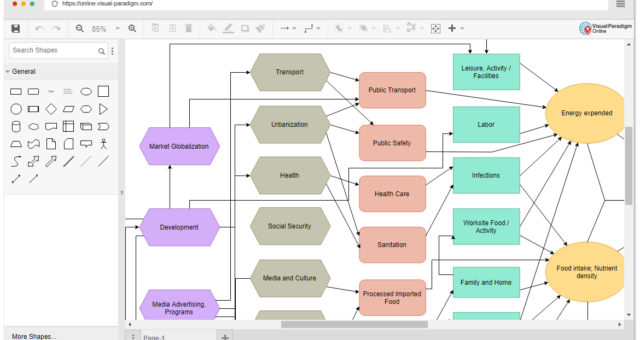
Introduction Problem flow diagrams, also known as logic diagrams, are a valuable tool for breaking down complex issues into smaller, interconnected factors that contribute to the main problem. These diagrams empower individuals directly impacted by a problem by helping them gain a deeper understanding of the various elements that constitute a larger issue. Additionally, problem flow diagrams assist decision-makers in identifying steps they can take to address the problem or its components effectively. Purpose The primary purpose of a problem flow diagram is to: Simplify Complexity: Problem flow diagrams break down complex issues…
continue reading →
-
Posted on September 21, 2023
-
/Under Diagram
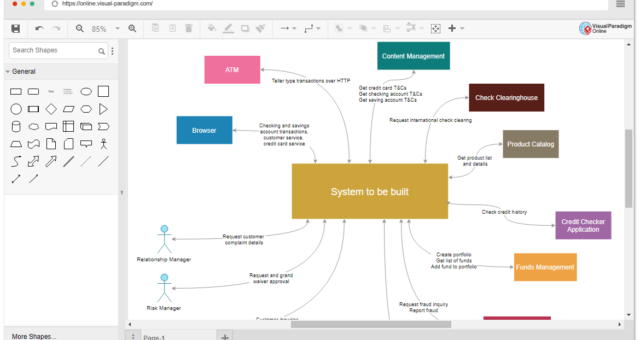
Introduction A System Context Diagram (SCD), also known as a Context Diagram, is a fundamental tool in systems engineering and software development that helps visualize the relationships between a system and its external entities or stakeholders. It provides a high-level view of a system's boundaries, showing what interacts with the system and what lies outside of it. This comprehensive guide will explain the purpose, key concepts, and elements of a System Context Diagram and provide examples using pre-made templates available in Visual Paradigm Online. Purpose of System Context Diagram The primary purpose of…
continue reading →
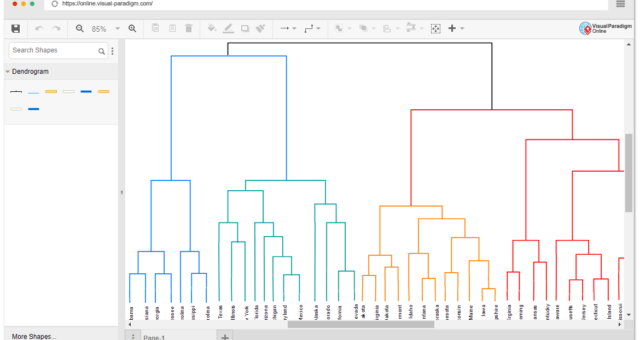
Introduction A dendrogram is a graphical representation of hierarchical relationships between objects, which are often used in various fields such as data analysis, computational biology, and phylogenetics. This guide will cover the purpose, key concepts, elements, and provide examples of dendrogram diagrams using pre-made templates available in Visual Paradigm Online. Purpose of Dendrogram Diagrams Dendrogram diagrams serve several purposes in different domains: Hierarchical Clustering: Dendrograms are frequently used in hierarchical clustering to visualize the arrangement of clusters resulting from clustering analyses. They provide insights into how data points are grouped together at different…
continue reading →
-
Posted on September 21, 2023
-
/Under Diagram
Introduction A Business Concept Diagram serves as a more informal and high-level visual representation of business processes and organizational structures, tailored for a business-oriented audience. You have the flexibility to create this diagram by utilizing the provided standard shapes or by importing your own custom shapes. This comprehensive guide will walk you through the purpose, key concepts, and elements of this diagram and provide examples using pre-made templates available in Visual Paradigm Online. 1. Introduction A Business Concept Design Diagram, often referred to simply as a "Concept Diagram," is a graphical representation that…
continue reading →
-
Posted on September 21, 2023
-
/Under Diagram
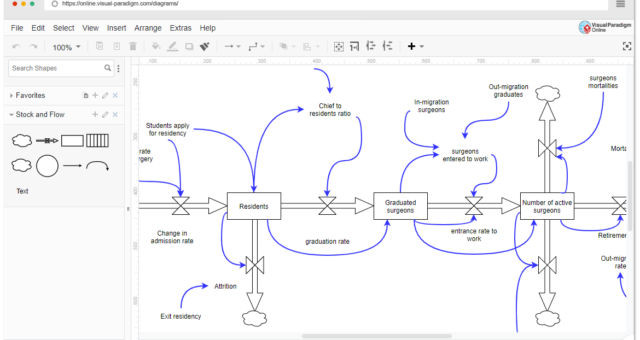
Introduction Stock and Flow Diagrams are essential tools used in economics, business, accounting, and related fields to represent and understand the dynamics of quantities over time. They help distinguish between stocks and flows, two fundamental concepts in these fields. In this guide, we'll explore the purpose, key concepts, and elements of Stock and Flow Diagrams, and learn through examples using pre-made templates available in Visual Paradigm Online. Purpose of Stock and Flow Diagrams Stock and Flow Diagrams are employed to visualize and model dynamic systems where quantities can be categorized into two main…
continue reading →
-
Posted on September 21, 2023
-
/Under Diagram
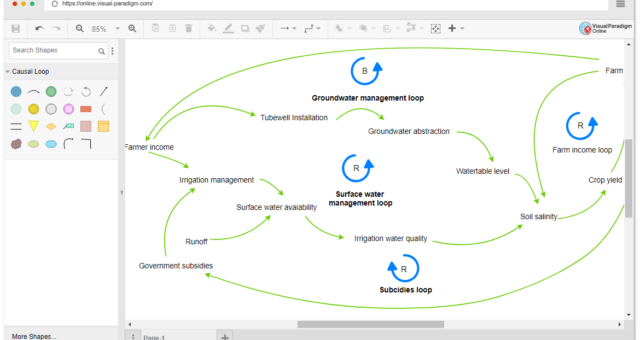
Introduction A Causal Loop Diagram (CLD) is a powerful tool for understanding and representing the causal relationships within complex systems. It helps visualize how variables in a system influence each other and whether these influences are positive (reinforcing) or negative (balancing). This comprehensive guide will cover the purpose, key concepts, and elements of CLDs and provide examples using pre-made templates available in Visual Paradigm Online. Purpose of Causal Loop Diagrams Causal Loop Diagrams serve several important purposes: Understanding Complex Systems: They help in gaining a deeper understanding of complex systems by identifying the…
continue reading →
-
Posted on September 21, 2023
-
/Under Diagram
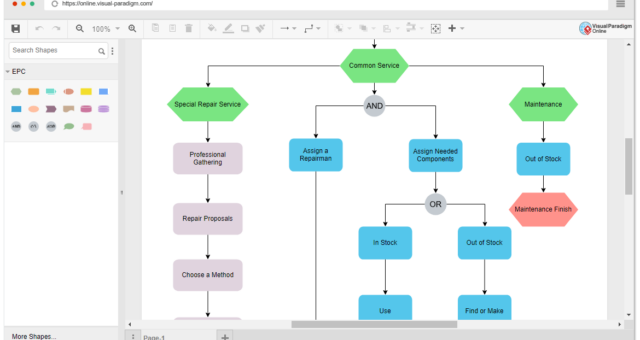
Introduction Event-driven Process Chain (EPC) diagrams are a powerful tool for modeling, analyzing, and improving business processes. In this comprehensive guide, we will explore the purpose, key concepts, and elements of EPC diagrams. We'll also provide examples using pre-made templates available in Visual Paradigm Online. 1. Introduction to EPC Diagrams Event-driven Process Chain (EPC) diagrams are a type of flowchart used for business process modeling. They were developed within the Architecture of Integrated Information Systems (ARIS) framework in the early 1990s by August-Wilhelm Scheer. EPC diagrams help organizations visualize and document their business…
continue reading →
-
Posted on September 21, 2023
-
/Under Diagram
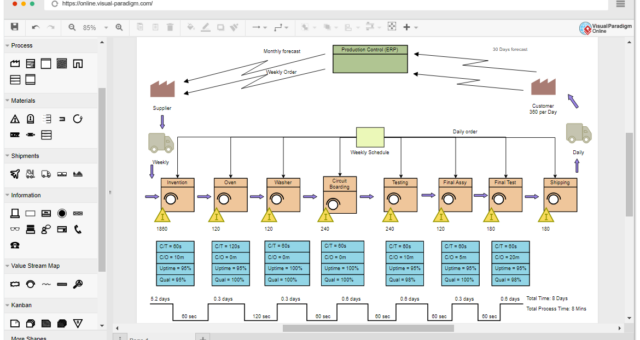
Value-stream mapping (VSM) is a powerful lean management technique used to analyze, optimize, and visualize the flow of materials and information in a specific process or value stream. This comprehensive guide will cover the purpose, key concepts, essential elements, and provide examples using pre-made templates available in Visual Paradigm Online 1. Introduction to Value-Stream Mapping 1.1 Purpose of Value-Stream Mapping The primary purpose of value-stream mapping is to identify and eliminate or reduce waste in a specific process or value stream. This waste reduction aims to increase the efficiency of operations, enhance productivity,…
continue reading →
-
Posted on September 21, 2023
-
/Under Diagram
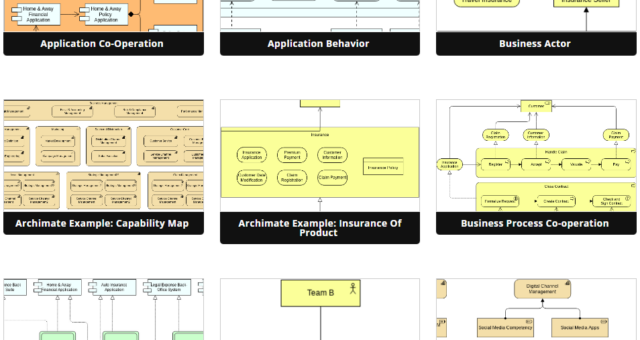
Introduction ArchiMate is an open and independent enterprise architecture modeling language that provides a standardized way to describe, analyze, and visualize architecture within and across business domains. It is widely used for creating architectural models that help organizations make informed decisions and manage complex systems. This guide will provide you with a comprehensive overview of ArchiMate diagrams, including their purpose, key concepts, and elements, along with practical examples using pre-made templates available in Visual Paradigm Online. Purpose of ArchiMate Diagrams ArchiMate diagrams serve the following key purposes: Architecture Visualization: ArchiMate diagrams help visualize…
continue reading →
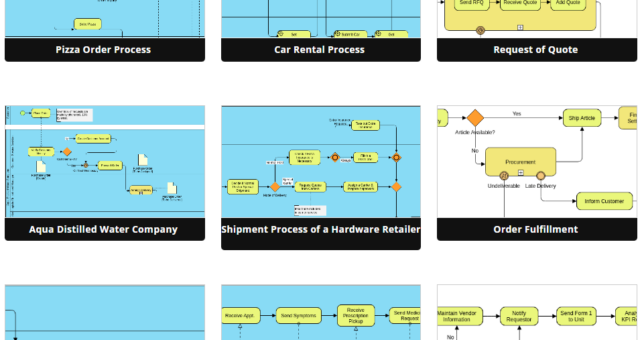
Introduction Business Process Model and Notation (BPMN) is a standardized graphical notation used to represent business processes in a clear and understandable manner. BPMN diagrams are widely used in business process modeling, analysis, and documentation. In this tutorial, we will explore the purpose, key concepts, and elements of BPMN diagrams and learn by examples using pre-made templates in Visual Paradigm Online. 1. Introduction to BPMN What is BPMN? BPMN, or Business Process Model and Notation, is a visual language for representing business processes. It provides a standardized way to graphically depict processes, making…
continue reading →