Create A Grouped Column And Line Chart
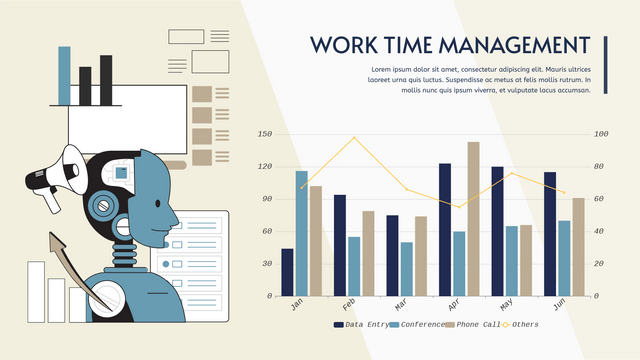
What Is A Grouped Column And Line Chart Grouped column And Line chart is a kind of combined chart consisted in grouped column chart and line chart. A line chart is placed on the top of a grouped column chart to show 2 sets of data together with widely difference. When To Use Grouped Column And Line Chart In a grouped column and line chart, Y-axis on both 2 sides are representing the value of the 2 sets of data. In this case, the difference between the ranges of their data are usually…continue reading →


