How To Create A Sankey Diagram
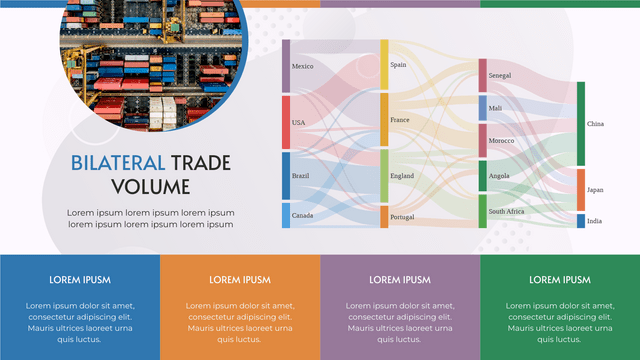
What Is A Sankey Diagram Sankey diagram is a type of data visualization that shows the flow of data or information through a system. It uses a series of arrows or lines of varying widths to represent the amount of data flowing from one point to another. Sankey diagram is usually used to show different data flow. For example, U.S. Energy Information Administration (EIA) use Sankey Diagram to show the production and consumption of energy in the annual report. How To Create A Sankey Diagram https://www.youtube.com/watch?v=IYmxx0R4MTk&width=854&height=480 Create a Sankey Diagram Awesome Sankey Diagram…continue reading →


