How to create a funnel chart?

How to create a funnel chart?

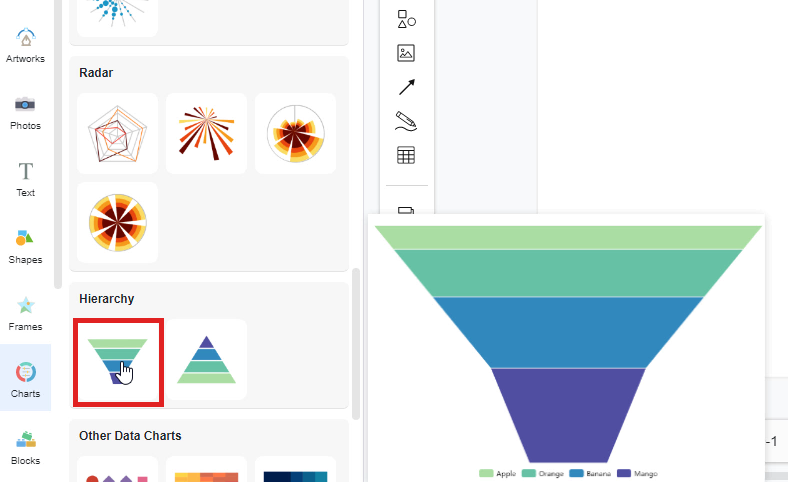
Visual Paradigm Online provide you an online design tool for everyone to use. We often record data for a particular use and sometimes we may need to present the data through graphics. In Visual Paradigm Online, you can create various charts freely like bar charts, column charts, pie charts, etc. This chart tool can help you to display any data by using text, symbols, and graphics. You can easily visualize the data that you have collected as graphics and they are presentable. This is a guide for teaching you to create a funnel…continue reading →
Create a Histogram

Create a Histogram

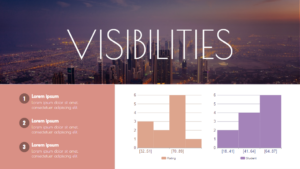
A histogram is an approximate representation of the distribution of numerical data. To construct a histogram, the first step is to "bin" (or "bucket") the range of values—that is, divide the entire range of values into a series of intervals—and then count how many values fall into each interval. This video will show you how to create a Histogram in Visual Paradigm Online. https://www.youtube.com/watch?v=o54-u_G3oBY&width=854&height=480 What is a Histogram? Histograms give a rough sense of the density of the underlying distribution of the data, and often for density estimation: estimating the probability density function…continue reading →
Create A Stream Graph

Create A Stream Graph

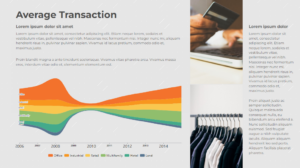
A streamgraph, or stream graph, is a type of stacked area graph which is displaced around a central axis, resulting in a flowing, organic shape. This video will show you how to create a stream chart in Visual Paradigm Online. https://www.youtube.com/watch?v=V5p4UxZEZck&width=854&height=480 What is a Stream Graph? A stream graph, or stream graph, is a type of stacked area graph which is displaced around a central axis, resulting in a flowing, organic shape. Unlike a traditional stacked area graph in which the layers are stacked on top of an axis, in a streamgraph, the…continue reading →
Create A Semi-Doughnut Chart

Create A Semi-Doughnut Chart

The semi-circle chart generally uses half (or more than half) circles, which has the same function as the ordinary circle chart, except that the percentage is displayed in the form of a semi-circle, which is sometimes more in line with the vision. This video will show you how to create a semi-doughnut chart in Visual Paradigm Online. https://www.youtube.com/watch?v=6QrsLD00yUg&width=854&height=480 What is a Semi-Doughnut Chart? A Semi-Doughnut Chart is a 180 degrees graph that represents a composition as a whole. The semi-circle chart generally uses half (or more than half) circles, which has the same…continue reading →
How to Create a Boxplot

How to Create a Boxplot

You can easily create graphics with the online design tool for free in Visual Paradigm Online for free. Sometimes, we need to record data for a particular use and sometimes we may need to present the data through graphics. With this design tool, you can create various charts freely like bar charts, column charts, pie charts, etc. This chart tool can help you to display any data by using text, symbols, and graphics. You can easily visualize the data that you have collected as graphics and they are presentable. This is a guide…continue reading →
Create A Control Chart

Create A Control Chart

Control charts are a statistical process control tool used to determine if a manufacturing or business process is in a state of control. This video will show you how to create a control chart in Visual Paradigm Online. https://www.youtube.com/watch?v=IEG6O0eLZrg&width=854&height=480 What is A Control Chart Control charts are a statistical process control tool used to determine if a manufacturing or business process is in a state of control. It is more appropriate to say that the control charts are the graphical device for Statistical Process Monitoring (SPM). Traditional control charts are mostly designed to…continue reading →
How to add a chart title?

How to add a chart title?

Visual Paradigm Online provides you with an online design tool for everyone to use. In Visual Paradigm Online, you can create various charts freely like bar charts, column charts, pie charts, etc. This chart tool can help you to display any data by using text, symbols, and graphics. You can easily visualize the data that you have collected as graphics and they are presentable. You can also edit the chart easily with the data, chart titles, chart colors, fonts, etc... This is a guide for teaching you to add chart titles on chart…continue reading →
How to Create a Nightingale Rose Chart

How to Create a Nightingale Rose Chart

In Visual Paradigm Online, you can easily create graphics with the online design tool for free. Sometimes, we need to record data for a particular use and sometimes we may need to present the data through graphics. In Visual Paradigm Online, you can create various charts freely like bar charts, column charts, pie charts, etc. This chart tool can help you to display any data by using text, symbols, and graphics. You can easily visualize the data that you have collected as graphics and they are presentable. This is a guide for teaching…continue reading →
How to Create a Curved Line Chart

How to Create a Curved Line Chart

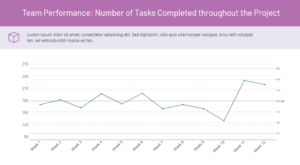
The formal expression used to describe a linear graph is linear whether it passes through the origin or not, and the relationship between the two variables is called linear. Similarly, the relationship shown by a curve graph is called non-linear. A curved line chart will indicate change. In this video, you can see how to create a curved line chart in VP Online.
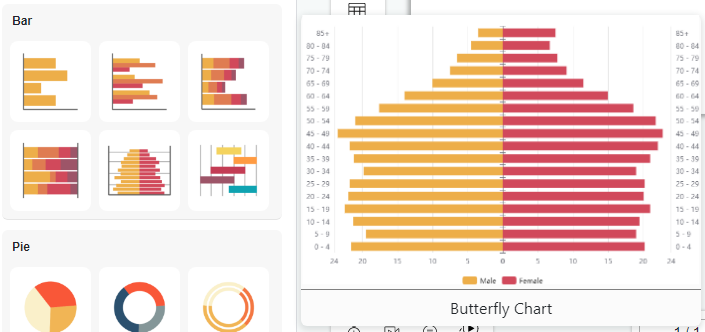
How to create a butterfly chart?

How to create a butterfly chart?

A butterfly chart is a type of bar chart used to compare two sets of data simultaneously. This type of chart represents the data as two horizontal bars with the same x-axis in the middle, which is useful when comparing two sets of data for comparison purposes. Create charts easily with Visual Paradigm Online. In this video, you can see how to create a butterfly chart in VP Online.