Link An Element To Another Diagram

Link An Element To Another Diagram

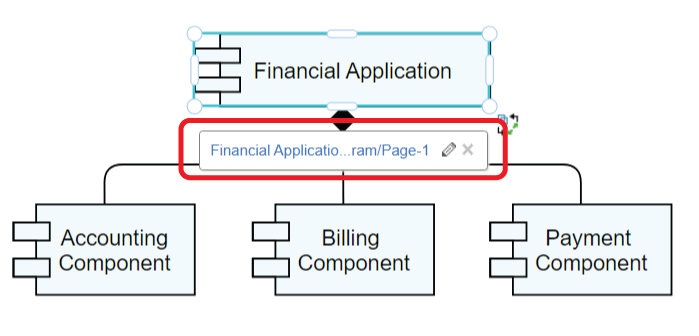
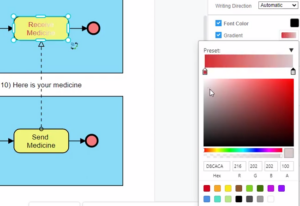
When creating diagram, we sometimes may need to explain the elements by another diagram. In this case, we can add a link to that element so that others can click and read another diagram if they need. https://www.youtube.com/watch?v=75xLKUS3pNo&width=854&height=480 How To Link An Element To Another Diagram After selecting the element, click "Edit Link" under Panel-Arrange. You can also do it by pressing [ Alt + Shift + L ]. You can then link it with other links by 2 ways: Directly enter the link of the diagram page. You can also link to…continue reading →
Layout your diagram

Layout your diagram

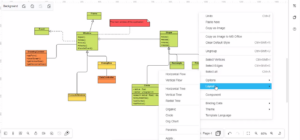
After you finish your diagram, if you don't like your diagram layout and want to create a new one, Visual Paradigm can help you create a new diagram for you! With just a few clicks, a new layout of your diagram will be created. This video will show you how to layout your diagram in Visual Paradigm Online. https://www.youtube.com/watch?v=BSNL38ue-ss&width=854&height=480 When editing your diagram, you can right-click on the blank area of the diagram. Then select the diagram type and layout you want to use from the popup menu. After choosing a layout strategy,…continue reading →
Define entry, exit, and do activity for a state

Define entry, exit, and do activity for a state

Create diagrams easily with Visual Paradigm Online. You can easily edit your own state machine diagram with our powerful diagram maker tool in the VP Online. In this video, you can see how to define entry, exit, and do activity for a state in VP Online. https://www.youtube.com/watch?v=QcljhjwY1vo&width=854&height=480 What is a state machine diagram? UML State Machine Diagrams (sometimes referred to as state diagrams, state machines, or statecharts) show the different states of an entity. State machine diagrams can also show how an entity responds to various events by changing from one state to…continue reading →
Categorize your designs using tags

Categorize your designs using tags

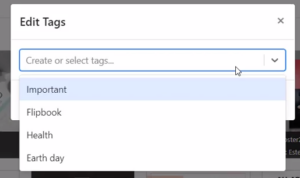
Create great design online easily and effortlessly with Visual Paradigm's intuitive online graphic design tool. After creating a design, your work will be saved on Workspace in the VP Online. When creating a lot of work, you may feel a mess, and not easy to find your old work in your workspace. Don't worry about that, because you can categorize your designs using tags in your workspace of VP Online. This video will show you how to categorize your designs using tags in VP Online. https://www.youtube.com/watch?v=VL-FUj2fTk4&width=854&height=480 Categorize your designs using tags In VP…continue reading →
Apply gradient color to shape the caption

Apply gradient color to shape the caption

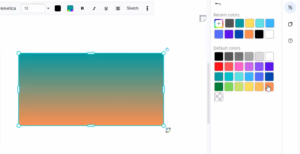
A color gradient is a color that changes from one color to another color. A color gradient can either be vertical, horizontally, or diagonally. Using a color gradient can help you get attention and direct eyesight, making your work more engaging. This video will show you how to apple gradient color to shape caption in the Visual Paradigm Online. https://www.youtube.com/watch?v=L_RZx8BMLbk&width=854&height=480 Apply gradient color to the element's caption In VP Online, you can apply gradient color to the element's caption. Select the element, then go to Settings Panel, text, and select Gradient. Click on…continue reading →
Apply a gradient fill color to shape

Apply a gradient fill color to shape

Create a stunning design with our intuitive online graphic design editor, which features a wide variety of features to help you create your design. This video can show you how to apply a gradient fill color to shape in the Visual Paradigm Online. https://www.youtube.com/watch?v=-2Pgd4QRtKU&width=854&height=480 When editing your design, you can apply gradient color to an element. Tip: Before you can style anything, you must select it. Click on a shape to select it, or hold Shift down and click on multiple shapes to select many. Select the element, then go to Settings Panel,…continue reading →
Change Display Option Of ArchiMate Element

Change Display Option Of ArchiMate Element

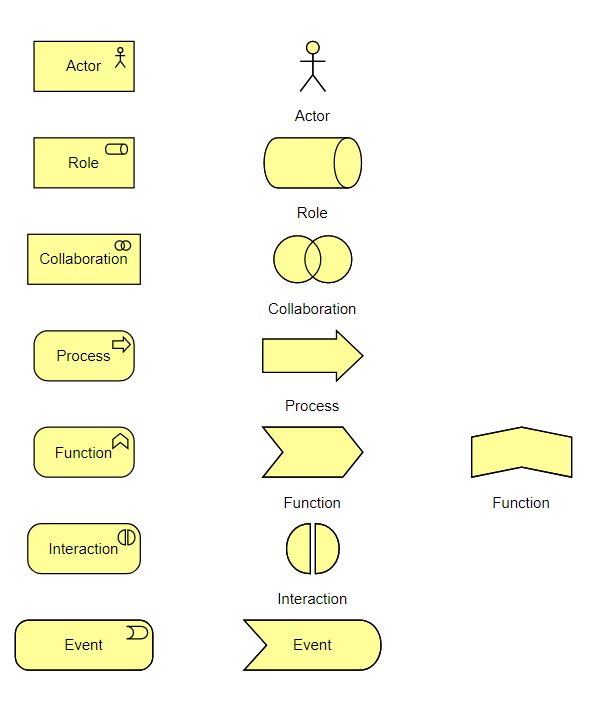
ArchiMate offers a visual language to model enterprise architecture. ArchiMate allows you to visualize relationships within and between different domains. These domains primarily include products/services, processes, organization, data applications, and technical infrastructure. ArchiMate comes with a rich collection of diagram symbols to support different kinds of modeling needs. Some of these symbols have multiple presentations - a regular box-like shape and a symbolic presentation (e.g. a computer shape that represents a device)In this article, you will learn how to switch between different representations by changing the display option of an ArchiMate element In…continue reading →
How to Print a Diagram?

How to Print a Diagram?

In Visual Paradigm Online, you can create your own graphics and save them as JPEG, PDF, PNG, etc. formats. You can also print out your design works with your printer. Here is the tutorial for guiding you to print out your designs and set the printing options or details easily with a few clicks. You can watch the attached video or read the guide below for learning how to print out your graphics work. https://www.youtube.com/watch?v=neXYu8Nrqyc&width=854&height=480 Click on the "Export" button After finishing your design on Visual Paradigm Online, you can print out your…continue reading →
Adding Line Breaks in Labels

Adding Line Breaks in Labels

In Visual Paradigm Online, you can design your graphics by editing texts freely. Sometimes, you may need to design graphics with long texts in paragraphs. If the text for the design is too long, it may affect the design layout. In this case, you may need to add line breaks for the long texts for design. With the online design tool in Visual Paradigm Online, you can add line breaks easily for design. This is a tutorial in guiding you to add line breaks for long texts. You can watch the attached video…continue reading →
Create Regions In State

Create Regions In State

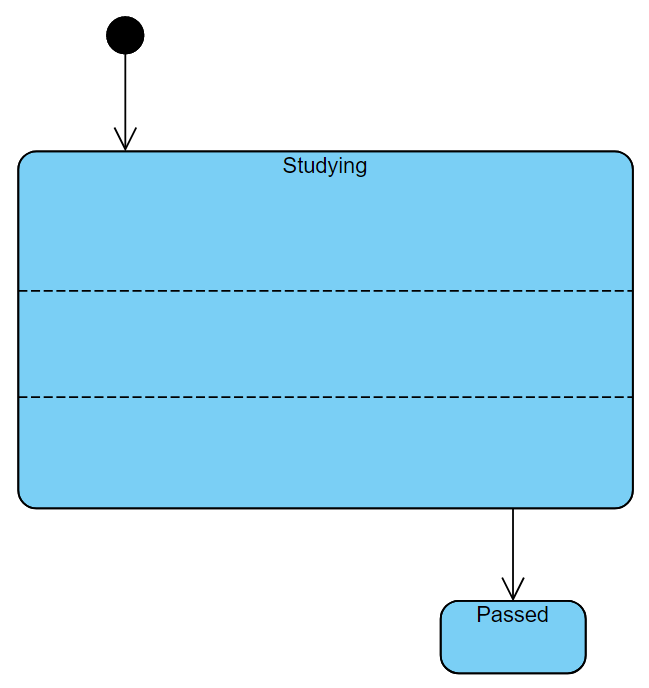
In a UML state machine diagram (aka state diagram), a region is a container inside a state that can hold pseudo states, states, and transitions. Typically, region is used to define nested states and transitions. By using regions, you can include more details about the internal transitions of a particular state. In this article, you will learn how to add states in a region. https://www.youtube.com/watch?v=S0JYoM5QW-8&width=854&height=480 How To Create Regions In State Add A New Region When creating state machine diagram, click on the state and right-click. You will then find 2 buttons: Add…continue reading →