




Comprehensive Guide to the Benefits of VPasCode Editor in Visual Paradigm’s Ecosystem
VPasCode is Visual Paradigm’s browser-based diagram-as-code editor. It allows users to create professional diagrams by writing text-based definitions instead of manually drawing shapes. The editor combines code authoring, real-time rendering, AI assistance, sharing, export capabilities, and connections to other Visual Paradigm tools.
Its main value is that it brings developer-oriented workflows into visual modeling: diagrams become easier to create, revise, reproduce, share, and maintain alongside technical documentation.
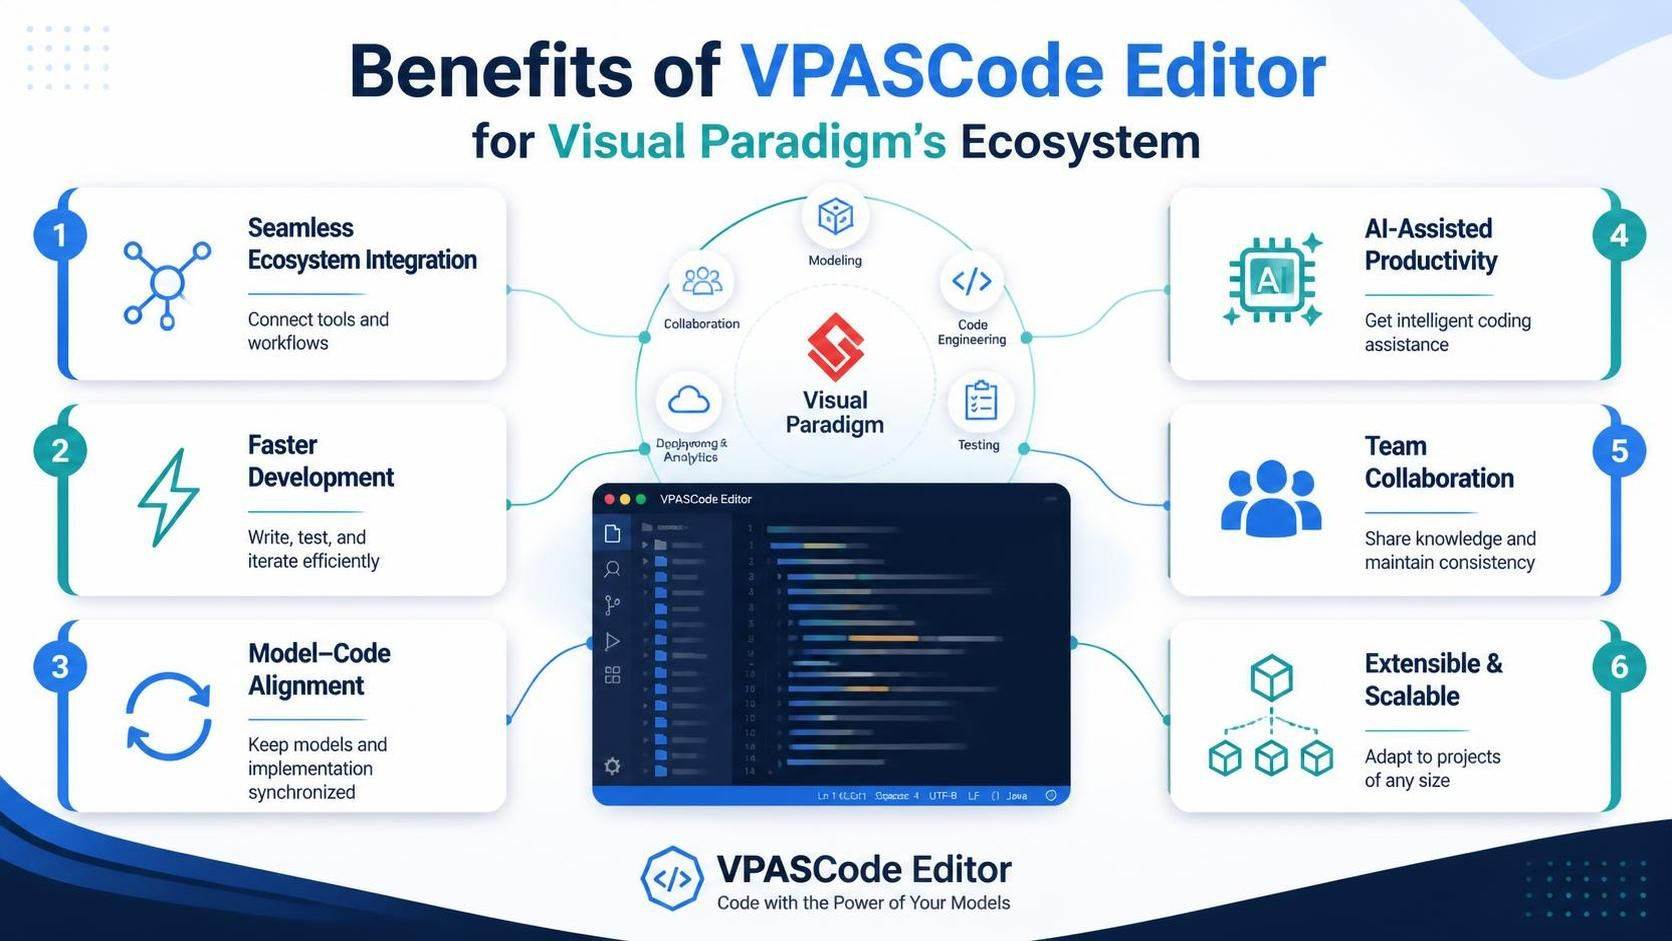
1. Seamless integration with the Visual Paradigm ecosystem
VPasCode is designed to work as part of a broader workflow rather than as an isolated diagramming application. Users can move from idea generation to code-based refinement and then into documentation or presentation workflows.
A typical ecosystem workflow looks like this:
-
Generate or brainstorm an idea using natural language or the Visual Paradigm AI Diagramming Chatbot.
-
Open the result in VPasCode for detailed code-level editing.
-
Refine the layout, relationships, labels, and visual style through diagram syntax.
-
Export or share the diagram as an image, vector file, or live link.
-
Add the diagram to documentation, such as an OpenDocs knowledge base.
This creates a continuous path from concept to implementation and documentation. Instead of recreating the same diagram in several tools, teams can refine and reuse one diagram source across multiple stages.
Practical benefit
A product manager might describe a workflow in natural language, an architect might refine its structure, and a technical writer might publish the final diagram in project documentation—all without rebuilding the visual from scratch.
2. Faster diagram development
Traditional drag-and-drop diagramming can become slow when a diagram contains many elements or requires frequent changes. VPasCode replaces much of that manual positioning with text-based editing.
Changing a diagram may be as simple as:
-
Adding a new participant to a sequence diagram
-
Renaming a service
-
Creating a new relationship
-
Reorganizing a system boundary
-
Changing the direction of a flow
-
Applying a different theme
-
Updating several labels at once
The editor provides a code workspace alongside a live preview, allowing users to see the visual result as they modify the source. This shortens the feedback loop between making a change and evaluating its effect.
Example
Instead of manually selecting and repositioning several architecture components, a developer can edit the text representation:
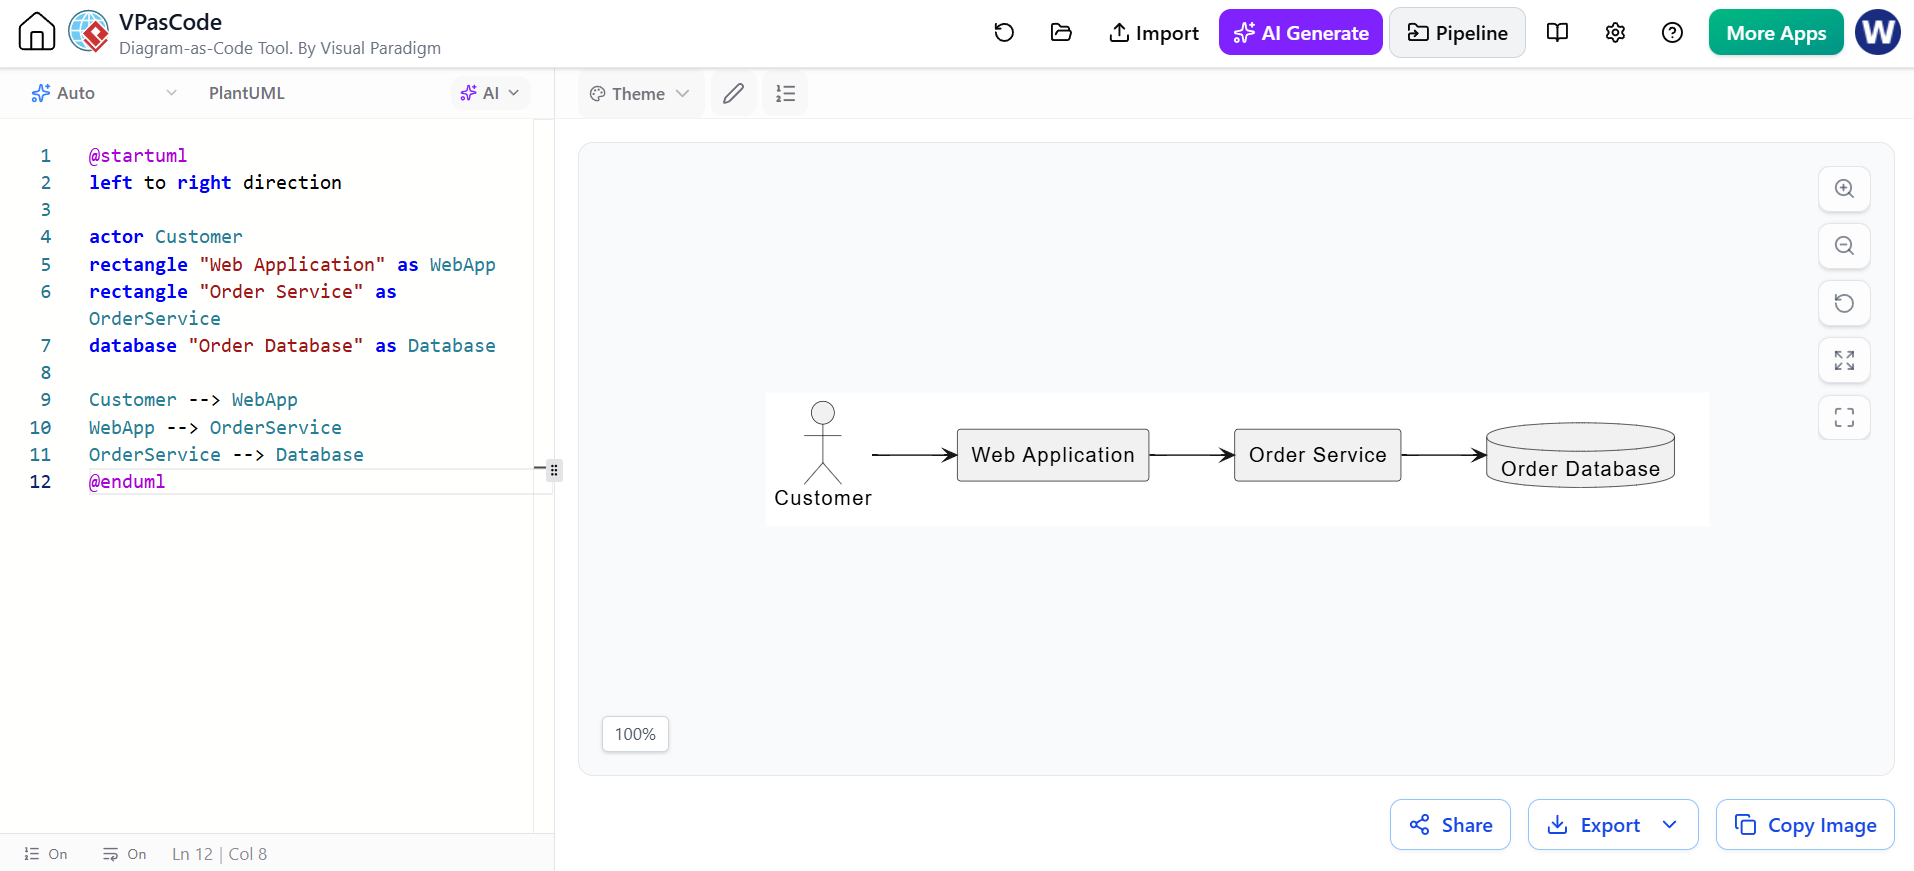
@startuml
left to right direction

actor Customer
rectangle "Web Application" as WebApp
rectangle "Order Service" as OrderService
database "Order Database" as Database

Customer --> WebApp
WebApp --> OrderService
OrderService --> Database
@enduml
Adding a new service or changing a relationship requires only a small source-code modification. The preview then reflects the updated structure.
3. Model–code alignment
One of the most important advantages of diagram-as-code is that the diagram’s source is explicit. The structure is not hidden inside manually positioned shapes; it is represented in readable text.
This improves alignment between a system’s design and its visual documentation in several ways:
-
Relationships are visible in the source.
-
Diagram changes can be reviewed line by line.
-
The same diagram can be regenerated consistently.
-
Teams can store diagram scripts with project materials.
-
Updates can be made without manually reconstructing the layout.
A diagram script can also be reviewed as part of a technical change. For example, when a new microservice is introduced, the related architecture diagram can be updated alongside the implementation or architecture decision record.
Reproducibility
If a diagram is created manually, two people may produce slightly different versions. With diagram-as-code, the same source can reproduce the same logical diagram whenever it is rendered. This is especially useful for:
-
Architecture documentation
-
API and integration maps
-
Database relationship diagrams
-
Deployment views
-
Sequence diagrams
-
Process flows
-
Technical onboarding materials
The diagram becomes a maintainable project artifact rather than a one-time image.
4. Multi-engine support
VPasCode brings multiple diagramming syntaxes into one editor. Its supported formats include PlantUML, Mermaid, D2, Graphviz, and other diagram or visualization standards.
This is valuable because different teams often prefer different diagram languages:
| Diagramming approach | Best suited for |
|---|---|
| PlantUML | UML diagrams, architecture views, sequence diagrams, class diagrams |
| Mermaid | Markdown-based documentation, flowcharts, simple architecture diagrams |
| D2 | Declarative architecture and system diagrams |
| Graphviz | Graph structures, dependency relationships, and network visualizations |
| Markmap or similar formats | Mind maps and hierarchical notes |
Instead of installing and learning a separate editor for every format, users can work with several standards in a unified environment.
Choosing the right format
Use PlantUML when formal UML notation and detailed modeling control are important. Use Mermaid when diagrams will be embedded into Markdown repositories or lightweight documentation. Use D2 for expressive architecture diagrams, and use Graphviz when the primary concern is graph layout and relationships.
The exact syntax differs between engines, but the overall workflow remains similar: write text, preview the result, revise the source, and share the finished diagram.
5. AI-assisted productivity
VPasCode includes AI features intended to reduce the time required to create and correct diagram source code. Users can describe a diagram in natural language, generate an initial draft, and then refine the result in the editor.
AI assistance can support several activities:
-
Generating an initial diagram from a description
-
Fixing syntax errors
-
Modifying an existing diagram
-
Expanding a diagram with additional components
-
Translating text labels
-
Converting an initial concept into a supported diagram format
For example, a user could request:
Create a sequence diagram for a customer logging into a web application using an authentication service and a database.
The generated result should be treated as a starting point. The user can then inspect the code, correct assumptions, clarify relationships, and apply project-specific naming and styling.
Recommended AI workflow
-
Describe the system or process clearly.
-
Specify the diagram type and preferred syntax.
-
Review the generated relationships.
-
Remove unnecessary components.
-
Correct terminology and system boundaries.
-
Apply the project’s visual style.
-
Validate the final diagram with subject-matter experts.
AI is most useful for accelerating the first draft and routine modifications. Human review remains important for architecture accuracy, security boundaries, business rules, and technical terminology.
6. Improved developer productivity
VPasCode is particularly useful for developers, architects, DevOps engineers, and technically oriented analysts because it uses a code-centered workflow.
The editor can reduce friction in several areas:
-
No need to manually arrange every object
-
Easier repetition of common structures
-
Faster updates to large diagrams
-
Greater comfort for users who prefer text editors
-
Easier reuse of templates and code snippets
-
Better compatibility with engineering documentation practices
The two-panel interface—source code on one side and rendered output on the other—supports an iterative development style similar to writing and previewing software documentation.
Suitable developer use cases
-
Designing a microservices architecture
-
Documenting an API call sequence
-
Describing authentication flows
-
Mapping cloud infrastructure
-
Creating component and deployment diagrams
-
Visualizing database relationships
-
Explaining asynchronous message flows
-
Preparing architecture review materials
7. Collaboration and knowledge sharing
Diagrams often need to be reviewed by people with different roles. Developers may inspect the source, architects may evaluate the structure, and business stakeholders may focus on the rendered visual.
VPasCode supports collaboration by making diagrams easier to share in several forms:
-
Live shareable links
-
SVG vector exports
-
PNG image exports
-
Clipboard copying for documents and communication tools
-
Embedding in technical documentation
These options make it possible to use the same diagram in a design review, project wiki, presentation, issue tracker, or team discussion.
Collaboration practices
For effective team use:
-
Use descriptive names for diagrams.
-
Add a short explanation of the diagram’s purpose.
-
Keep labels understandable to non-specialists.
-
Separate high-level architecture diagrams from detailed implementation diagrams.
-
Review important diagram changes alongside related code or documentation changes.
-
Establish conventions for colors, directions, component names, and boundaries.
A shared visual language helps teams interpret diagrams consistently across projects.
8. Professional and consistent visual output
VPasCode helps teams produce diagrams that are more consistent than individually created visuals. Users can apply themes and styles rather than formatting every element manually.
Visual Paradigm provides styling options intended to give diagrams a recognizable and professional appearance, including Visual Paradigm and Rose-style themes for PlantUML diagrams.
Consistent styling is useful for:
-
Architecture portfolios
-
Client-facing documentation
-
Training materials
-
Product specifications
-
Technical presentations
-
Internal design standards
A diagram should not merely be technically correct; it should also communicate information clearly. Good visual practices include:
-
Use left-to-right or top-to-bottom flow consistently.
-
Avoid unnecessary crossings between connectors.
-
Group related components.
-
Keep labels short.
-
Use color to communicate categories, not decoration.
-
Provide a legend when colors or symbols have special meanings.
-
Create separate diagrams for different levels of detail.
9. Documentation that stays maintainable
One of the strongest ecosystem benefits is the connection between diagram creation and documentation. VPasCode diagrams can be exported or transferred into Visual Paradigm documentation workflows, including OpenDocs.
This supports the creation of “living” technical documentation: diagrams that can be revised from their source rather than replaced manually as image files.
A maintainable documentation structure
A project documentation set might include:
-
System context diagram
Shows the system, users, external services, and major dependencies. -
Container or service diagram
Shows major applications, services, databases, and communication paths. -
Component diagram
Explains the internal structure of an important service. -
Sequence diagram
Describes the runtime behavior of a particular use case. -
Deployment diagram
Shows where components run and how infrastructure is connected. -
Process or workflow diagram
Explains business or operational behavior.
Each diagram should answer a specific question. Avoid creating one enormous diagram that attempts to explain the entire system at once.
10. Extensibility and scalability
VPasCode can support both small diagrams and complex technical visualizations. Its text-based approach scales well because users can manipulate source definitions instead of manually repositioning every visual element.
As a project grows, teams can use:
-
Reusable templates
-
Standard naming conventions
-
Shared style rules
-
Consistent diagram types
-
Separate views for different audiences
-
Modular diagrams focused on specific subsystems
Scaling guidelines
For small projects, a simple flowchart or component diagram may be sufficient. For larger systems, use multiple diagrams with clearly defined purposes.
A useful hierarchy is:
-
Level 1: Business and system context
-
Level 2: Applications, services, and data stores
-
Level 3: Components and internal responsibilities
-
Level 4: Detailed interactions and implementation behavior
This approach preserves readability while still allowing technical depth.
11. Export and delivery options
Once a diagram is complete, VPasCode provides several ways to distribute it:
-
SVG: Best for scalable web graphics and technical documentation.
-
PNG: Convenient for presentations, tickets, reports, and collaboration tools.
-
Shareable URL: Useful when recipients need access to the live diagram or source.
-
Clipboard copy: Helpful for quickly inserting a diagram into an email, document, or chat.
SVG is generally preferable when the diagram may be resized. PNG is convenient when broad compatibility is more important than editability. A live link is useful when reviewers need to inspect or continue refining the diagram.
12. Recommended end-to-end workflow
The following process combines the benefits shown in the infographic into a repeatable working method.
Step 1: Define the communication goal
Before writing diagram code, decide what the diagram must explain.
Examples:
-
How a customer request moves through the system
-
Which services communicate with one another
-
How data is stored and retrieved
-
How users interact with a product
-
Where software components are deployed
A clear goal prevents the diagram from becoming overloaded.
Step 2: Select the appropriate diagram type
Choose a format based on the question you need to answer:
-
Use a context diagram for system boundaries.
-
Use a component diagram for structural organization.
-
Use a sequence diagram for time-ordered interactions.
-
Use a deployment diagram for infrastructure.
-
Use a flowchart for decisions and processes.
-
Use an entity relationship diagram for data structure.
Step 3: Choose a diagram language
Select PlantUML, Mermaid, D2, Graphviz, or another supported format based on your team’s needs, documentation environment, and desired level of control.
Step 4: Create an initial draft
Start with the minimum necessary elements. Include only the actors, components, systems, and relationships required to communicate the main idea.
Step 5: Use the live preview
Check the rendered result while editing. Look for:
-
Overlapping elements
-
Long or confusing connectors
-
Inconsistent naming
-
Excessive detail
-
Poor visual hierarchy
-
Ambiguous relationships
Step 6: Refine the structure and appearance
Improve the diagram by:
-
Grouping related elements
-
Changing the direction of the layout
-
Applying a consistent theme
-
Shortening labels
-
Removing redundant relationships
-
Adding boundaries or notes
-
Separating complex views into multiple diagrams
Step 7: Validate the content
Ask a technical or business reviewer to confirm that:
-
Relationships are accurate
-
Names match the actual system
-
External dependencies are represented correctly
-
Data flows are not misleading
-
Security or trust boundaries are clear
Step 8: Publish and share
Export the diagram or connect it to project documentation. Use SVG for scalable documentation, PNG for presentations, and shareable links for collaborative review.
Step 9: Maintain the source
Keep the diagram source with the relevant project documentation or repository. Update it whenever important architecture, workflow, or implementation changes occur.
13. Example use case: documenting an online order system
Suppose a team needs to document an online ordering system. The workflow might include:
-
Customer submits an order.
-
Web application sends the order to an order service.
-
Order service requests payment authorization.
-
Payment service communicates with an external provider.
-
Approved orders are stored in the order database.
-
A notification service sends confirmation to the customer.
A sequence diagram could represent the runtime interaction, while a component diagram could show the stable architecture.
A simple PlantUML sequence diagram might look like this:
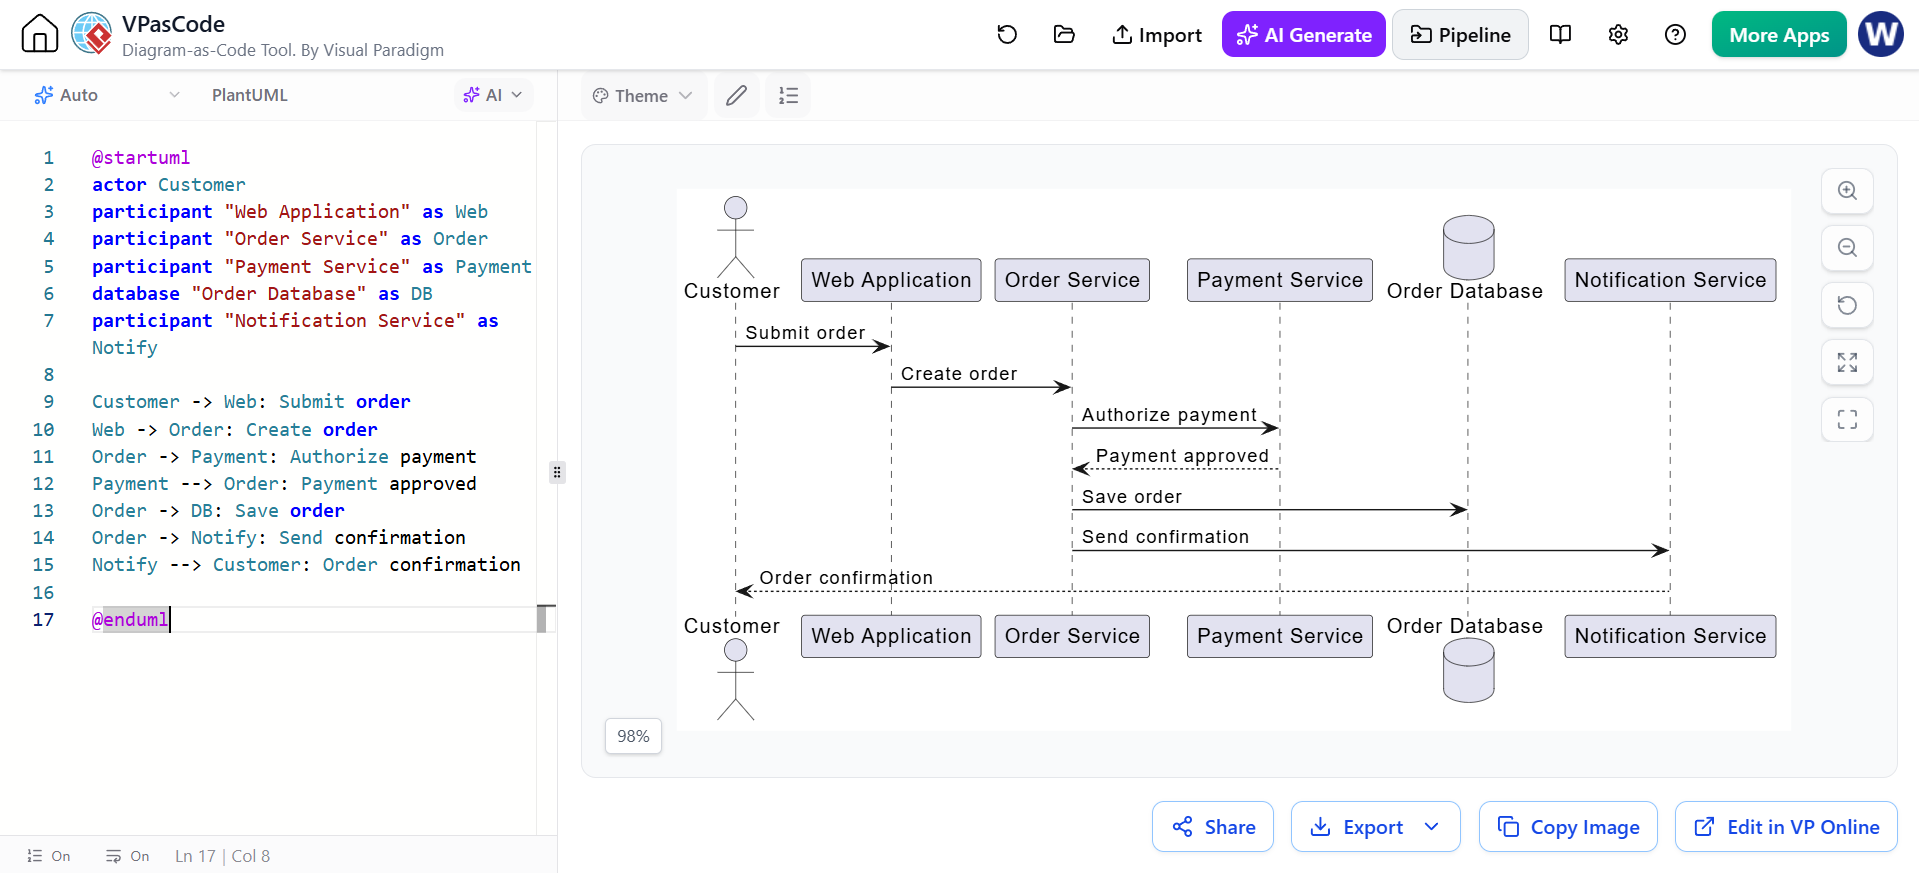
@startuml
actor Customer
participant "Web Application" as Web
participant "Order Service" as Order
participant "Payment Service" as Payment
database "Order Database" as DB
participant "Notification Service" as Notify

Customer -> Web: Submit order
Web -> Order: Create order
Order -> Payment: Authorize payment
Payment --> Order: Payment approved
Order -> DB: Save order
Order -> Notify: Send confirmation
Notify --> Customer: Order confirmation

@enduml
The diagram can then be refined by adding error paths, payment rejection, inventory validation, or asynchronous messaging.
14. Governance and best practices
Organizations using VPasCode at scale should establish lightweight standards.
Naming standards
Use names that are:
-
Consistent with the codebase
-
Understandable to the intended audience
-
Specific enough to avoid ambiguity
-
Stable over time
Versioning standards
Store diagram source with project artifacts where possible. Review significant diagram changes as part of the same process used for architecture or documentation changes.
Review standards
A diagram review should consider both:
-
Structural accuracy: Does it represent the system correctly?
-
Communication quality: Can the intended audience understand it quickly?
Security standards
Avoid placing sensitive credentials, private keys, tokens, or confidential personal information in diagram source or labels. Use abstract names when a detailed identifier is unnecessary.
15. Measuring the benefits
Teams can evaluate the impact of VPasCode using practical indicators:
-
Time required to create a first draft
-
Time required to update an existing diagram
-
Number of duplicated diagrams across tools
-
Frequency of outdated documentation
-
Time spent correcting layout problems
-
Number of stakeholders able to review the diagram
-
Reuse of templates and diagram source
-
Reduction in manual image editing
The greatest benefit is usually not simply faster diagram creation. It is the ability to keep diagrams closer to the development and documentation lifecycle.
Conclusion
VPasCode strengthens Visual Paradigm’s ecosystem by combining the precision of code with the communication power of diagrams. Its unified editor, live preview, multi-engine support, AI assistance, collaboration features, export options, and documentation connections make it useful across the full lifecycle of a project.
The six central benefits are:
-
Seamless ecosystem integration: Move from AI-assisted ideation to refinement and documentation.
-
Faster development: Edit diagram structures through text and preview changes immediately.
-
Model–code alignment: Keep diagram definitions explicit, reproducible, and maintainable.
-
AI-assisted productivity: Generate, correct, modify, and translate diagram content more efficiently.
-
Team collaboration: Share diagrams through links, exports, documentation, and presentations.
-
Extensibility and scalability: Support multiple diagram languages, reusable templates, and projects of varying size.
Used effectively, VPasCode turns diagrams from static illustrations into maintainable technical assets that evolve with the systems they describe.
This post is also available in Deutsche, Español, فارسی, Français, English, Bahasa Indonesia, 日本語, Ру́сский, Việt Nam, 简体中文 and 繁體中文.
