




Mastering Data Flow Diagrams: A Comprehensive Guide to AI-Assisted Top-Down Decomposition with Visual Paradigm
Introduction
In the realm of complex system design and product management, clear data visualization is paramount for ensuring team alignment and successful technical implementation. Data Flow Diagrams (DFDs) serve as a cornerstone tool for system analysts and product managers, providing a graphical representation of how data moves through an information system. However, manually creating detailed, multi-level DFDs is often time-consuming and prone to logical inconsistencies across different hierarchy levels.
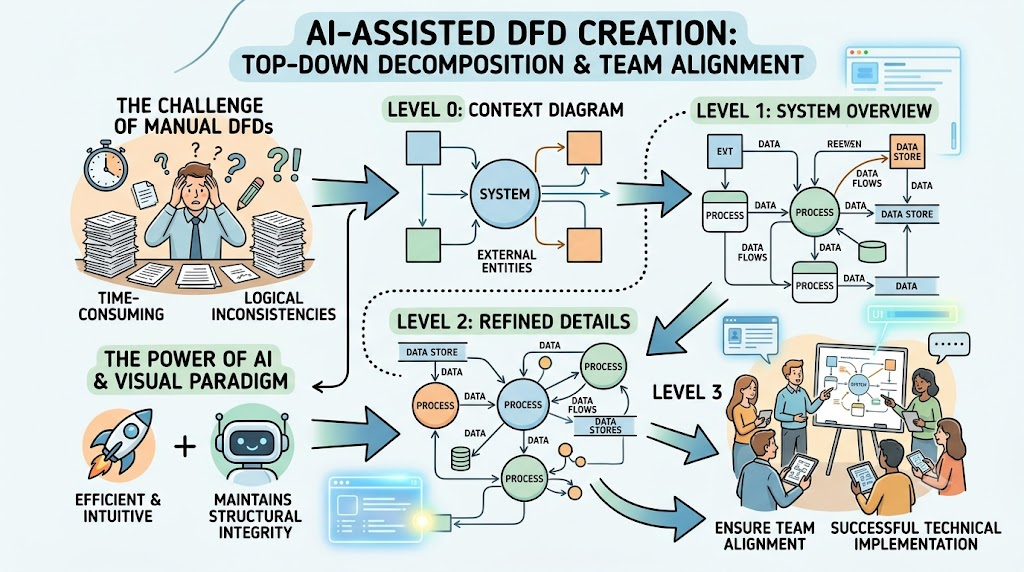
With the advent of AI-assisted modeling tools like the Visual Paradigm (VP) AI Chatbot, this process has become significantly more efficient and intuitive. This guide combines fundamental DFD theory with practical application, offering a step-by-step tutorial on leveraging VP AI to create data flow diagrams using Top-Down Decomposition. From generating initial context diagrams to refining granular Level 3 details, you will learn how to use intelligent prompts to maintain structural integrity while exploring complex system logic.
Part 1: Understanding Data Flow Diagrams (DFD)
What is a Data Flow Diagram?
A Data Flow Diagram (DFD) graphically represents the flow of data in a business information system. It describes the processes involved in transferring data from input sources to file storage and report generation. DFDs are categorized into two types:
-
Logical DFD: Describes the flow of data through a system to perform specific business functionality, independent of technology.
-
Physical DFD: Describes the actual implementation of the logical flow, including hardware, software, and manual procedures.
Why Use DFDs?
DFDs visualize functions that capture, manipulate, store, and distribute data. Their visual nature makes them an excellent communication tool between users and system designers. Key benefits include:
-
Clarifying the logical information flow of the system.
-
Determining physical system construction requirements.
-
Establishing requirements for both manual and automated systems.
-
Providing a simple notation that allows starting from a broad overview and expanding into detailed hierarchies.
The Four Basic Symbols of DFD
There are four fundamental symbols used to construct a DFD:
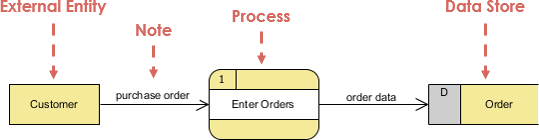
1. Process
A process receives input data and produces output with different content or form. Every process must have a name consisting of a verb followed by a singular noun (e.g., Apply Payment, Calculate Commission).
-
Notation: A rounded rectangle.
-
Rule: At least one data flow must enter and one must exit each process.

Process Example:
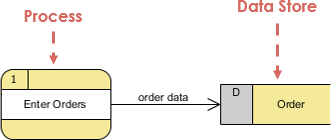
2. Data Flow
A data flow is a path for data to move from one part of the system to another. It can represent a single element (e.g., Customer ID) or a structure (e.g., Order Info).
-
Notation: Straight lines with arrows. Incoming arrows indicate input; outgoing arrows indicate output.
-
Rule: All flows must begin and end at a processing step. Data cannot transform on its own.
Common Mistakes in Data Flow:
-
Entity to Entity: An entity cannot provide data to another entity without processing.
-
Entity to Data Store: Data cannot move directly from an entity to a data store without being processed.
-
Data Store to Data Store: Data cannot move directly between stores without processing.
| Wrong | Right | Description |
|---|---|---|
 |
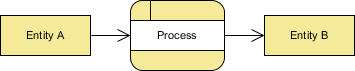 |
An entity cannot provide data to another entity without some processing occurred. |
 |
 |
Data cannot move directly from an entity to a data store without being processed. |
 |
 |
Data cannot move directly from a data store without being processed. |
 |
 |
Data cannot move directly from one data store to another without being processed. |
Other Frequent Mistakes:
-
Black Holes: A process with input flows but no output flows.
-
Miracles: A process with output flows but no input flows.
-
Grey Holes: A process where outputs are greater than the sum of inputs.
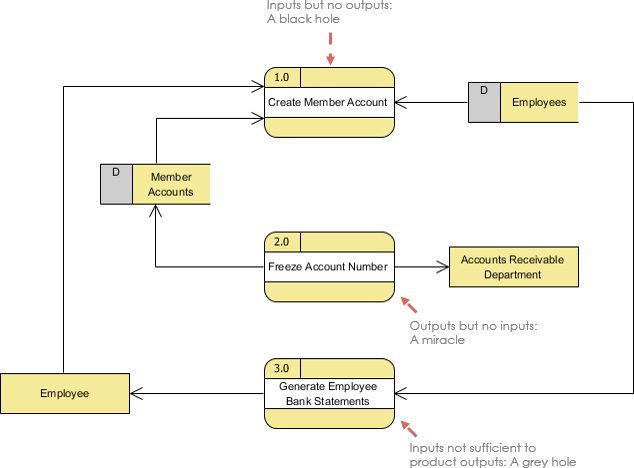
Data Flow Example:
3. Data Store
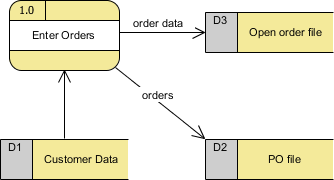
A data store represents a situation where the system must retain data for later use by one or more processes. Examples include Inventory, Accounts Receivable, and Orders.
-
Notation: Two parallel lines or a rectangle with an open side (depending on standard), often represented as a record shape in modern tools.
-
Rule: Must be connected to a process via a data flow. Must have at least one input and one output flow.

Data Store Example:
4. External Entity
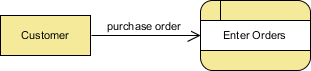
An external entity is a person, department, or outside system that provides data to or receives data from the system. They are also known as terminators.
-
Notation: A rectangle.
-
Rule: Must be connected to a process through a data flow. They do not process data themselves.

External Entity Example:
Logical vs. Physical Data Flow Diagrams
| Feature | Logical DFD | Physical DFD |
|---|---|---|
| Focus | Business activities and functions. | System implementation (hardware, software, people). |
| Technology | Independent of technology. | Specifies technology, files, and manual steps. |
| Detail | High-level business events. | Detailed steps, sequencing, and temporary storage. |
| Benefits | Stable, easier to communicate with users, easier to maintain. | Clarifies manual vs. automated tasks, specifies file names, adds controls. |
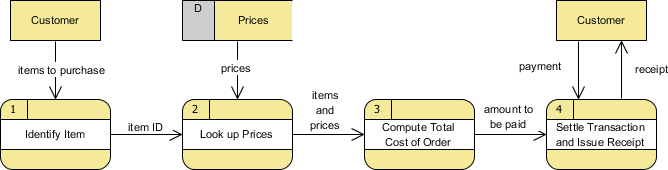
Logical DFD Example – Grocery Store:
Illustrates processes without physical implementation details.
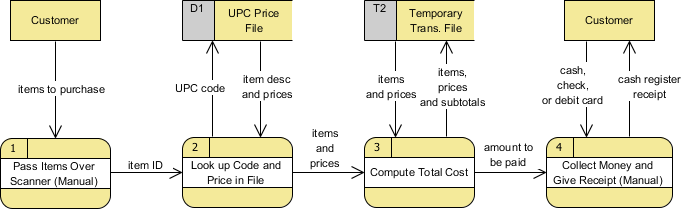
Physical DFD Example – Grocery Store:
Shows bar code scanning, manual processes, payment methods (Cash/Card), and specific receipt names.
Guidelines for Developing DFDs
-
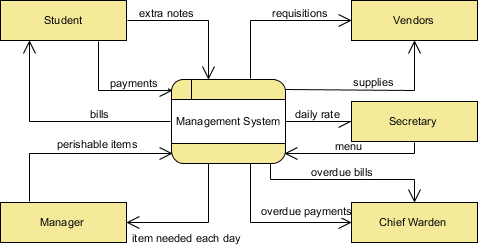
Context Diagram (Level 0): Fits on one page, contains only one process representing the entire system, shows all external entities and major data flows, but no data stores.
-
Unique Names: Use unique names for entities and processes within each level.
-
No Cross Lines: Restrict the number of processes to avoid crossing lines. Duplicate entities/stores if necessary, marked with an asterisk.
-
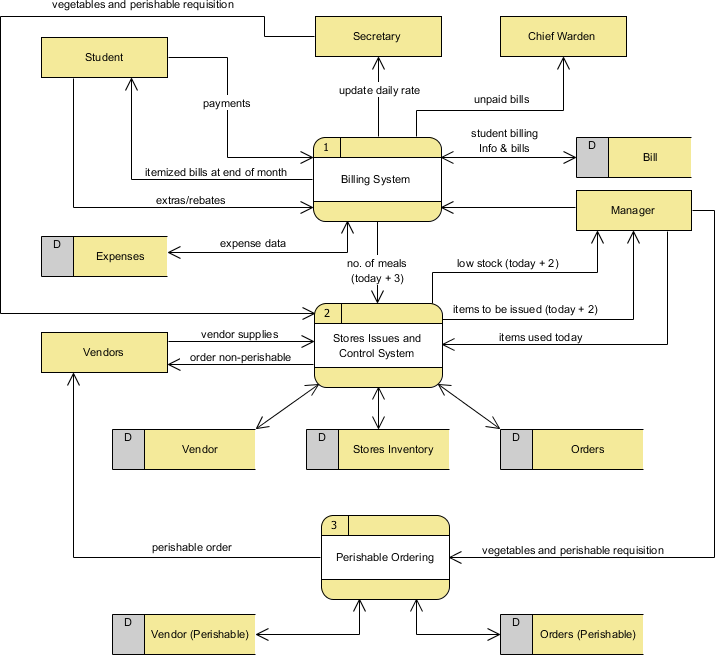
Complexity: Keep lower-level diagrams to 7 +/- 2 symbols (max 9 processes) for human readability.
-
Numbering Convention: Use hierarchical numbering (1, 1.1, 1.1.1).
-
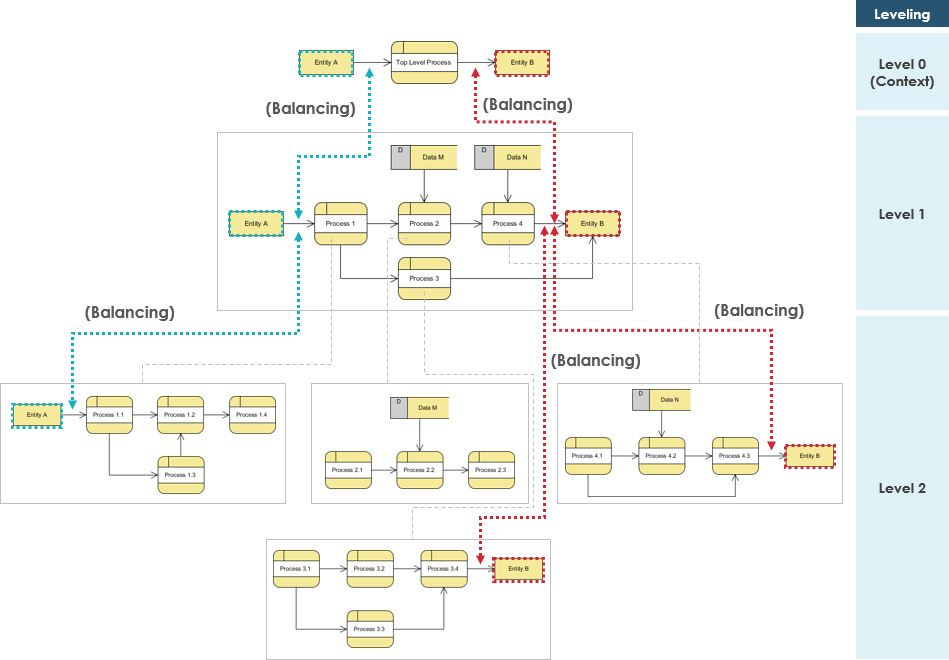
Balancing: Inputs and outputs must be conserved between parent and child diagrams (Level n and Level n+1 must match).
Context DFD Example:
Level 1 DFD Example:
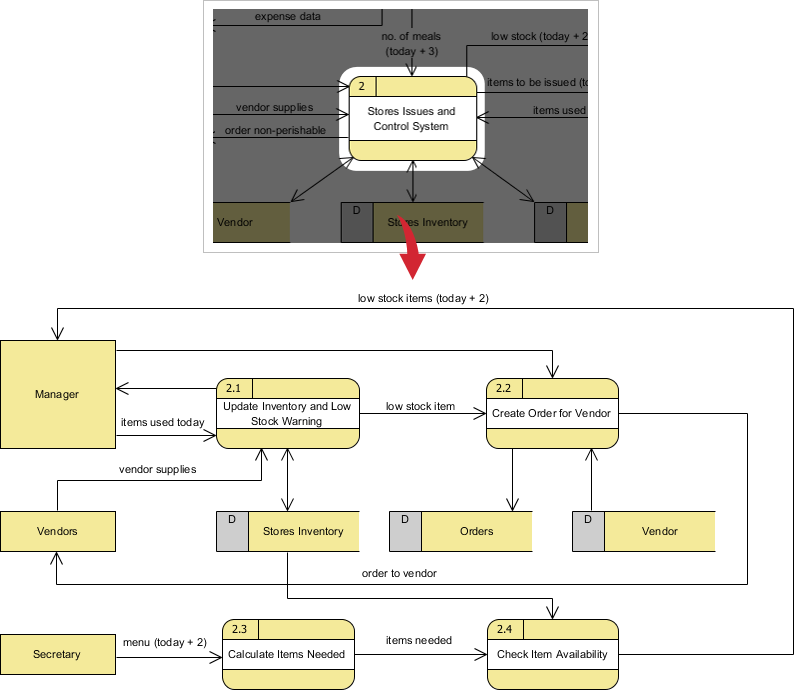
Level 2 DFD Example:
Part 2: AI-Assisted DFD Modeling with Visual Paradigm
While understanding the theory is crucial, applying it to complex systems can be challenging. The Visual Paradigm (VP) AI Chatbot streamlines this process by allowing you to generate and refine DFDs through natural language commands. Below is a step-by-step tutorial using an Online Order Process System as a case study.
Step 1: Accessing the VP AI Chatbot
-
Open your project in Visual Paradigm.
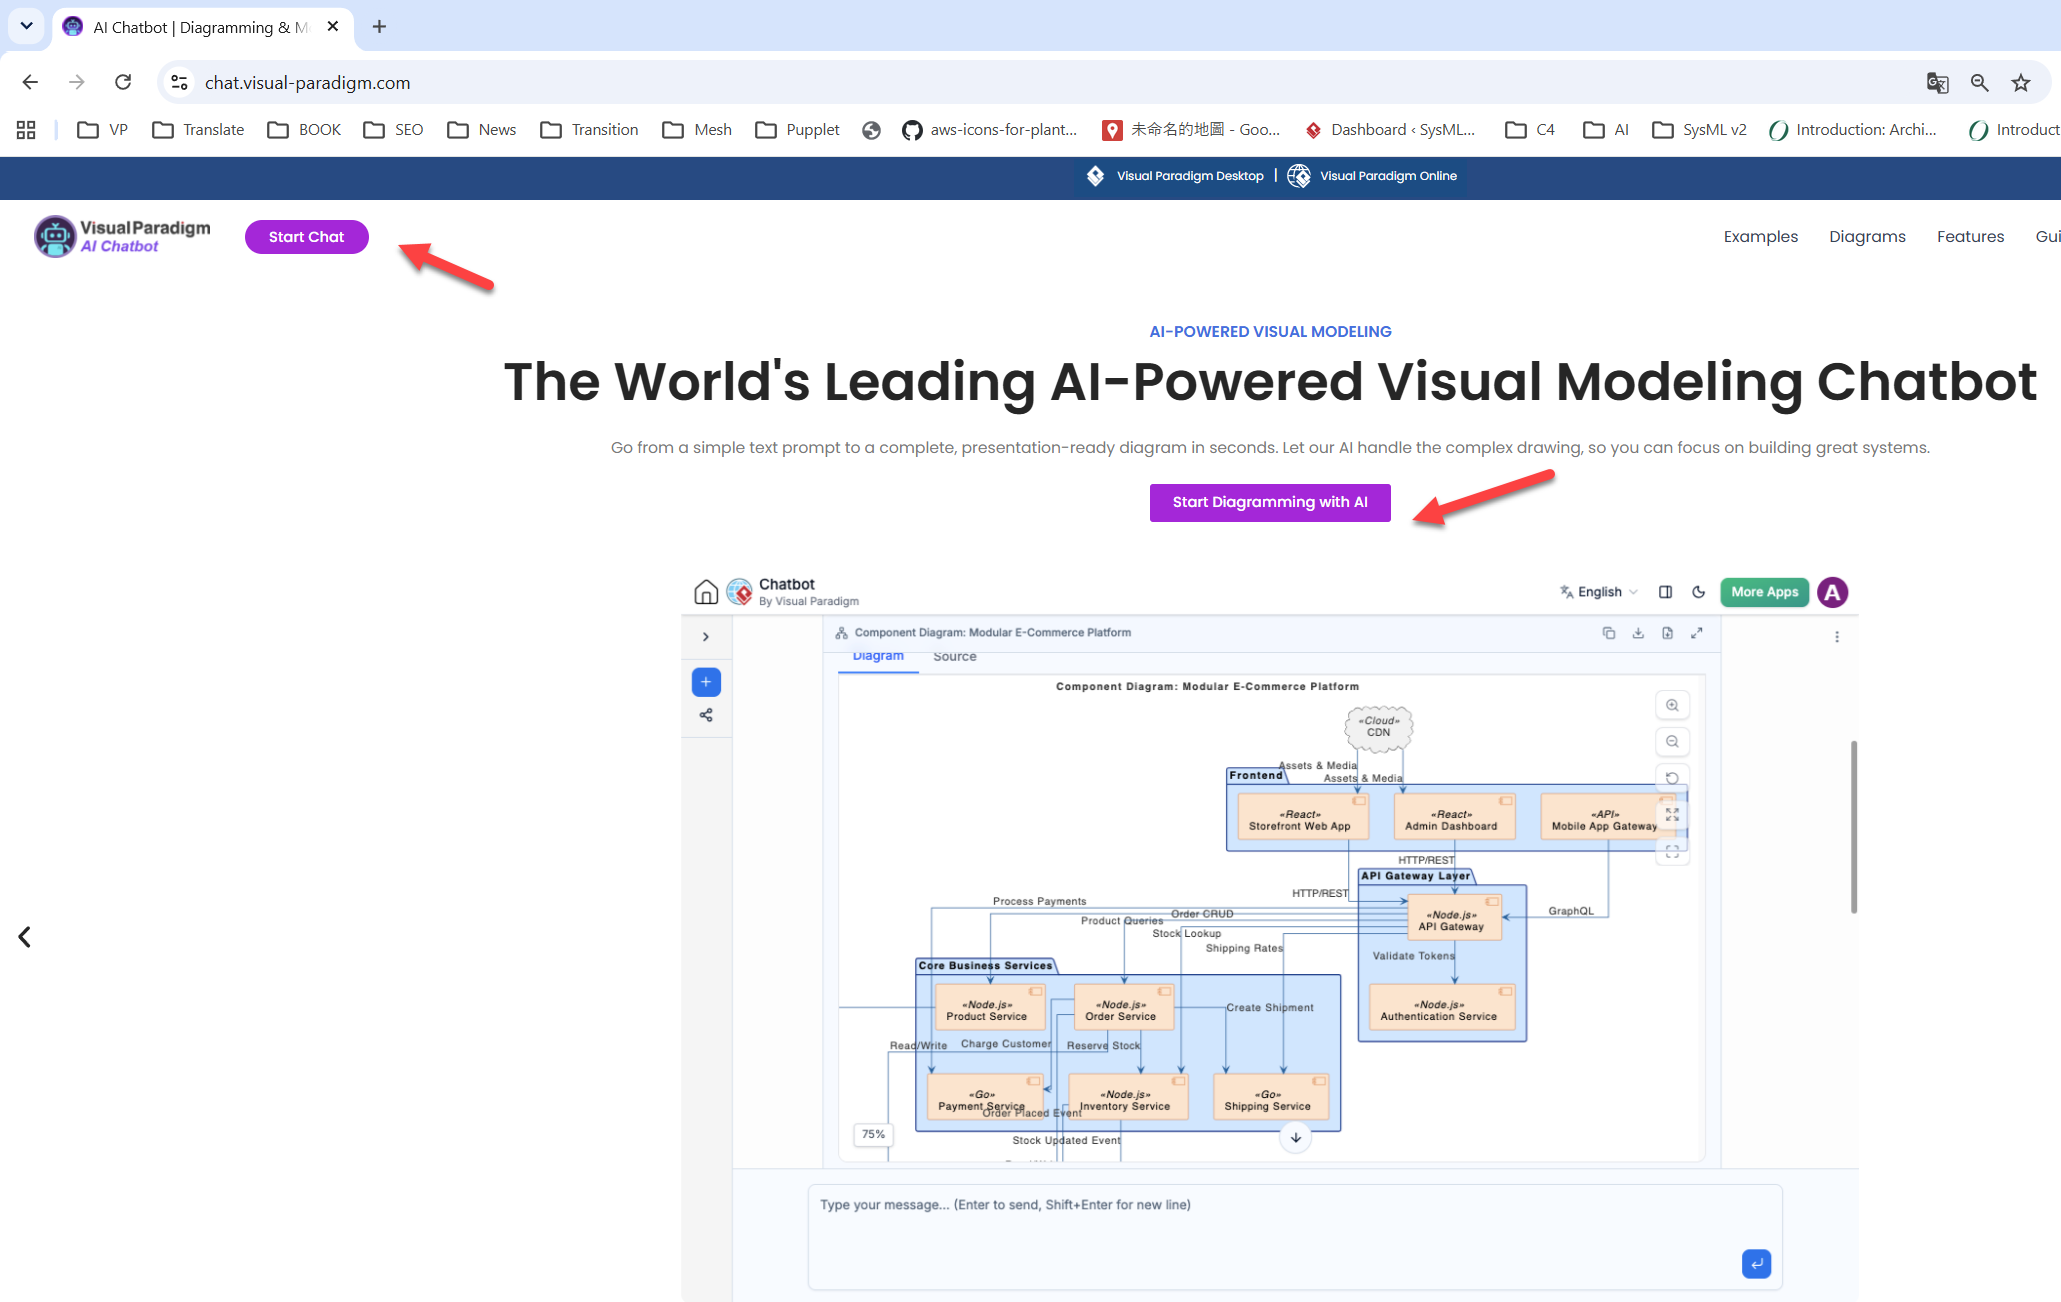
-
Locate the AI assistant panel.
-
Click “Start Chat” to initiate the session.
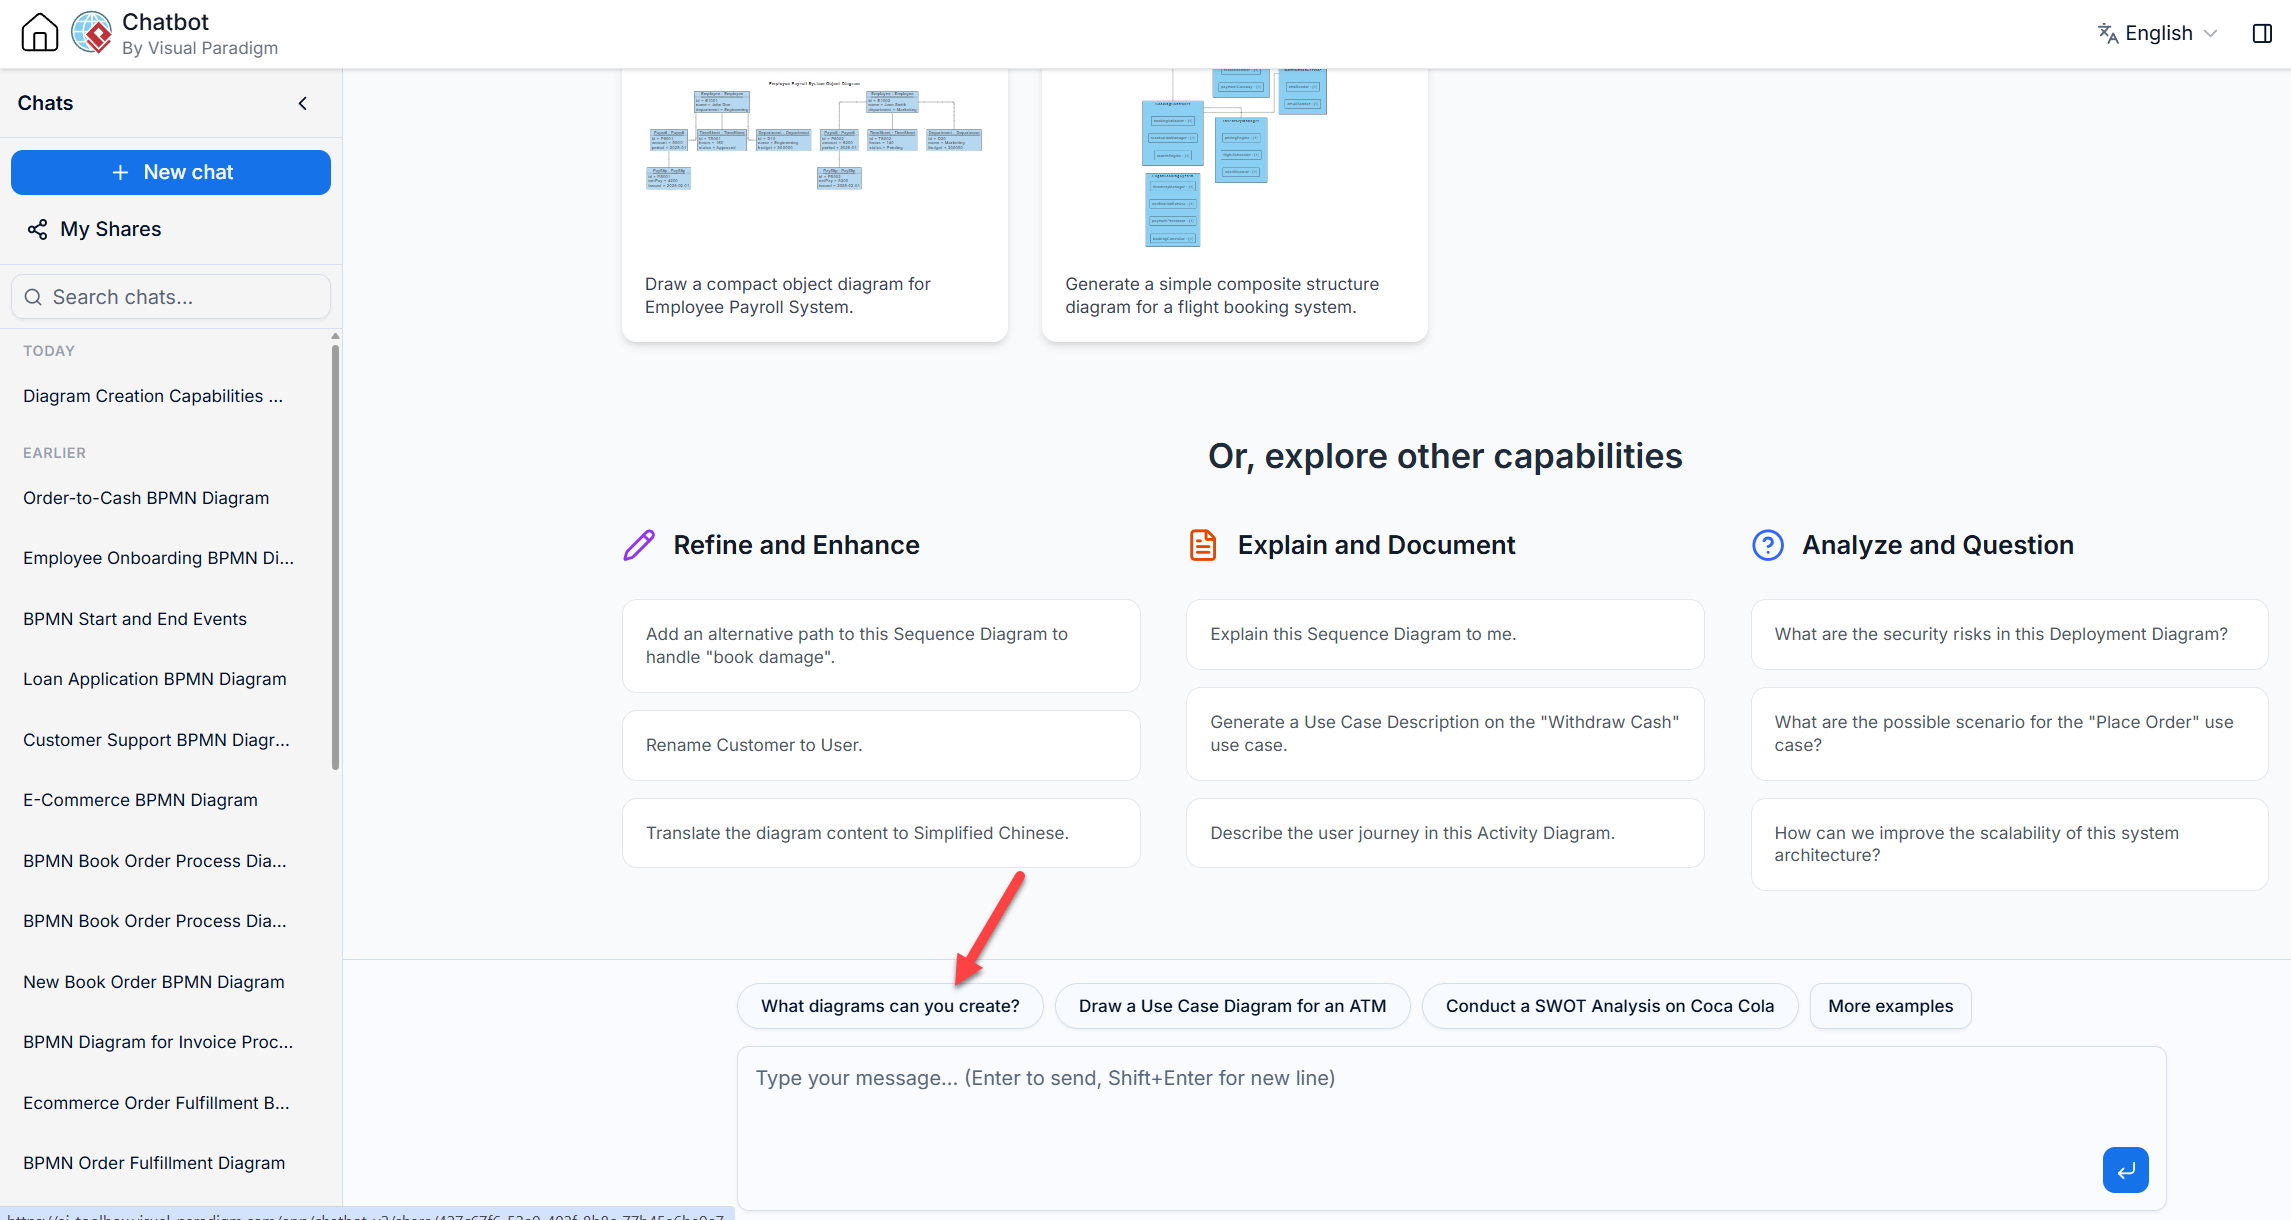
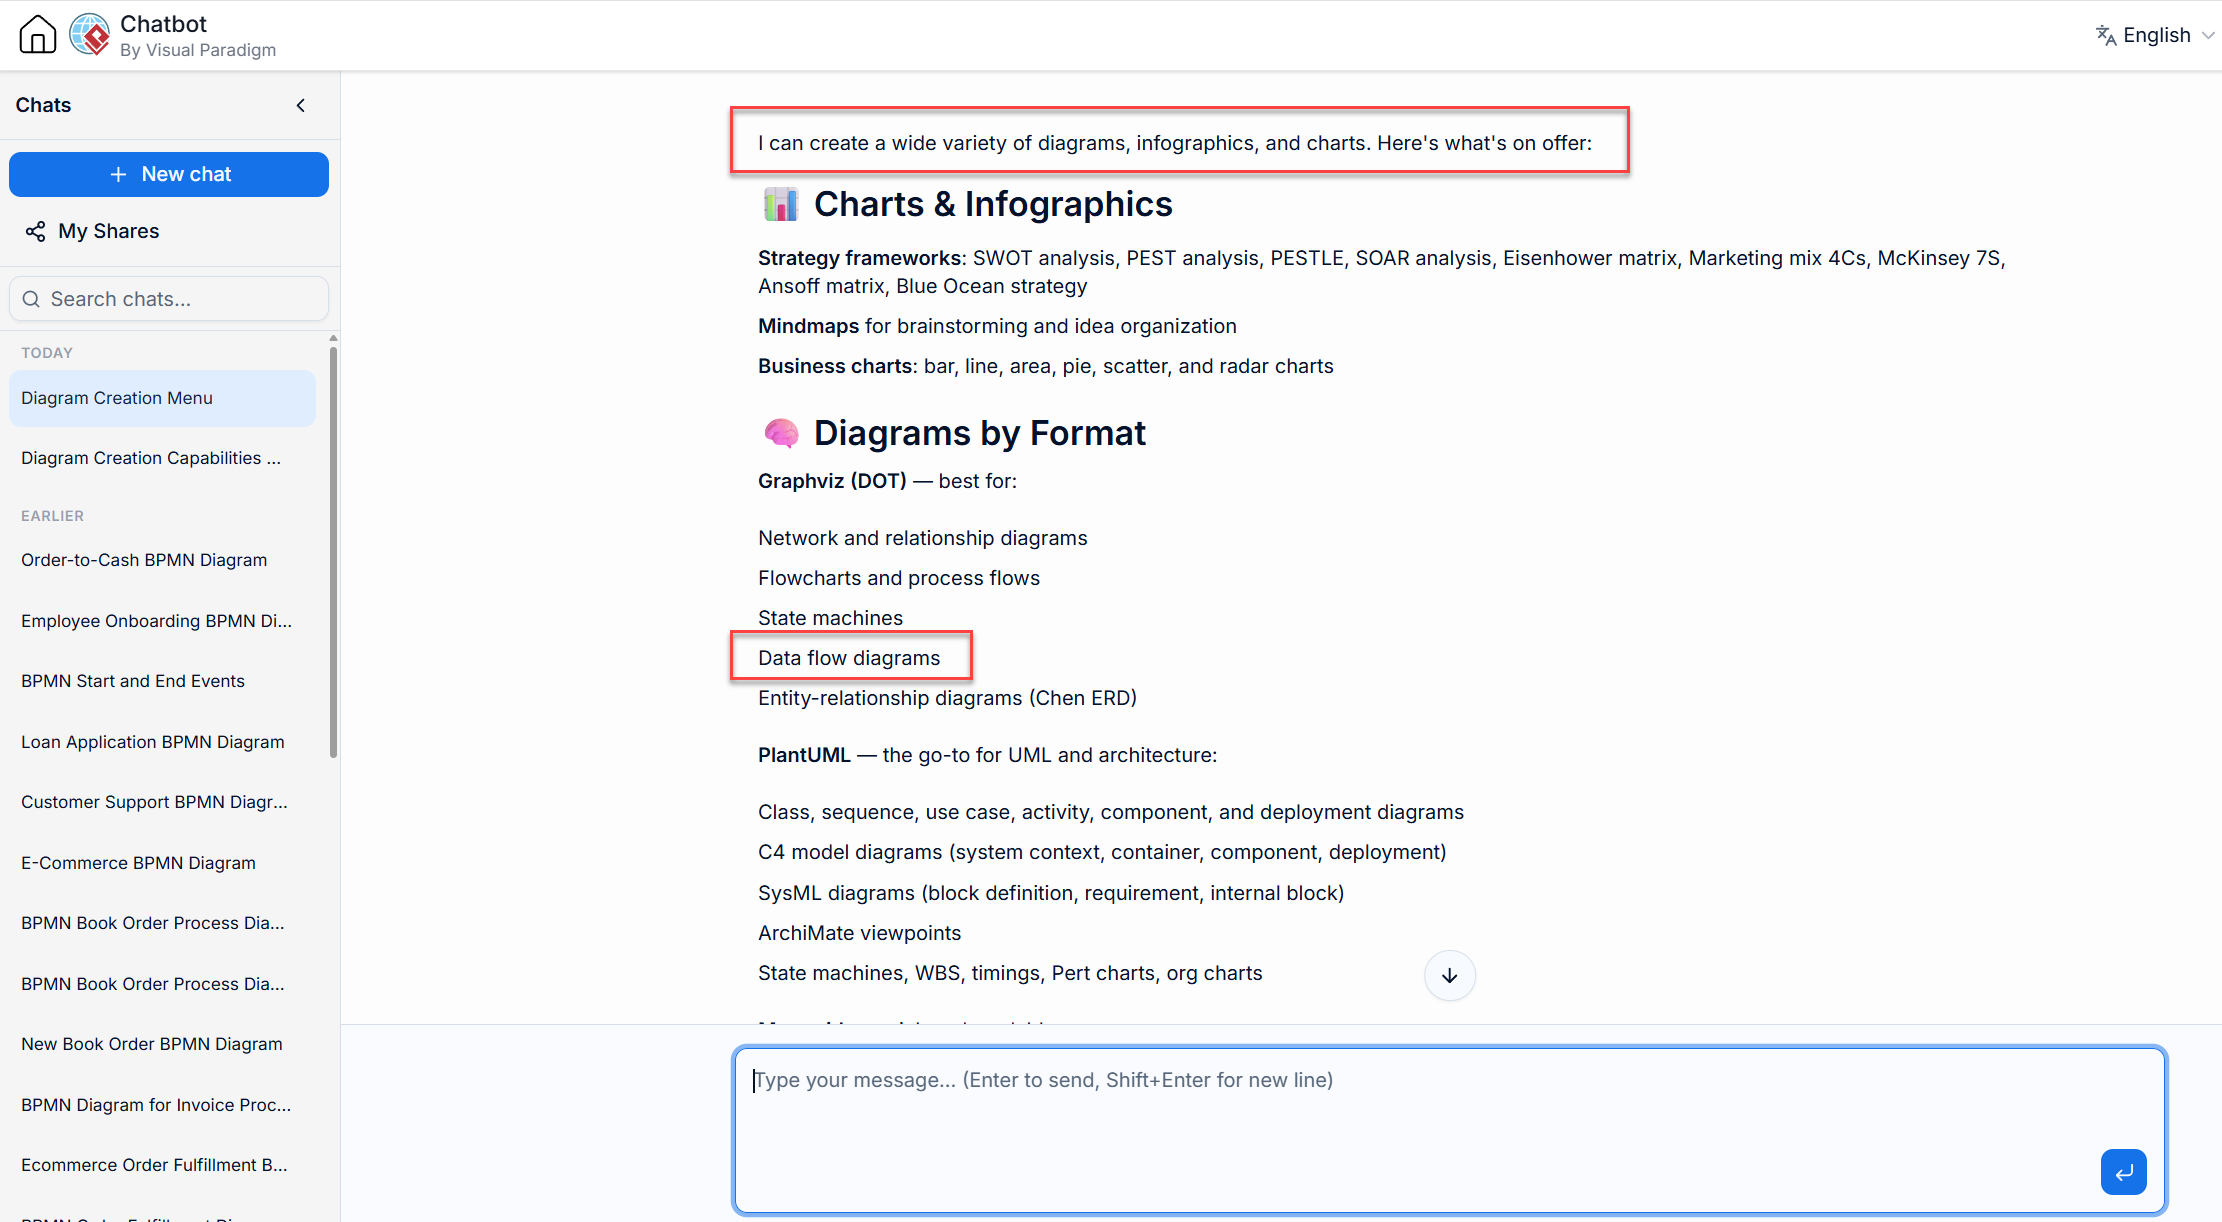
If you are new, you can ask “What Diagram Can you Create?” to see supported types, including UML, BPMN, and DFDs.
Step 2: Generating Level 1 DFD (Top-Level View)
The first step in top-down decomposition is establishing the high-level view, defining external entities, main processes, and major data stores.
Prompt:
“Draw A DFD for a Online Order Process system”
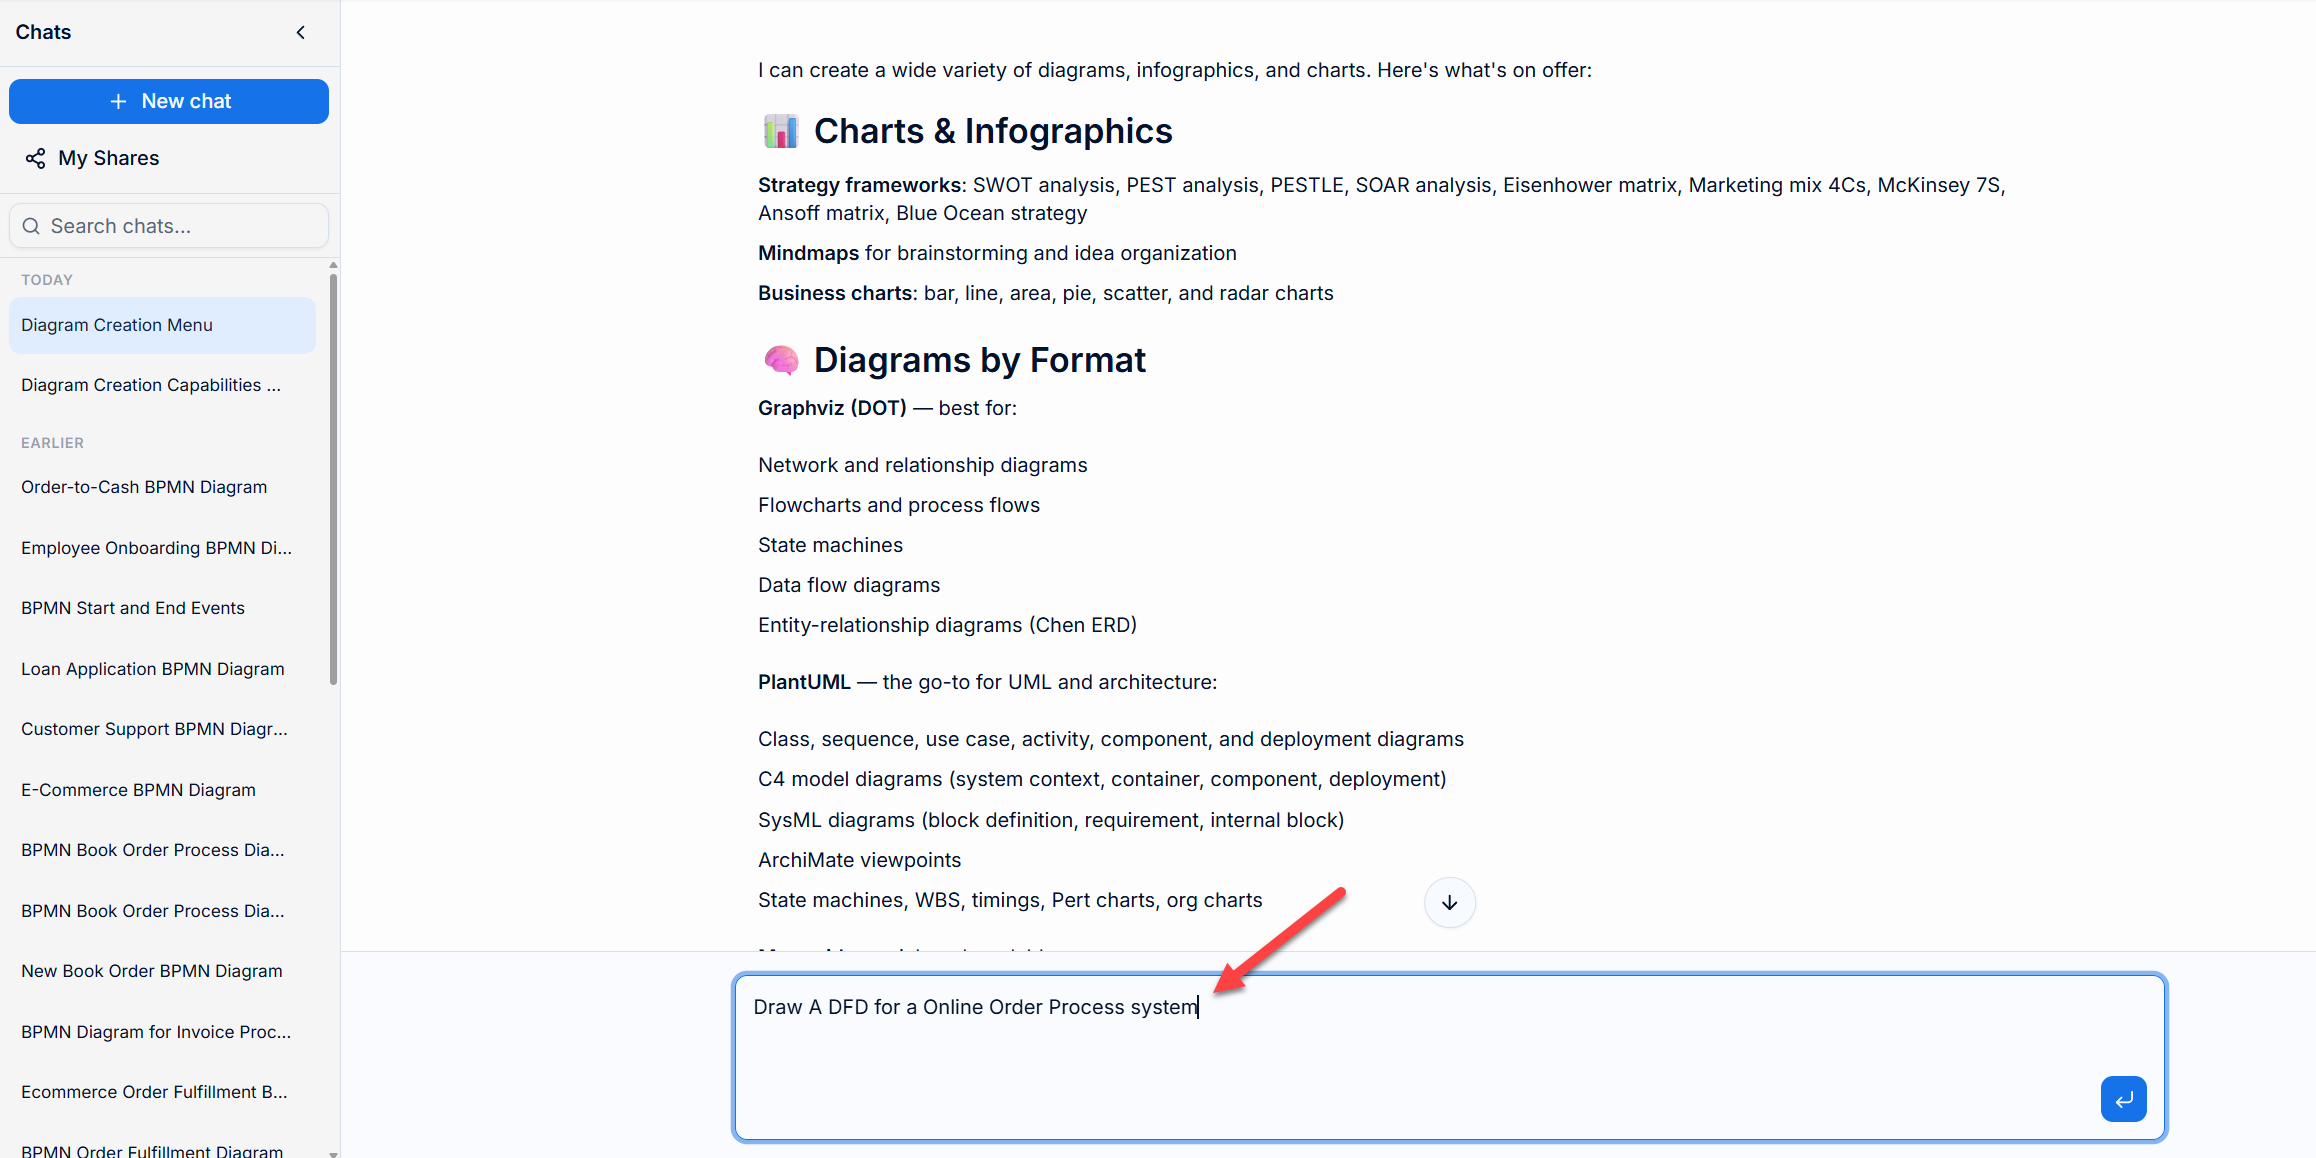
The VP AI Chatbot analyzes the request and generates a Level 1 DFD.
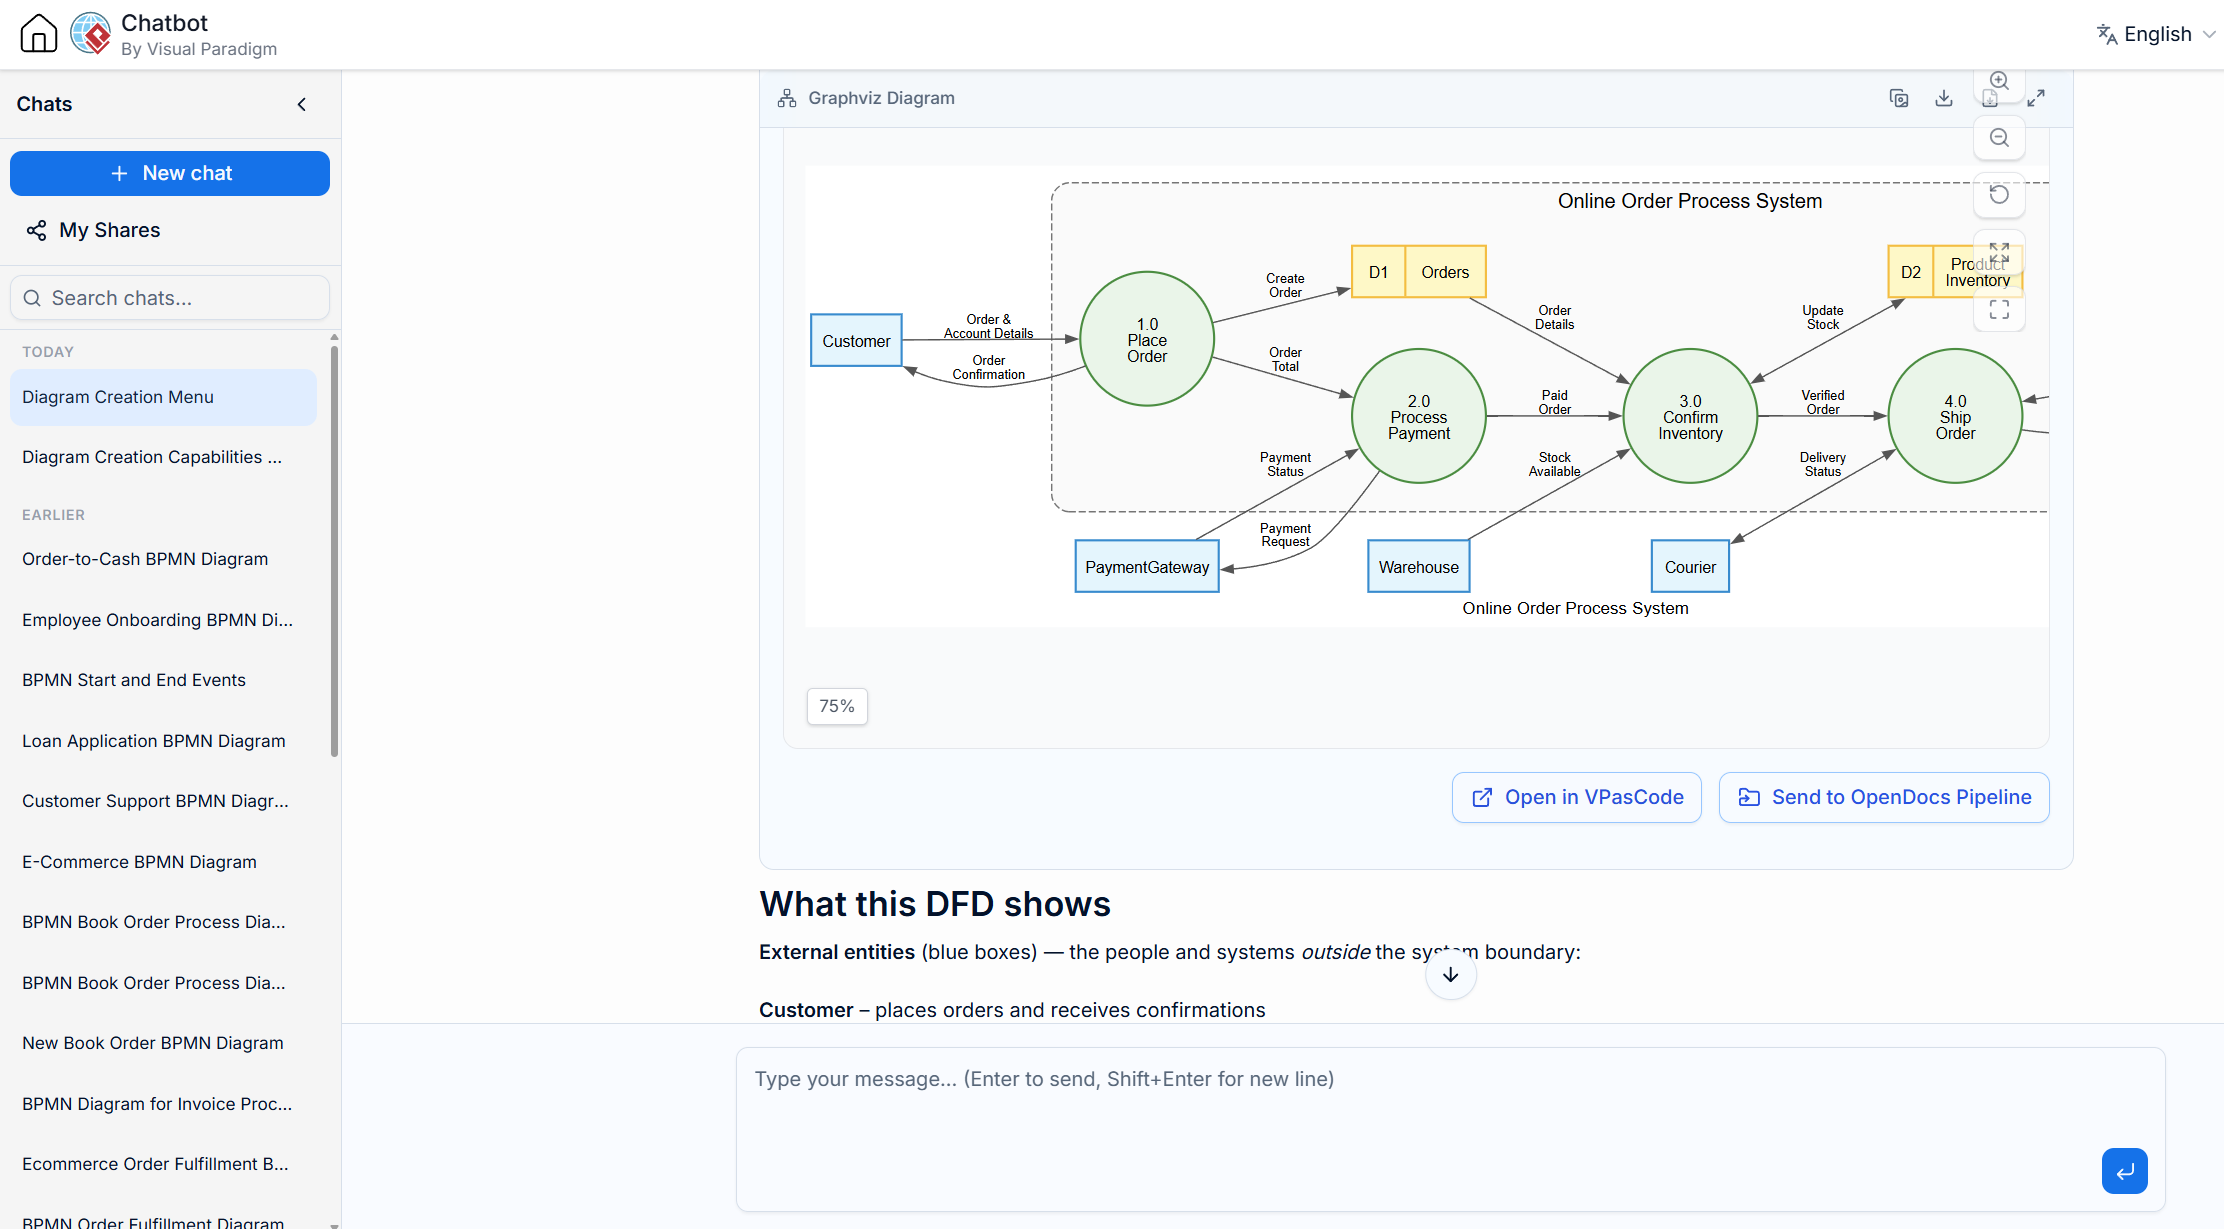
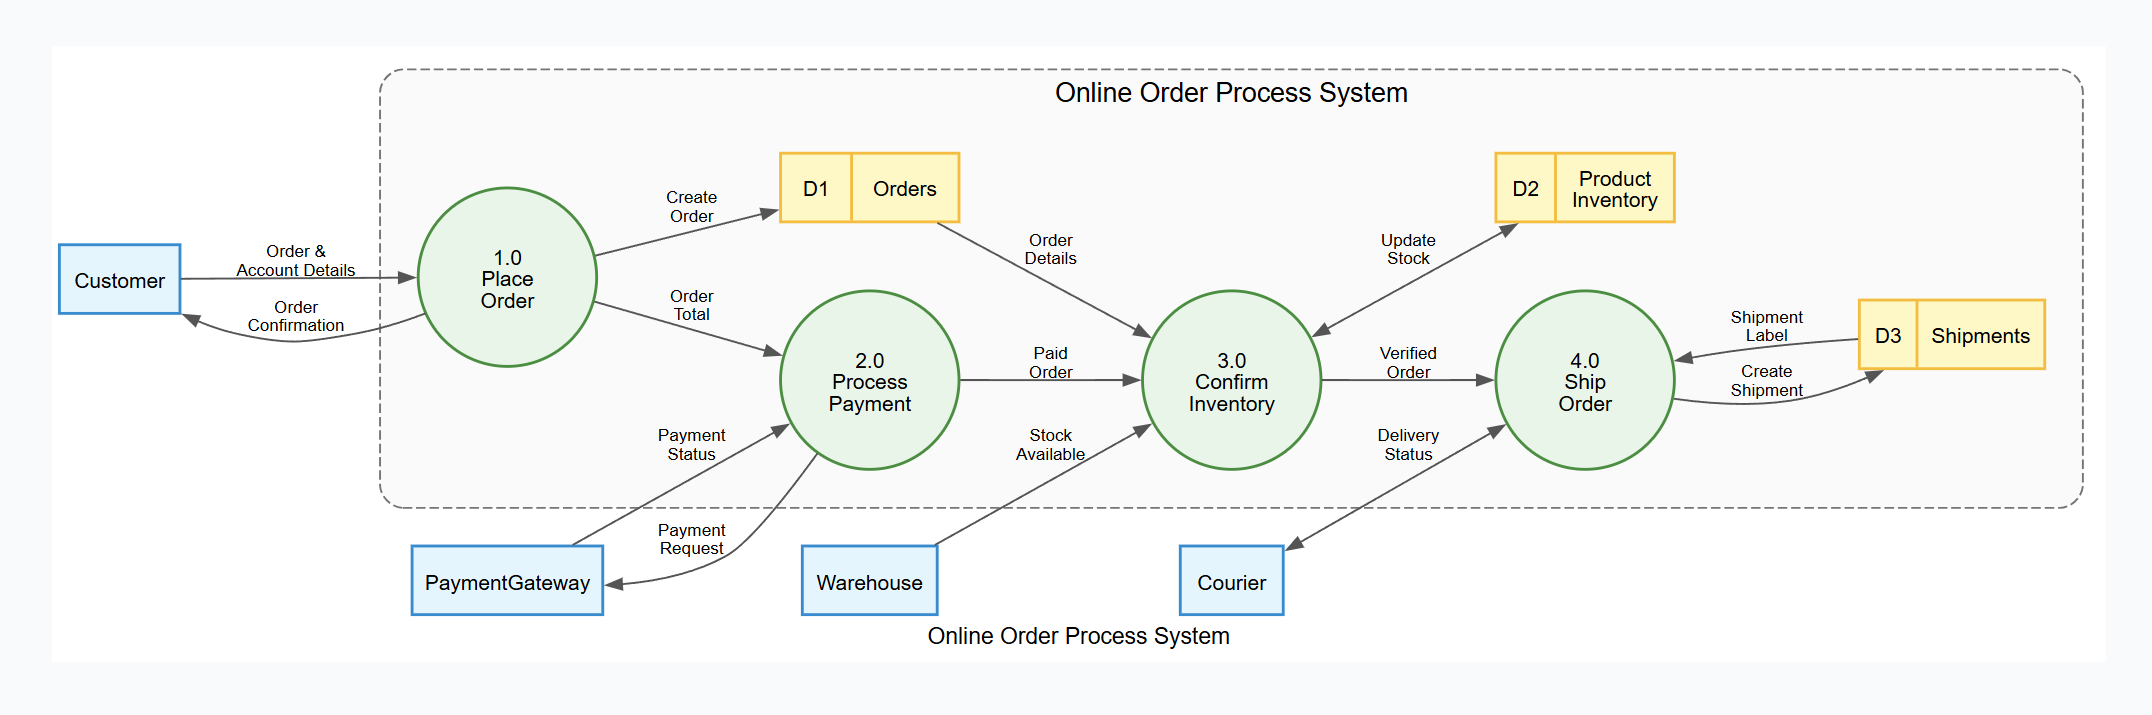
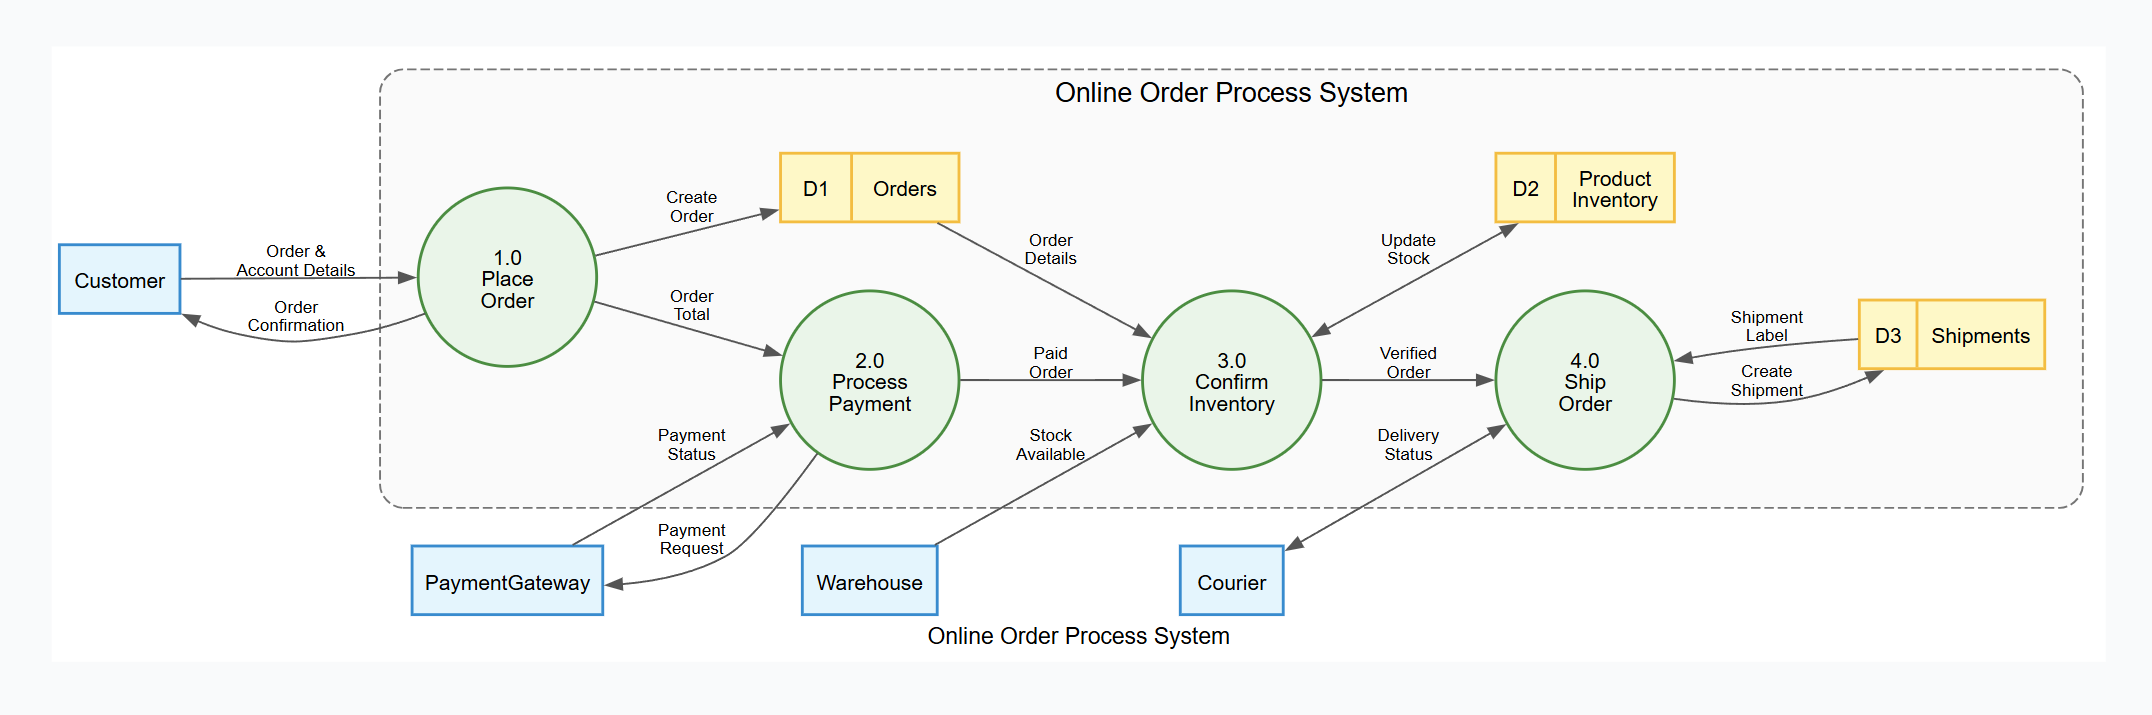
The Generated Level 1 DFD:
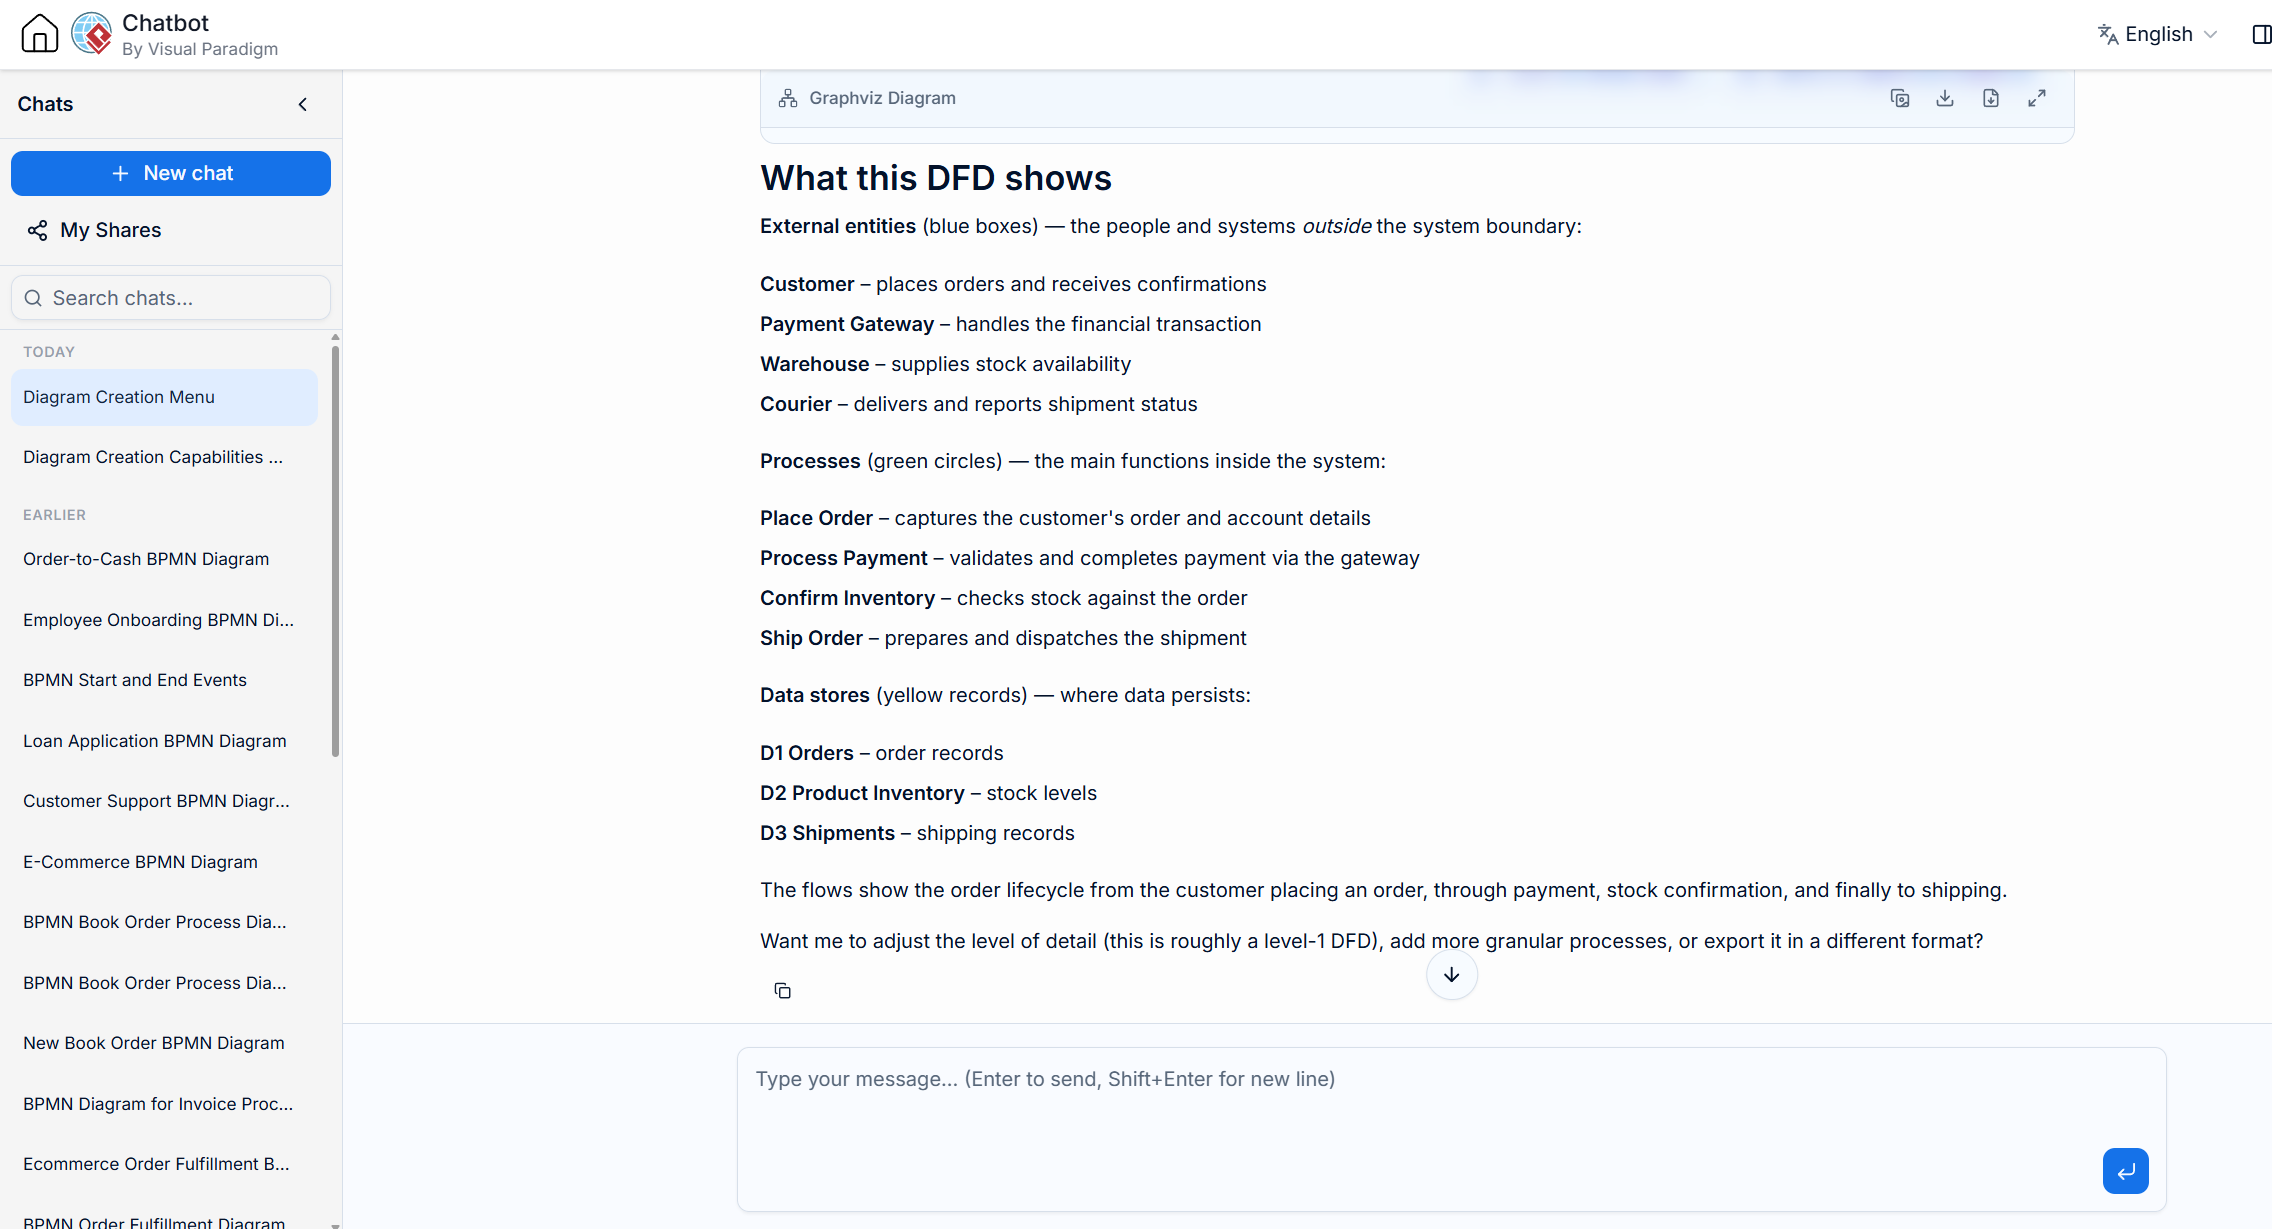
The AI also provides a text summary of the components:
Under the Hood: Diagram as Code
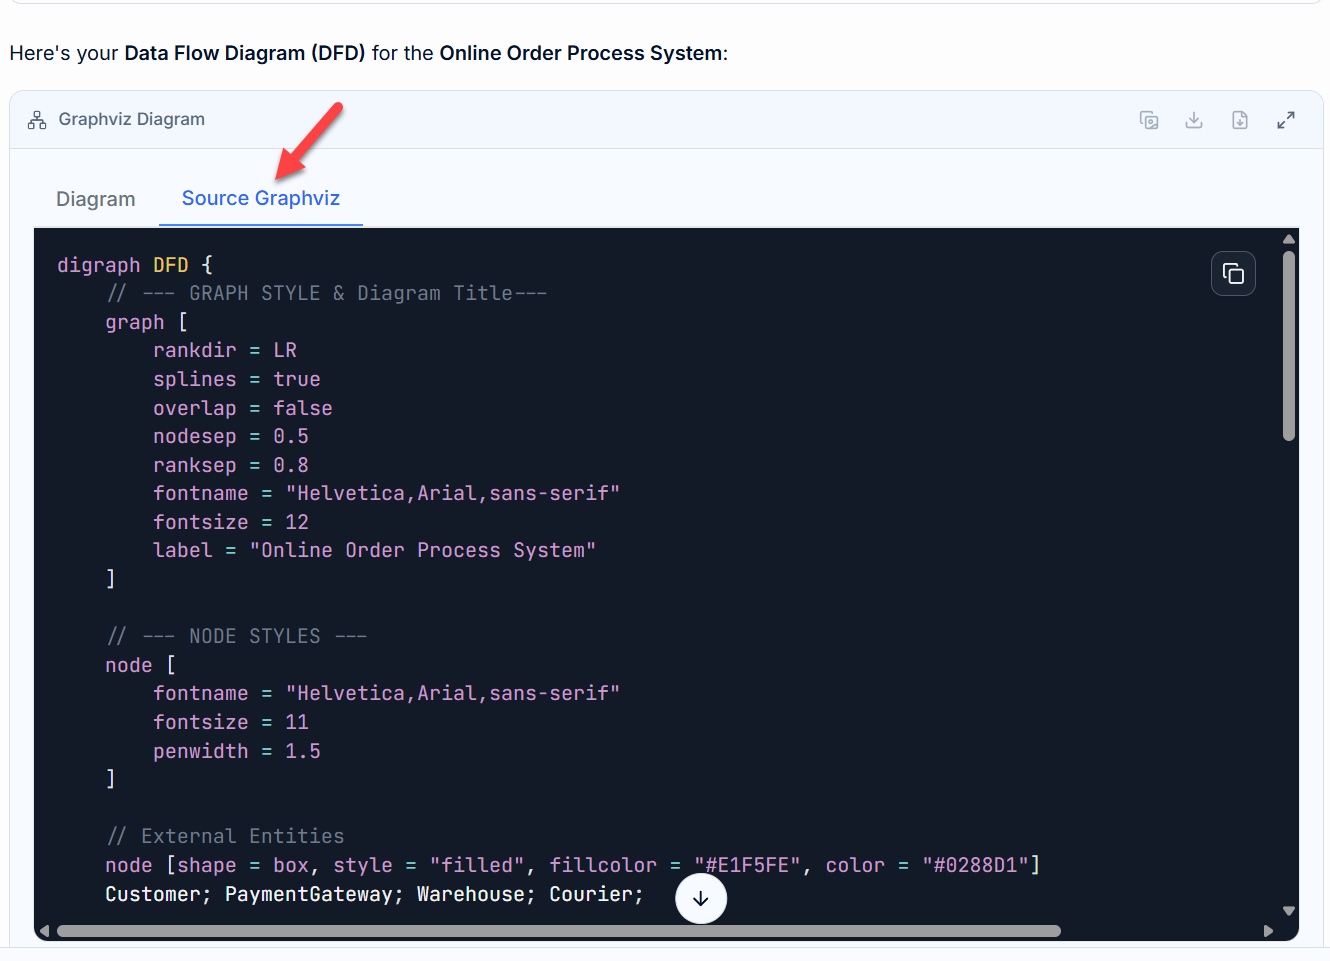
The AI uses Graphviz Dot Code to render the diagram, ensuring precision. You can view this code in the “Code” tab.
digraph DFD {
    // --- GRAPH STYLE & Diagram Title---
    graph [
        rankdir = LR
        splines = true
        overlap = false
        nodesep = 0.5
        ranksep = 0.8
        fontname = "Helvetica,Arial,sans-serif"
        fontsize = 12
        label = "Online Order Process System"
    ]

    // --- NODE STYLES ---
    node [
        fontname = "Helvetica,Arial,sans-serif"
        fontsize = 11
        penwidth = 1.5
    ]

    // External Entities
    node [shape = box, style = "filled", fillcolor = "#E1F5FE", color = "#0288D1"]
    Customer; PaymentGateway; Warehouse; Courier;

    // --- SYSTEM BOUNDARY CONTAINER ---
    subgraph cluster_SystemBoundary {
        label = "Online Order Process System";
        fontname = "Helvetica,Arial,sans-serif"
        fontsize = 14
        color = "#757575"
        style = "dashed,rounded"
        bgcolor = "#FAFAFA"
        margin = 20

        // Processes
        node [shape = circle, style = "filled", fillcolor = "#E8F5E9", color = "#388E3C", fixedsize = true, width = 1.3]
        P1 [label="1.0\nPlace\nOrder"];
        P2 [label="2.0\nProcess\nPayment"];
        P3 [label="3.0\nConfirm\nInventory"];
        P4 [label="4.0\nShip\nOrder"];

        // Data Stores
        node [shape = record, style = "filled", fillcolor = "#FFF9C4", color = "#FBC02D", fixedsize = false]
        OrderDS [label="{ <id> D1 | Orders }"];
        ProductDS [label="{ <id> D2 | Product\nInventory }"];
        ShippingDS [label="{ <id> D3 | Shipments }"];
    }

    // --- EDGE STYLES ---
    edge [
        fontname = "Helvetica,Arial,sans-serif"
        fontsize = 9
        color = "#555555"
        arrowsize = 0.8
    ]

    // --- DATA FLOWS ---
    // Customer interactions
    Customer -> P1 [label="Order &\nAccount Details"];
    P1 -> Customer [label="Order\nConfirmation"];
    P2 -> PaymentGateway [label="Payment\nRequest"];
    PaymentGateway -> P2 [label="Payment\nStatus"];

    // Process to Process
    P1 -> P2 [label="Order\nTotal"];
    P2 -> P3 [label="Paid\nOrder"];
    P3 -> P4 [label="Verified\nOrder"];

    // Process to Data Store
    P1 -> OrderDS [label="Create\nOrder"];                       // write
    P3 -> ProductDS [label="Update\nStock", dir=both];           // read & write
    P4 -> ShippingDS [label="Create\nShipment"];                 // write

    // Data Store to Process
    OrderDS -> P3 [label="Order\nDetails"];                      // read
    ShippingDS -> P4 [label="Shipment\nLabel"];                  // read

    // Courier / Warehouse interactions
    Warehouse -> P3 [label="Stock\nAvailable"];
    Courier -> P4 [label="Delivery\nStatus", dir=both];
}
Key Components in Level 1:
-
External Entities (Blue Boxes): Customer, Payment Gateway, Warehouse, Courier.
-
Processes (Green Circles): 1.0 Place Order, 2.0 Process Payment, 3.0 Confirm Inventory, 4.0 Ship Order.
-
Data Stores (Yellow Records): D1 Orders, D2 Product Inventory, D3 Shipments.
Step 3: Refinement – Level 2 Decomposition
Top-down decomposition requires breaking complex processes into smaller sub-processes. The VP AI Chatbot facilitates this through intelligent follow-up questions.
Action:
Select the suggestion: “Zoom in on the Payment Process for a level 2 DFD”
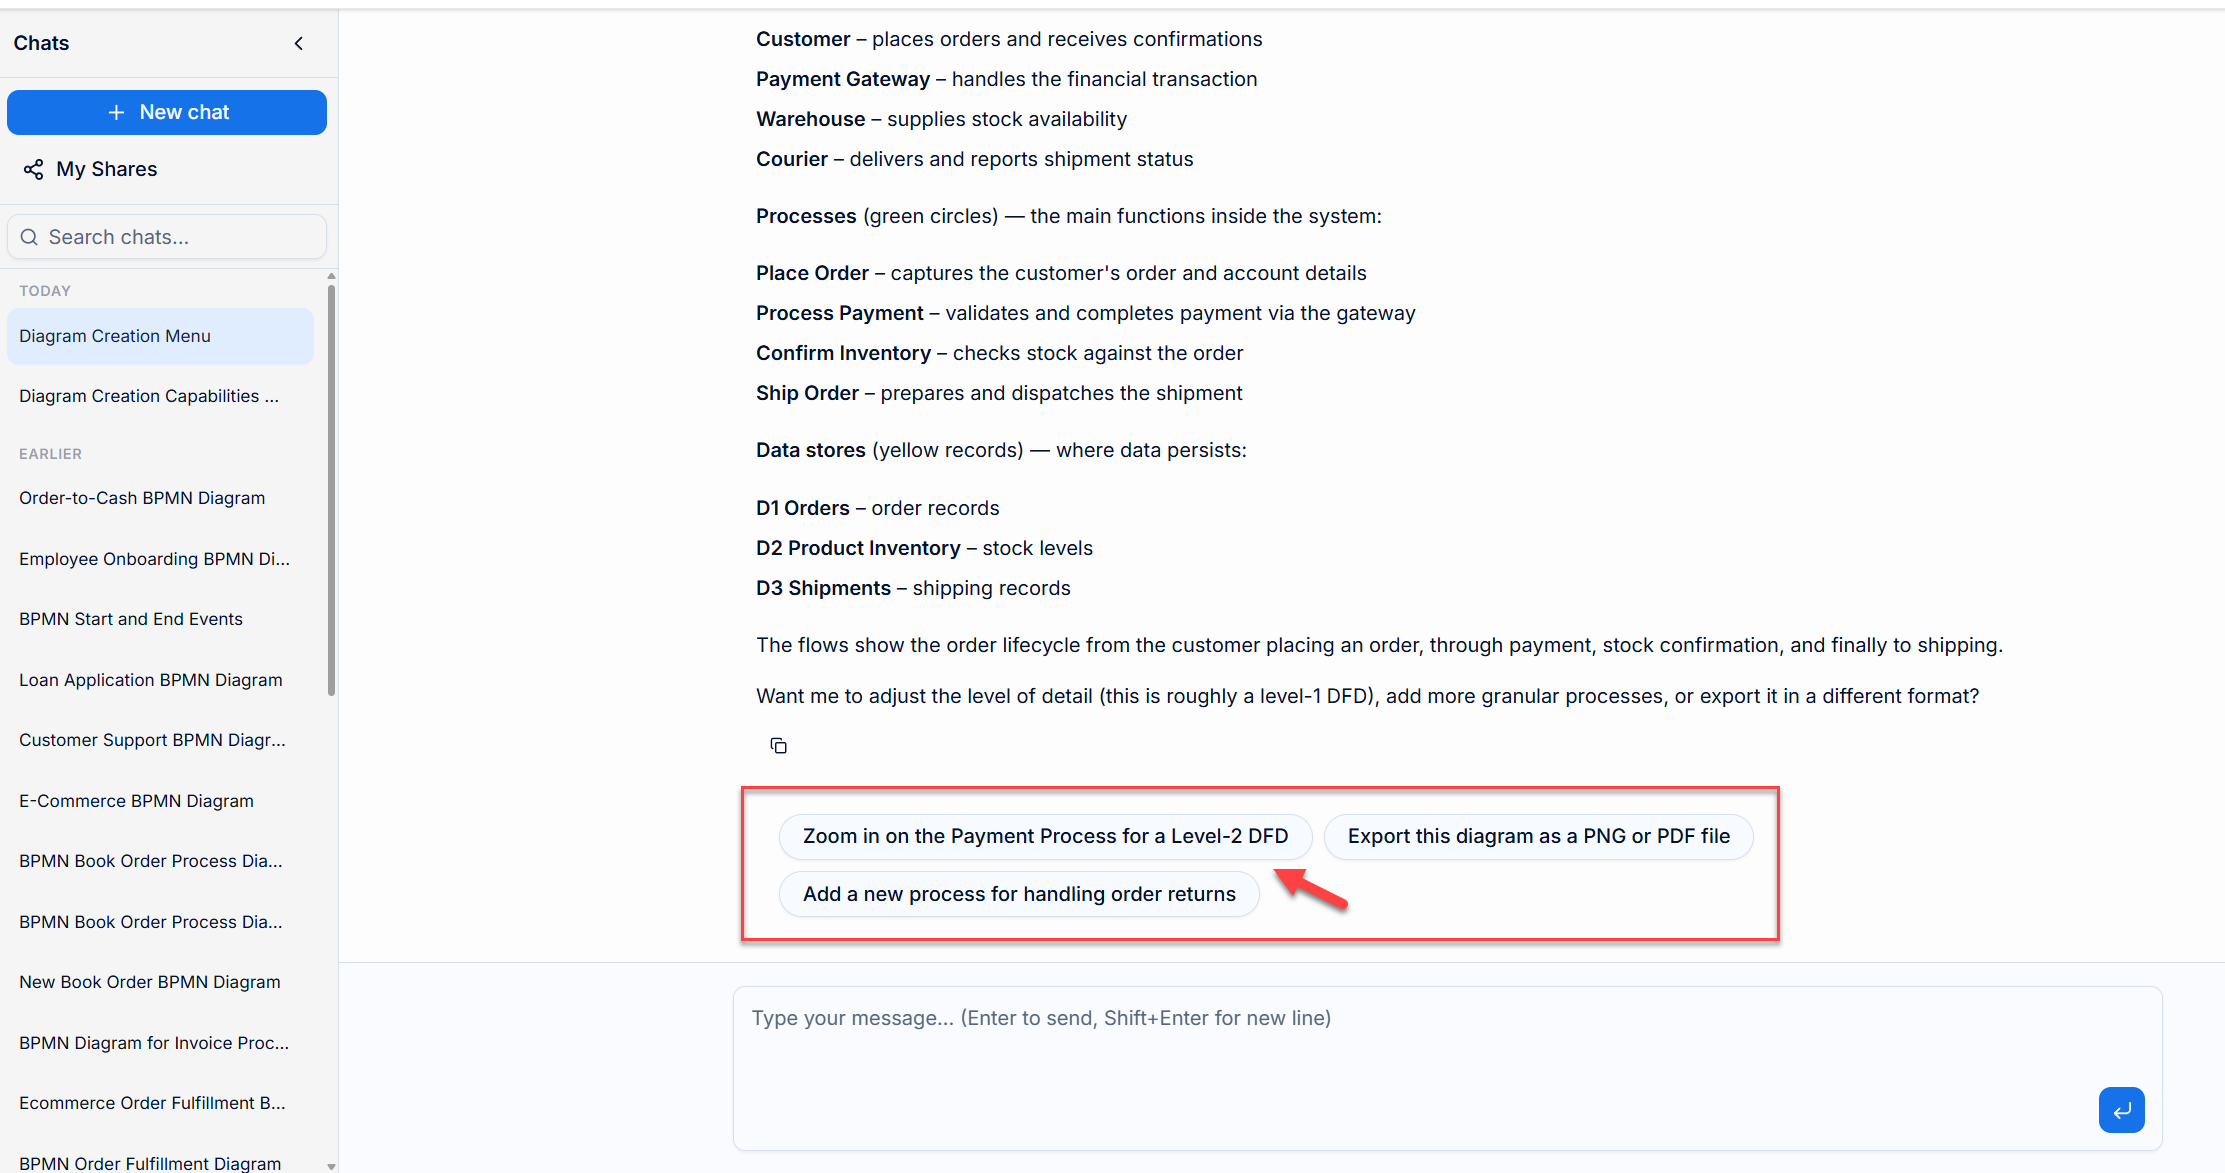
Result:
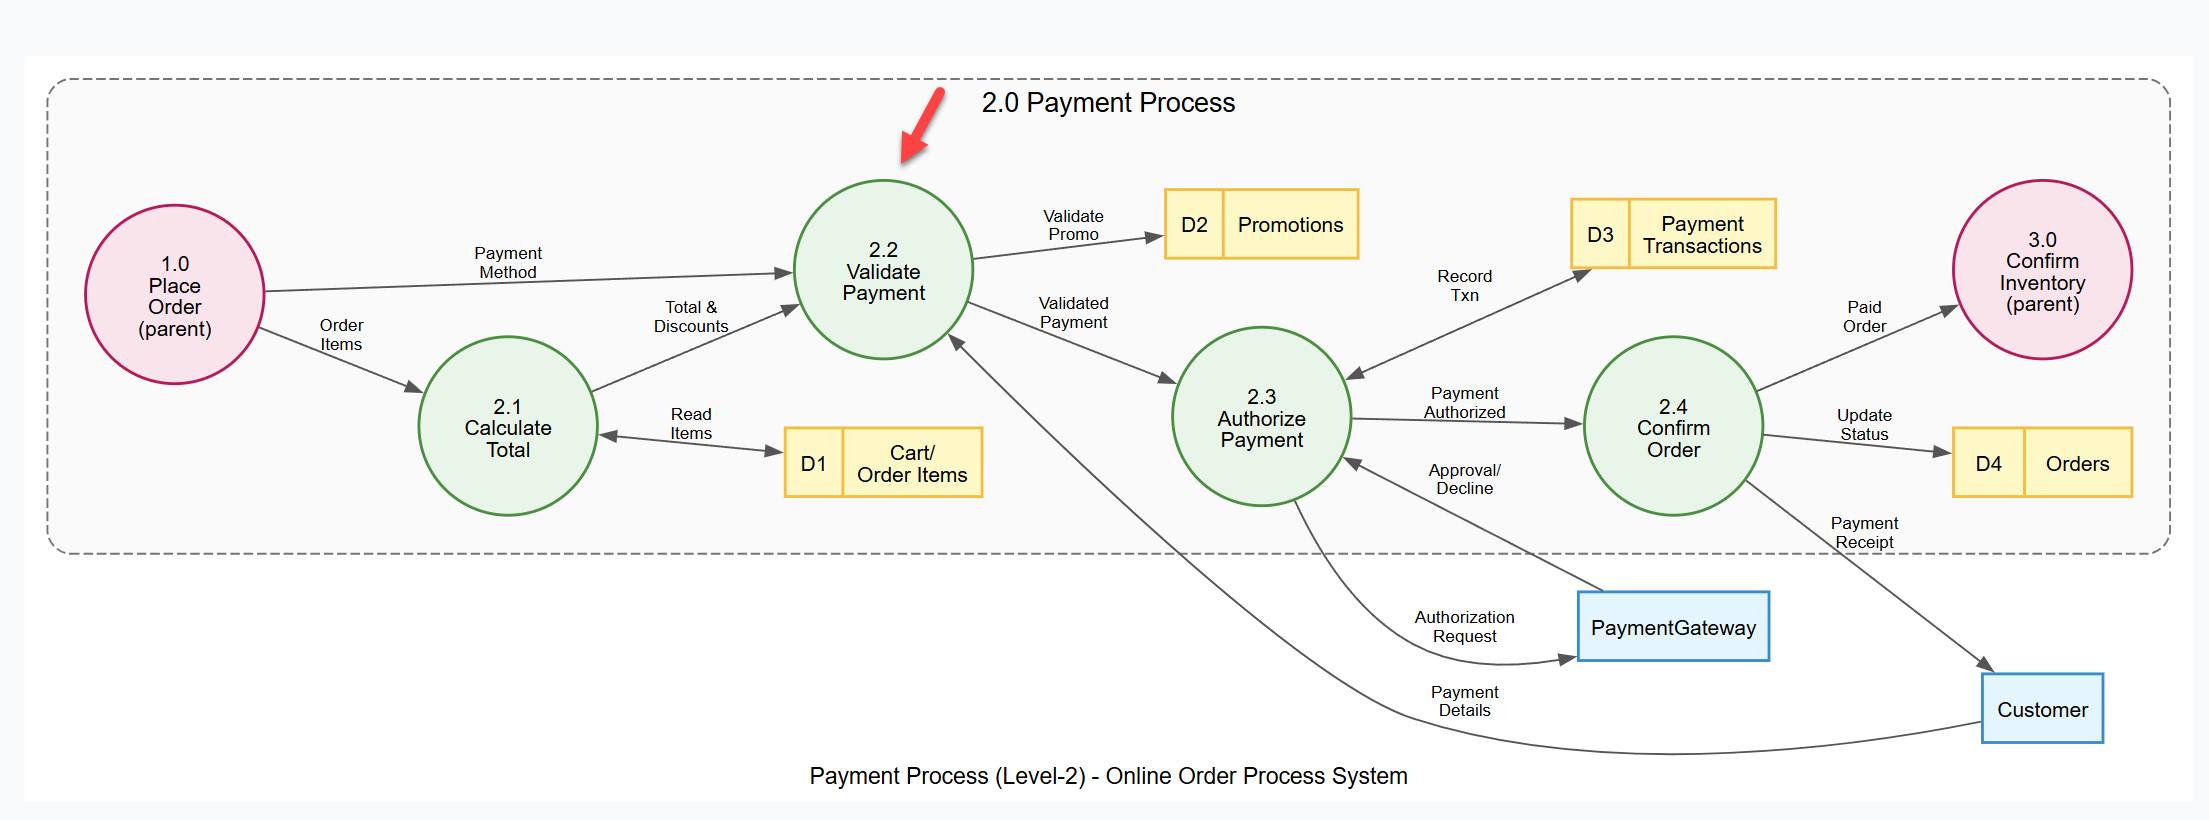
The AI generates a new diagram specifically for Process 2.0: Payment Process.
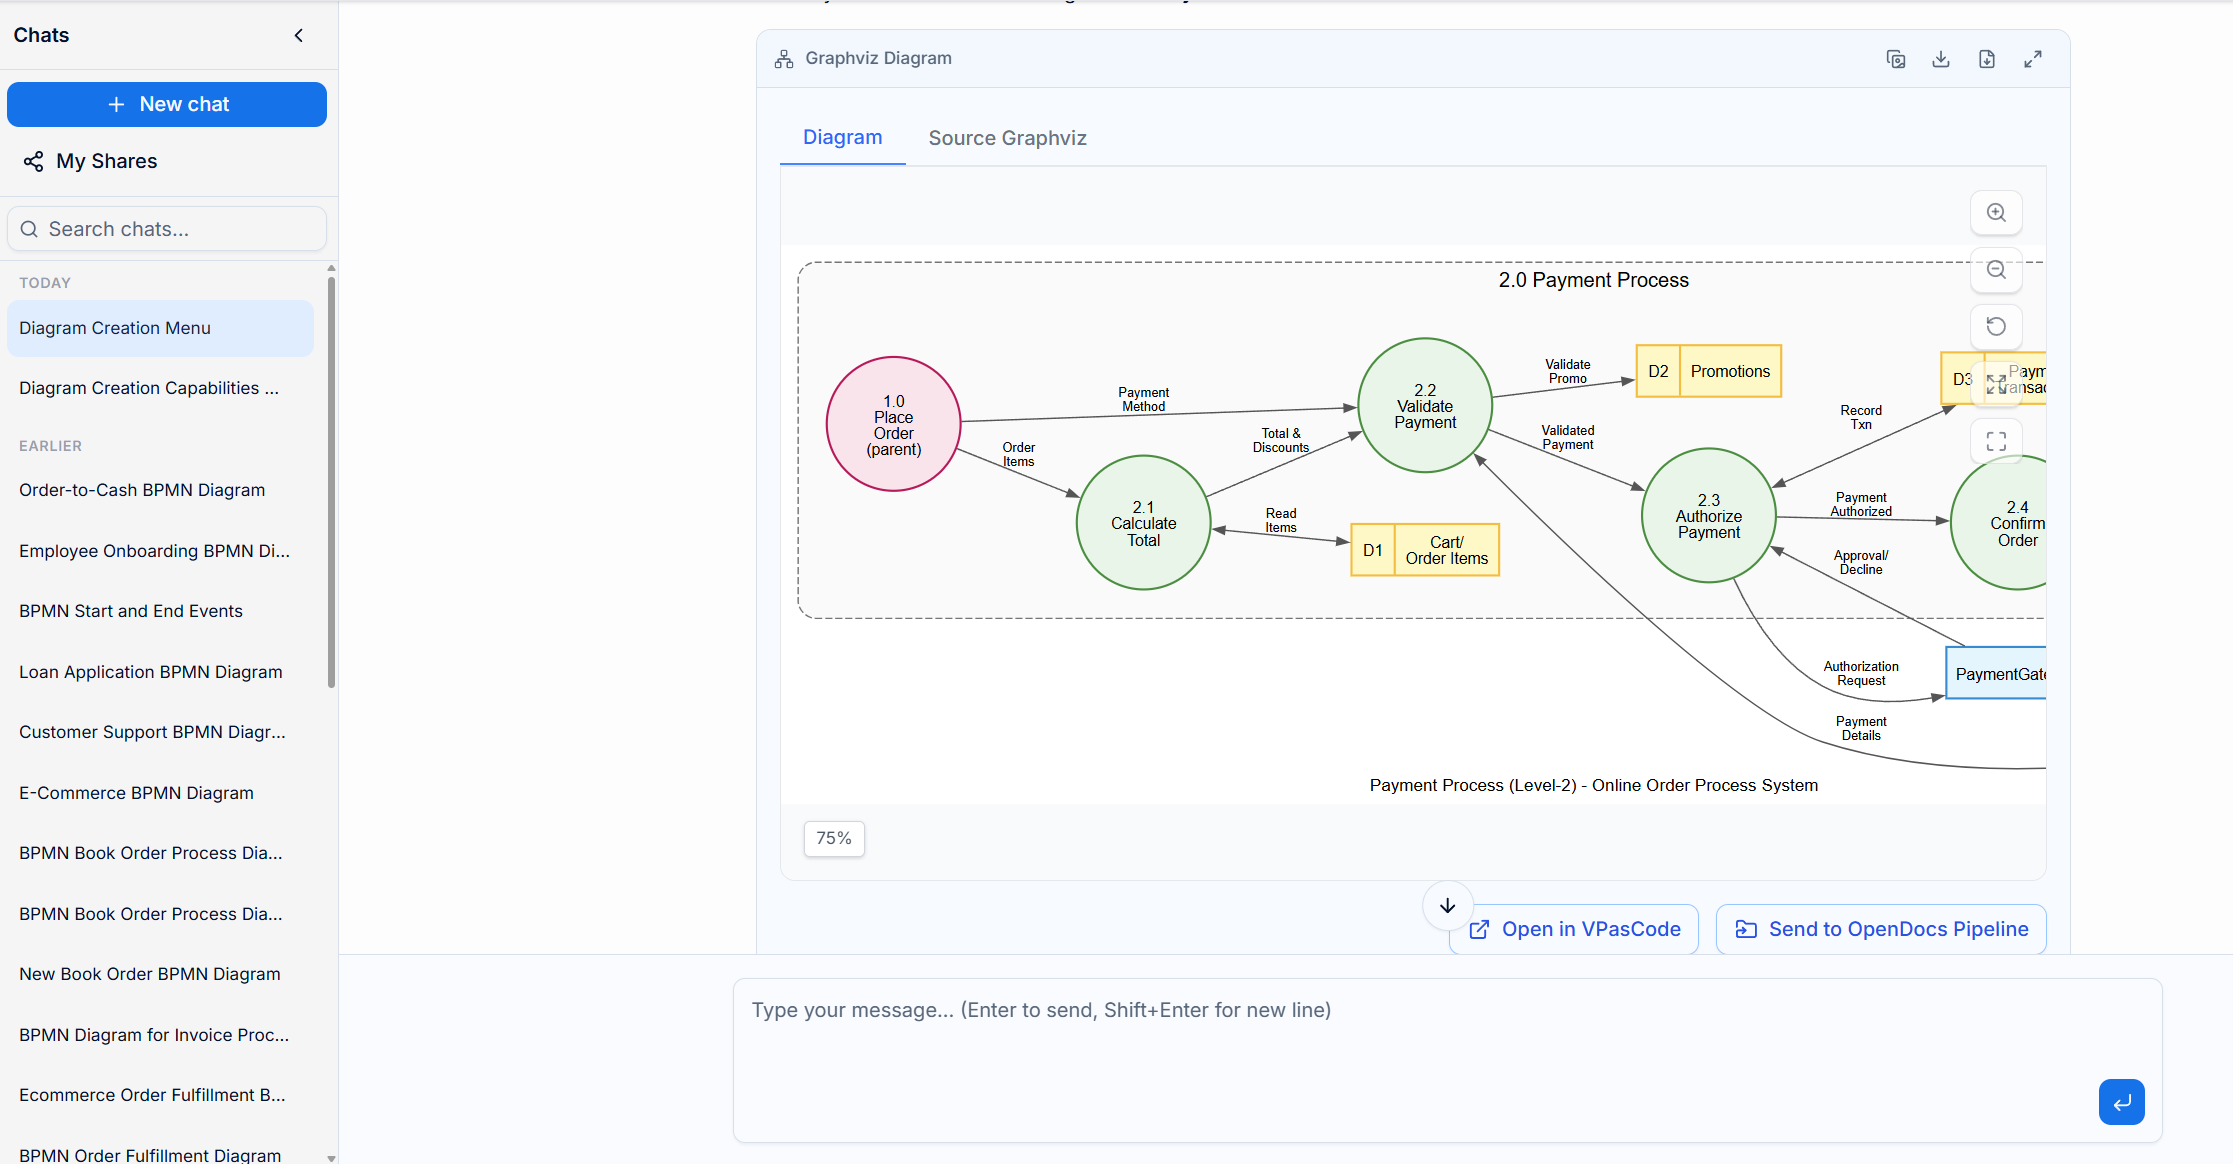
What’s New in Level 2?
Process 2.0 is decomposed into four sub-processes:
-
2.1 Calculate Total: Reads cart items and applies promotions.
-
2.2 Validate Payment: Checks payment method and promo codes.
-
2.3 Authorize Payment: Communicates with the external payment gateway.
-
2.4 Confirm Order: Finalizes status and issues receipt.
Key Conventions:
-
Parent References: Processes 1.0 and 3.0 are shown in pink as boundary references to maintain context.
-
Local Numbering: Data stores are re-numbered locally (D1–D4) within this sub-diagram.
-
Bidirectional Flows: Used to reduce clutter when data moves in both directions.
Step 4: Deep Dive – Level 3 Decomposition
For critical or complex sub-processes, you can go deeper. Let’s refine Process 2.2: Validate Payment.
Action:
Select the suggestion: “Break down the validate Payment sub-process further”
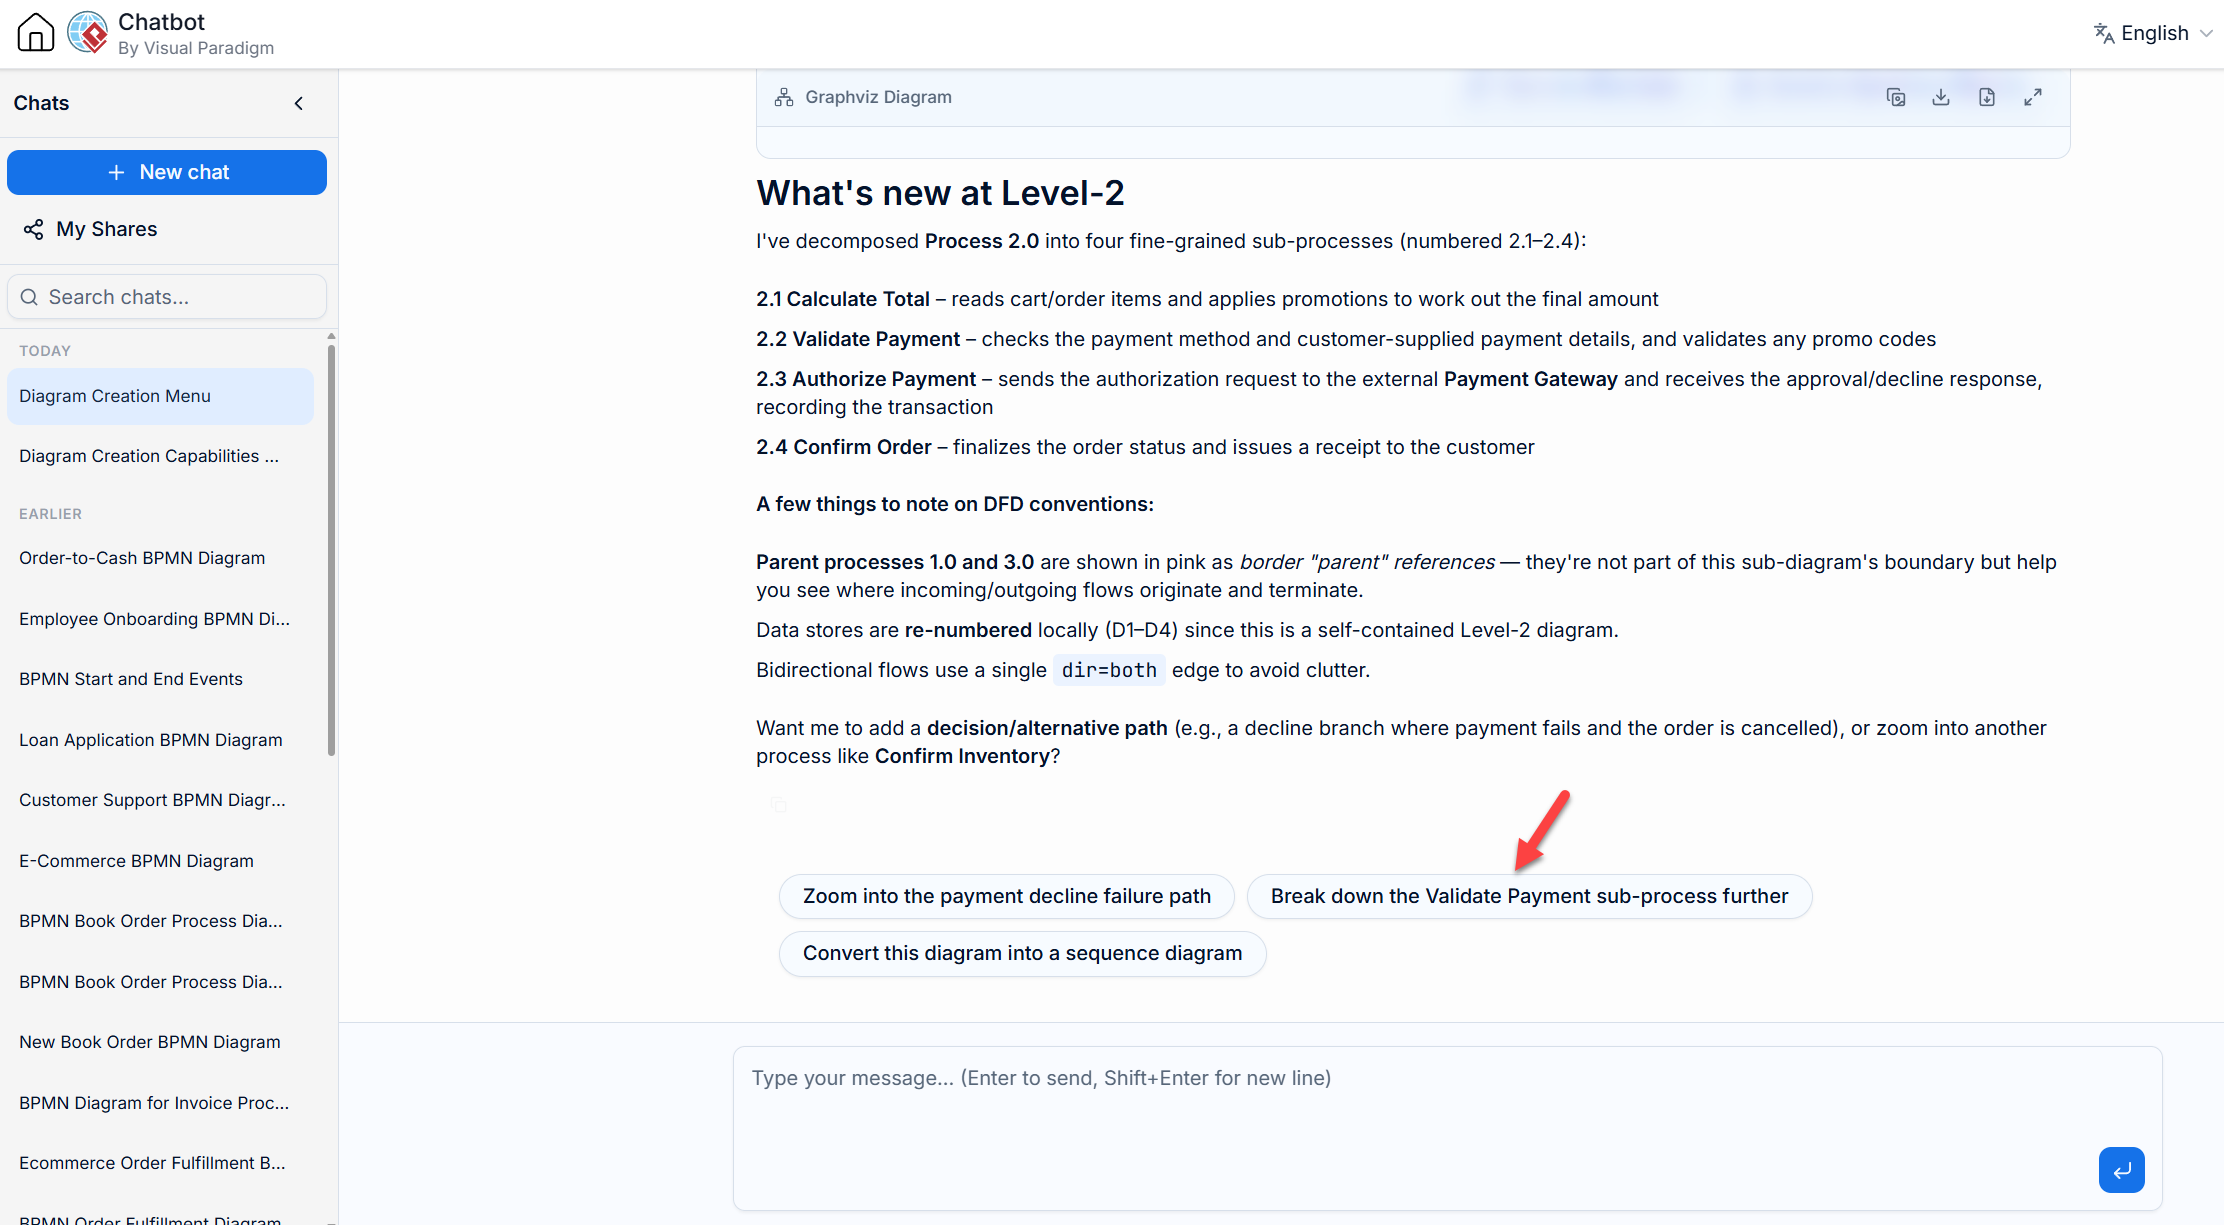
Result:
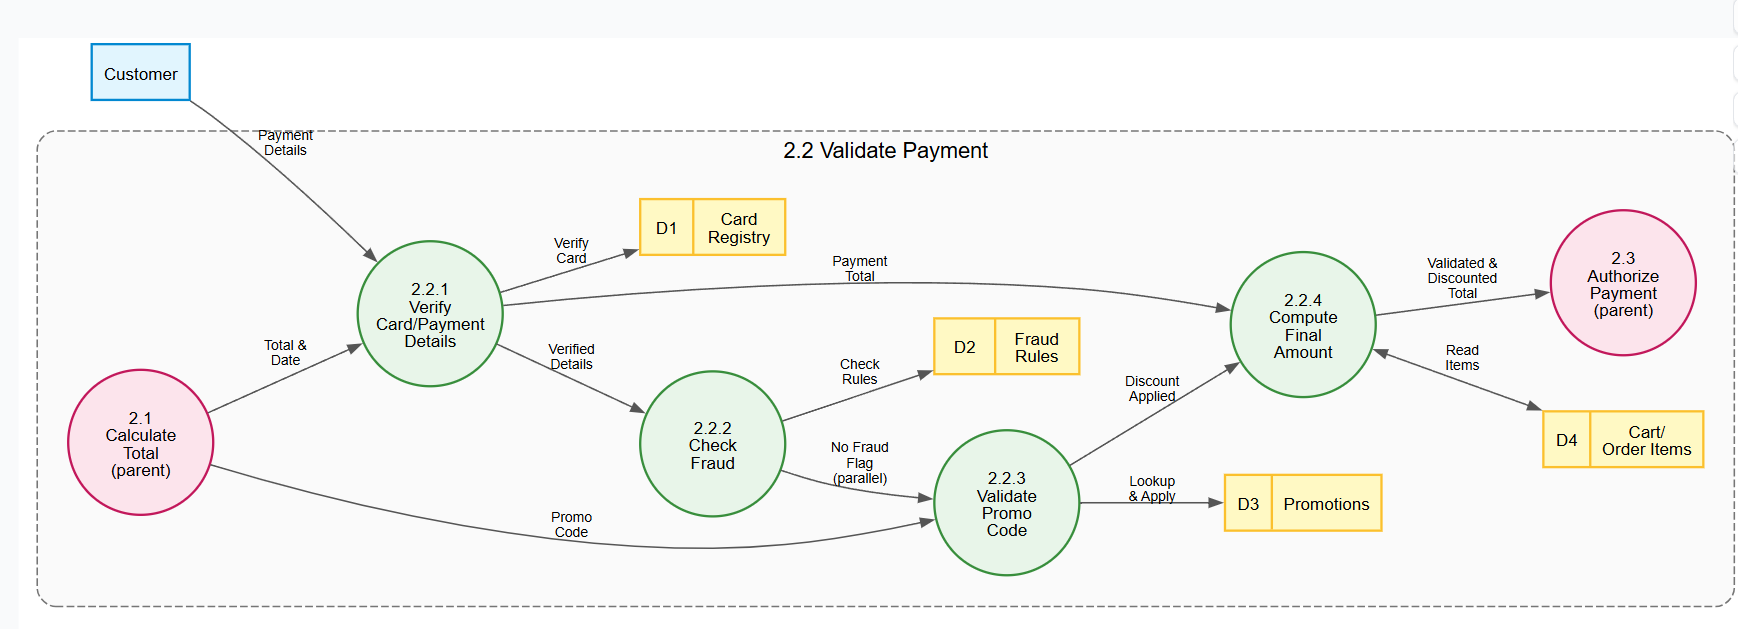
The AI generates a Level 3 DFD for Process 2.2, using numbering like 2.2.1, 2.2.2, etc.
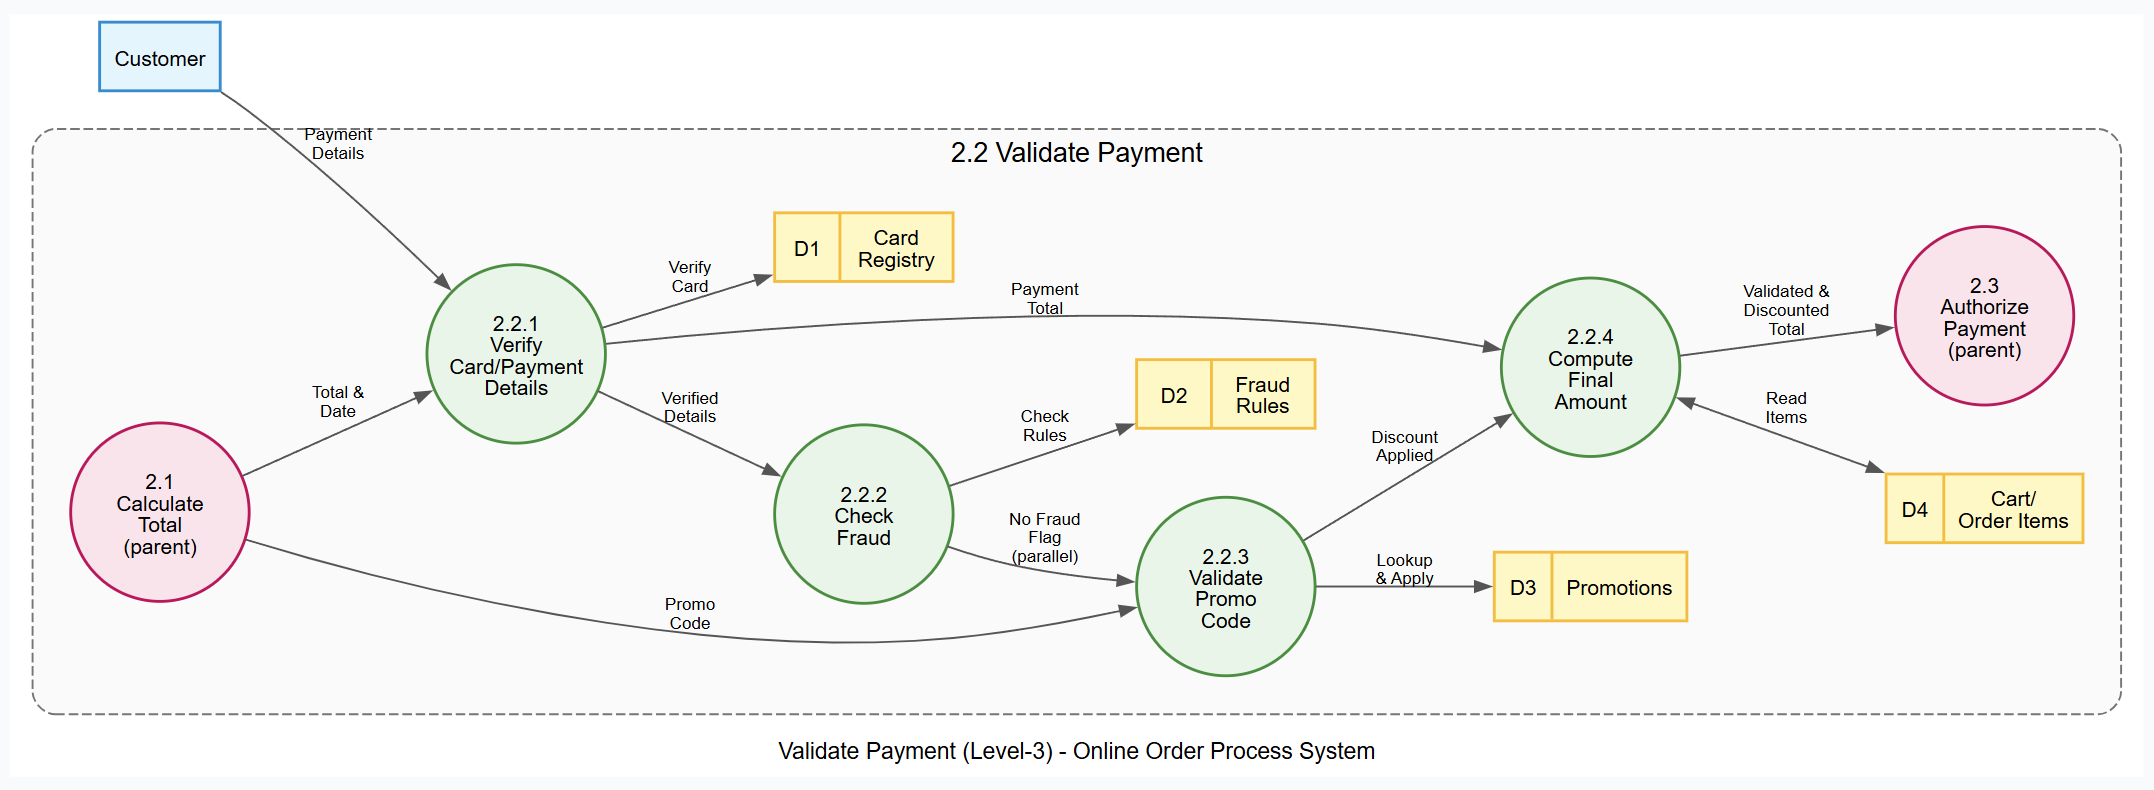
Inside “Validate Payment” (Level 3):
-
2.2.1 Verify Card/Payment Details: Validates card number, expiry, and CVV against a registry.
-
2.2.2 Fraud Check: Runs details against fraud rules.
-
2.2.3 Validate Promo Code: Looks up discounts in a promo store.
-
2.2.4 Calculate Final Amount: Combines base total with discounts.
Structural Insights:
-
Steps 2.2.2 and 2.2.3 can often run in parallel.
-
Parent processes 2.1 and 2.3 are shown in pink to show input/output context.
-
The Customer entity inputs directly into the validation steps.
You can view the corresponding Graphviz source code in the Source Tab:
Step 5: Expanding the Model – Resuming and Branching from Shared Sessions
One of the most powerful features of the VP AI Chatbot is its ability to maintain context across complex modeling sessions. You don’t need to start from scratch every time. Instead, you can resume existing sessions or branch into parallel processes.
Resuming a Shared Session:
To see this in action, you can access a pre-prepared shared session containing the decomposition discussed so far (Level 1 to Level 2 Payment Process):
👉 Resume Shared DFD Session
Once loaded, the chatbot retains the context of the “Online Order Process System.” You can immediately continue defining the next logical step without re-entering the initial system description.
Focusing on Process 3.0:
Suppose you have finished decomposing the Payment Process (2.0) and now need to define the Confirm Inventory process (3.0) at Level 2. Simply prompt the chatbot to focus on the specific process ID from the original Level 1 DFD.
Prompt:
“Zoom in on the Confirm Inventory Process for a level 2 DFD”
The AI identifies the context and generates a specific sub-diagram for Process 3.0.
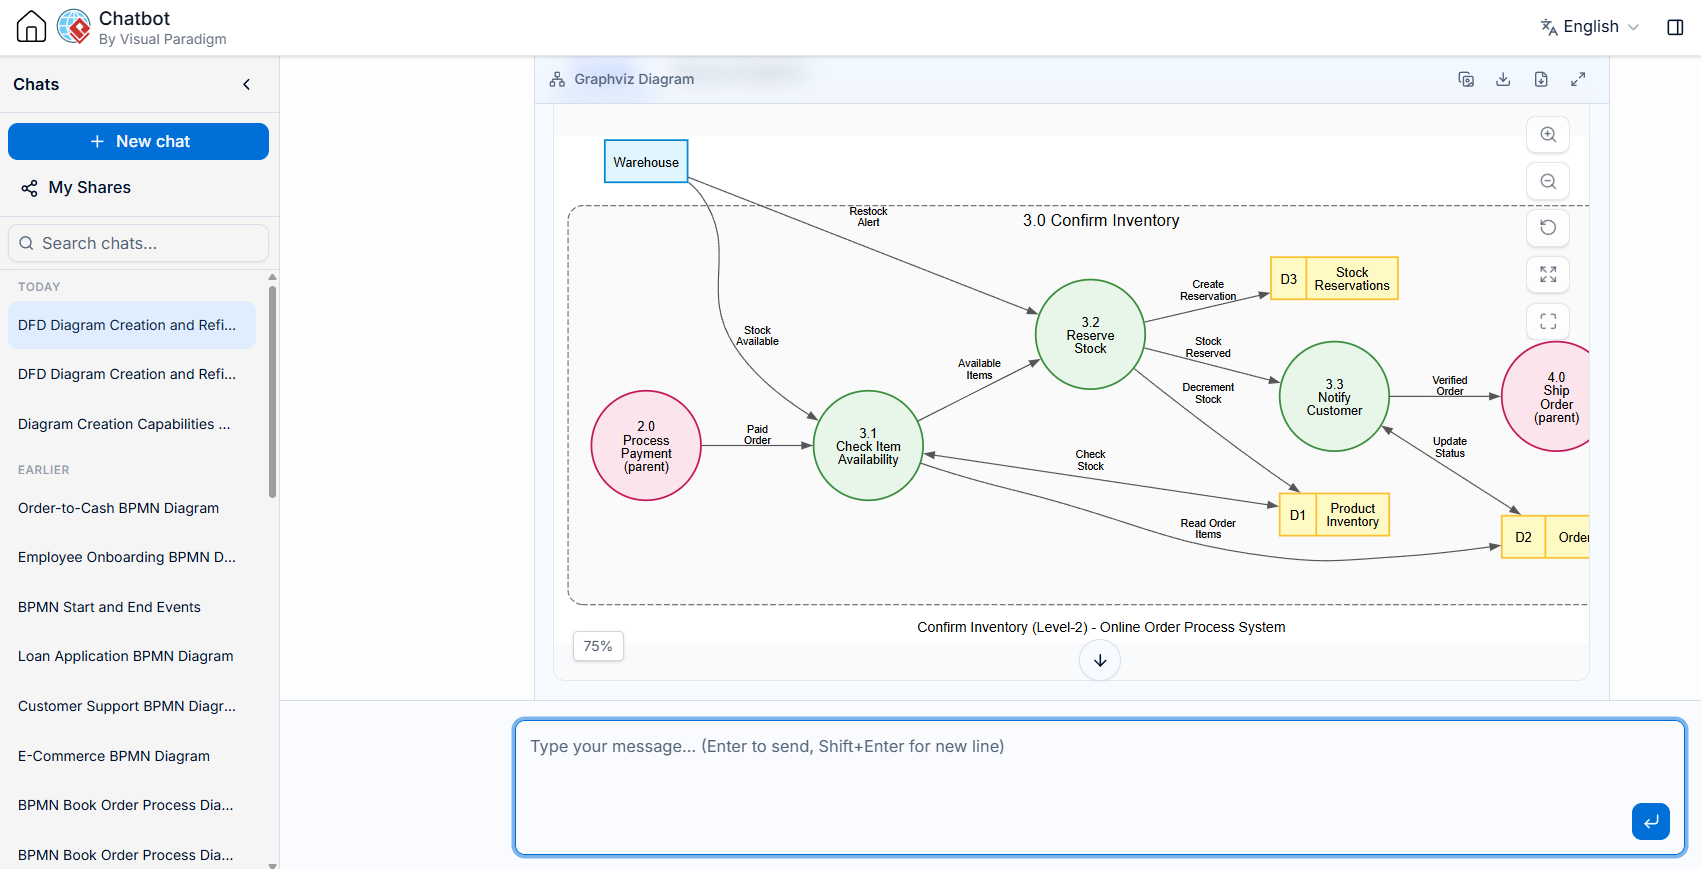
What’s Inside “Confirm Inventory” at Level 2?
Process 3.0 is decomposed into three specialized sub-processes:
-
3.1 Check Item Availability: Reads order items and validates stock levels against the Product Inventory data store. Communicates with the Warehouse external entity.
-
3.2 Reserve Stock: Decrements stock in Product Inventory, creates a record in Stock Reservations, and triggers restock alerts if low.
-
3.3 Notify Customer: Updates the Orders data store status to reflect reserved stock, preparing for shipping.
Key Structural Elements:
-
Parent References: Processes 2.0 (Process Payment) and 4.0 (Ship Order) are shown in pink. This visually indicates that “Paid Order” flows in from 2.0 and “Verified Order” flows out to 4.0.
-
External Entity Interaction: The Warehouse remains outside the system boundary but interacts directly with availability checks (3.1) and restock alerts (3.2).
-
Local Data Stores: Re-numbered locally (D1 Product Inventory, D2 Orders, D3 Stock Reservations).
digraph DFD {
// --- GRAPH STYLE & Diagram Title---
graph [
rankdir = LR
splines = true
overlap = false
nodesep = 0.5
ranksep = 0.8
fontname = "Helvetica,Arial,sans-serif"
fontsize = 12
label = "Confirm Inventory (Level-2) - Online Order Process System"
]

// --- NODE STYLES ---
node [
fontname = "Helvetica,Arial,sans-serif"
fontsize = 11
penwidth = 1.5
]

// External Entities (parents from Level-1)
node [shape = box, style = "filled", fillcolor = "#E1F5FE", color = "#0288D1"]
Warehouse;

// --- SYSTEM BOUNDARY CONTAINER ---
subgraph cluster_SystemBoundary {
label = "3.0 Confirm Inventory";
fontname = "Helvetica,Arial,sans-serif"
fontsize = 14
color = "#757575"
style = "dashed,rounded"
bgcolor = "#FAFAFA"
margin = 20

// Sub-processes
node [shape = circle, style = "filled", fillcolor = "#E8F5E9", color = "#388E3C", fixedsize = true, width = 1.3]
P31 [label="3.1\nCheck Item\nAvailability"];
P32 [label="3.2\nReserve\nStock"];
P33 [label="3.3\nNotify\nCustomer"];

// Data Stores
node [shape = record, style = "filled", fillcolor = "#FFF9C4", color = "#FBC02D", fixedsize = false]
ProductDS [label="{ <id> D1 | Product\nInventory }"];
OrderDS [label="{ <id> D2 | Orders }"];
ReservationDS [label="{ <id> D3 | Stock\nReservations }"];

// Parent processes (from Level-1/Level-2)
node [shape = circle, style = "filled", fillcolor = "#FCE4EC", color = "#C2185B", fixedsize = true, width = 1.3]
P2 [label="2.0\nProcess\nPayment\n(parent)"];
P4 [label="4.0\nShip\nOrder\n(parent)"];
}

// --- EDGE STYLES ---
edge [
fontname = "Helvetica,Arial,sans-serif"
fontsize = 9
color = "#555555"
arrowsize = 0.8
]

// --- DATA FLOWS ---
// Parent process input
P2 -> P31 [label="Paid\nOrder"];

// Sub-process chain
P31 -> P32 [label="Available\nItems"];
P32 -> P33 [label="Stock\nReserved"];

// Flows to parent process
P33 -> P4 [label="Verified\nOrder"];

// Data store accesses
P31 -> OrderDS [label="Read Order\nItems"];
P31 -> ProductDS [label="Check\nStock", dir=both];
P32 -> ProductDS [label="Decrement\nStock"];
P32 -> ReservationDS [label="Create\nReservation"];
P33 -> OrderDS [label="Update\nStatus", dir=both];

// Warehouse interaction (external entity)
Warehouse -> P31 [label="Stock\nAvailable"];
Warehouse -> P32 [label="Restock\nAlert"];
}
In a real-world scenario, Process 3.1 (Check Item Availability) might include a branch for out-of-stock items. If you ask the AI to “Add a backorder handling path to Process 3.1,” it can further refine this logic. By leveraging the chatbot’s memory in shared sessions, you can seamlessly jump between different branches of the system architecture—payment, inventory, shipping—without losing the thread of the overall design.
Step 6: Extending Knowledge – Practicing with Shared Sessions
Now that you’ve mastered the basics with the “Confirm Inventory” example, you may want to model different parts of the system or entirely new systems. Starting from scratch each time can be time-consuming.
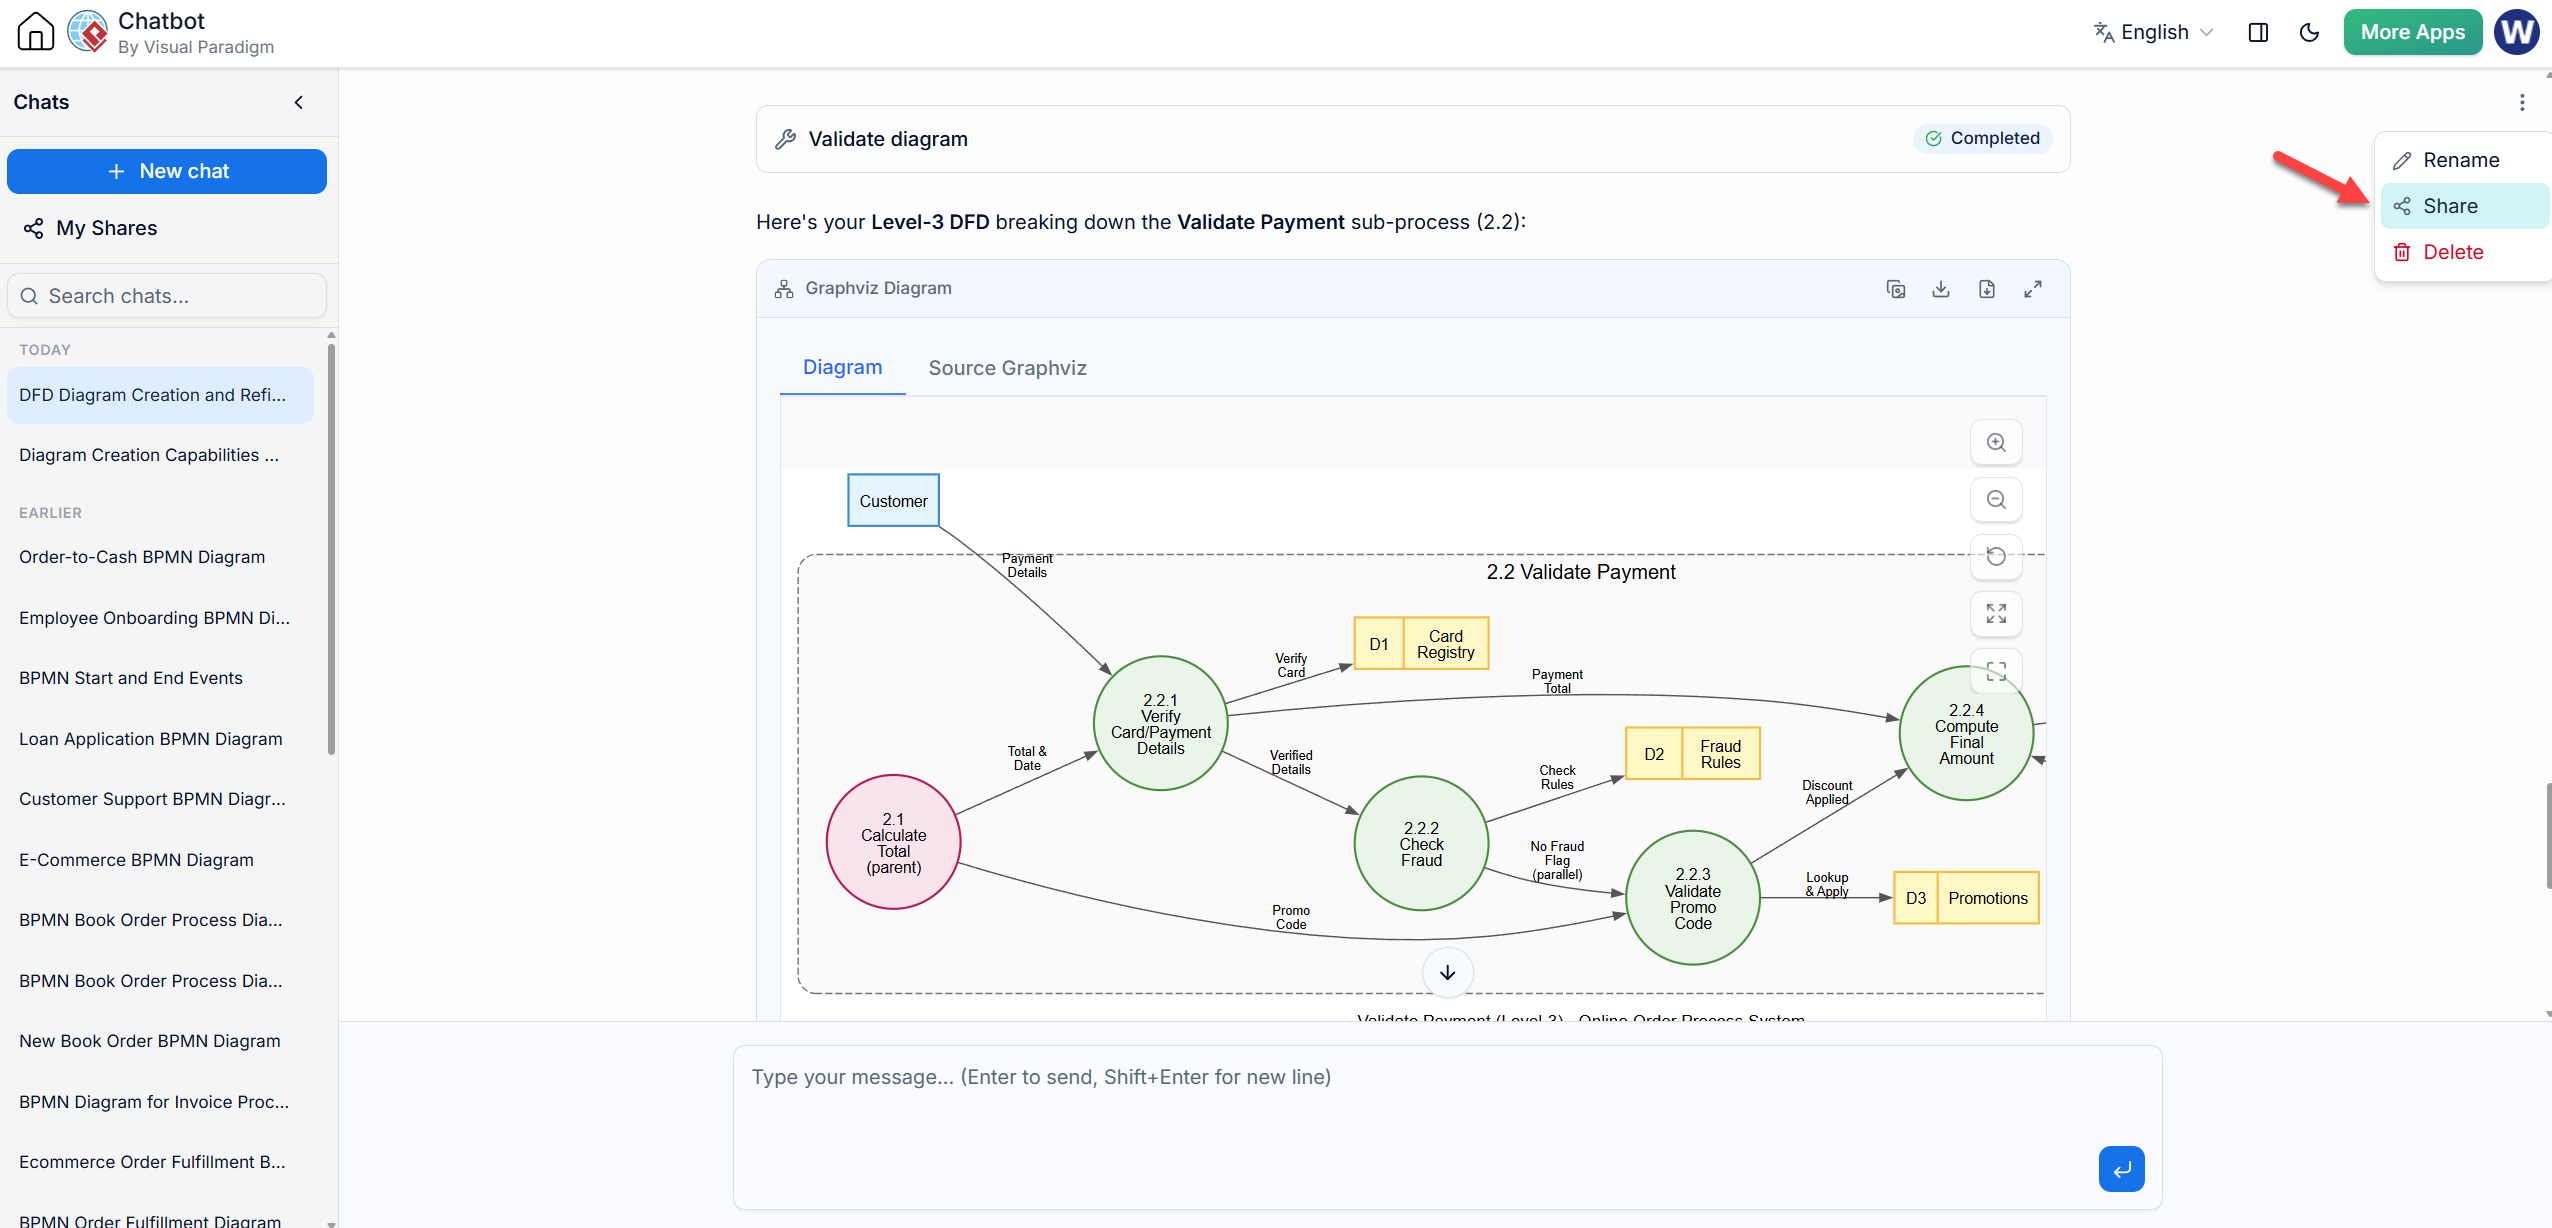
Visual Paradigm AI Chatbot allows you to resume and extend existing sessions. This means you don’t have to re-explain the entire context to the AI. You can pick up exactly where you left off, or even share your progress with team members for collaboration.
How to Use Shared Sessions:
-
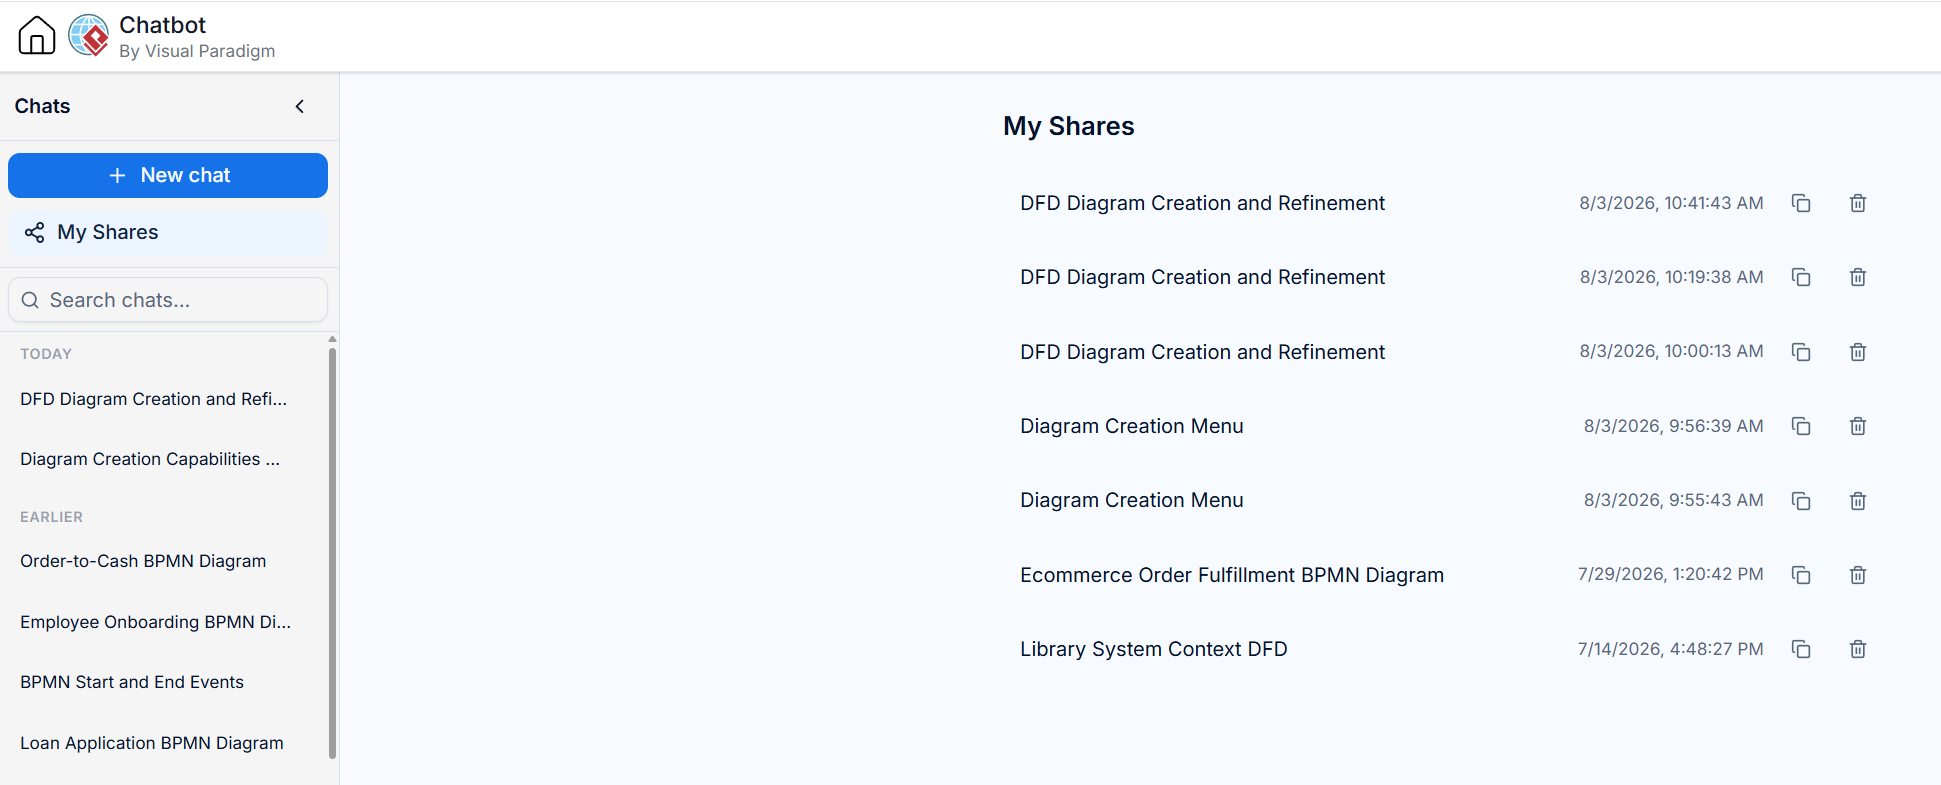
Access Your Shares: Click the My Share button in the VP AI Chatbot interface. You’ll see a list of previously shared sessions.
-
Select a Session: Choose the session you want to continue. For this exercise, we’ll use the “Confirm Inventory” session created earlier.
-
Resume and Extend: Once loaded, the AI retains the full context of your previous DFDs (Level 0, Level 1, and Level 2 “Confirm Inventory” diagrams). You can now immediately ask it to decompose another process, such as “Break down Process 3.1 Check Item Availability into Level 3”, without redefining the parent processes.
Why This Is Powerful:
-
Efficiency: Saves time by avoiding re-prompting initial context.
-
Consistency: The AI maintains naming conventions and structural logic established in previous steps.
-
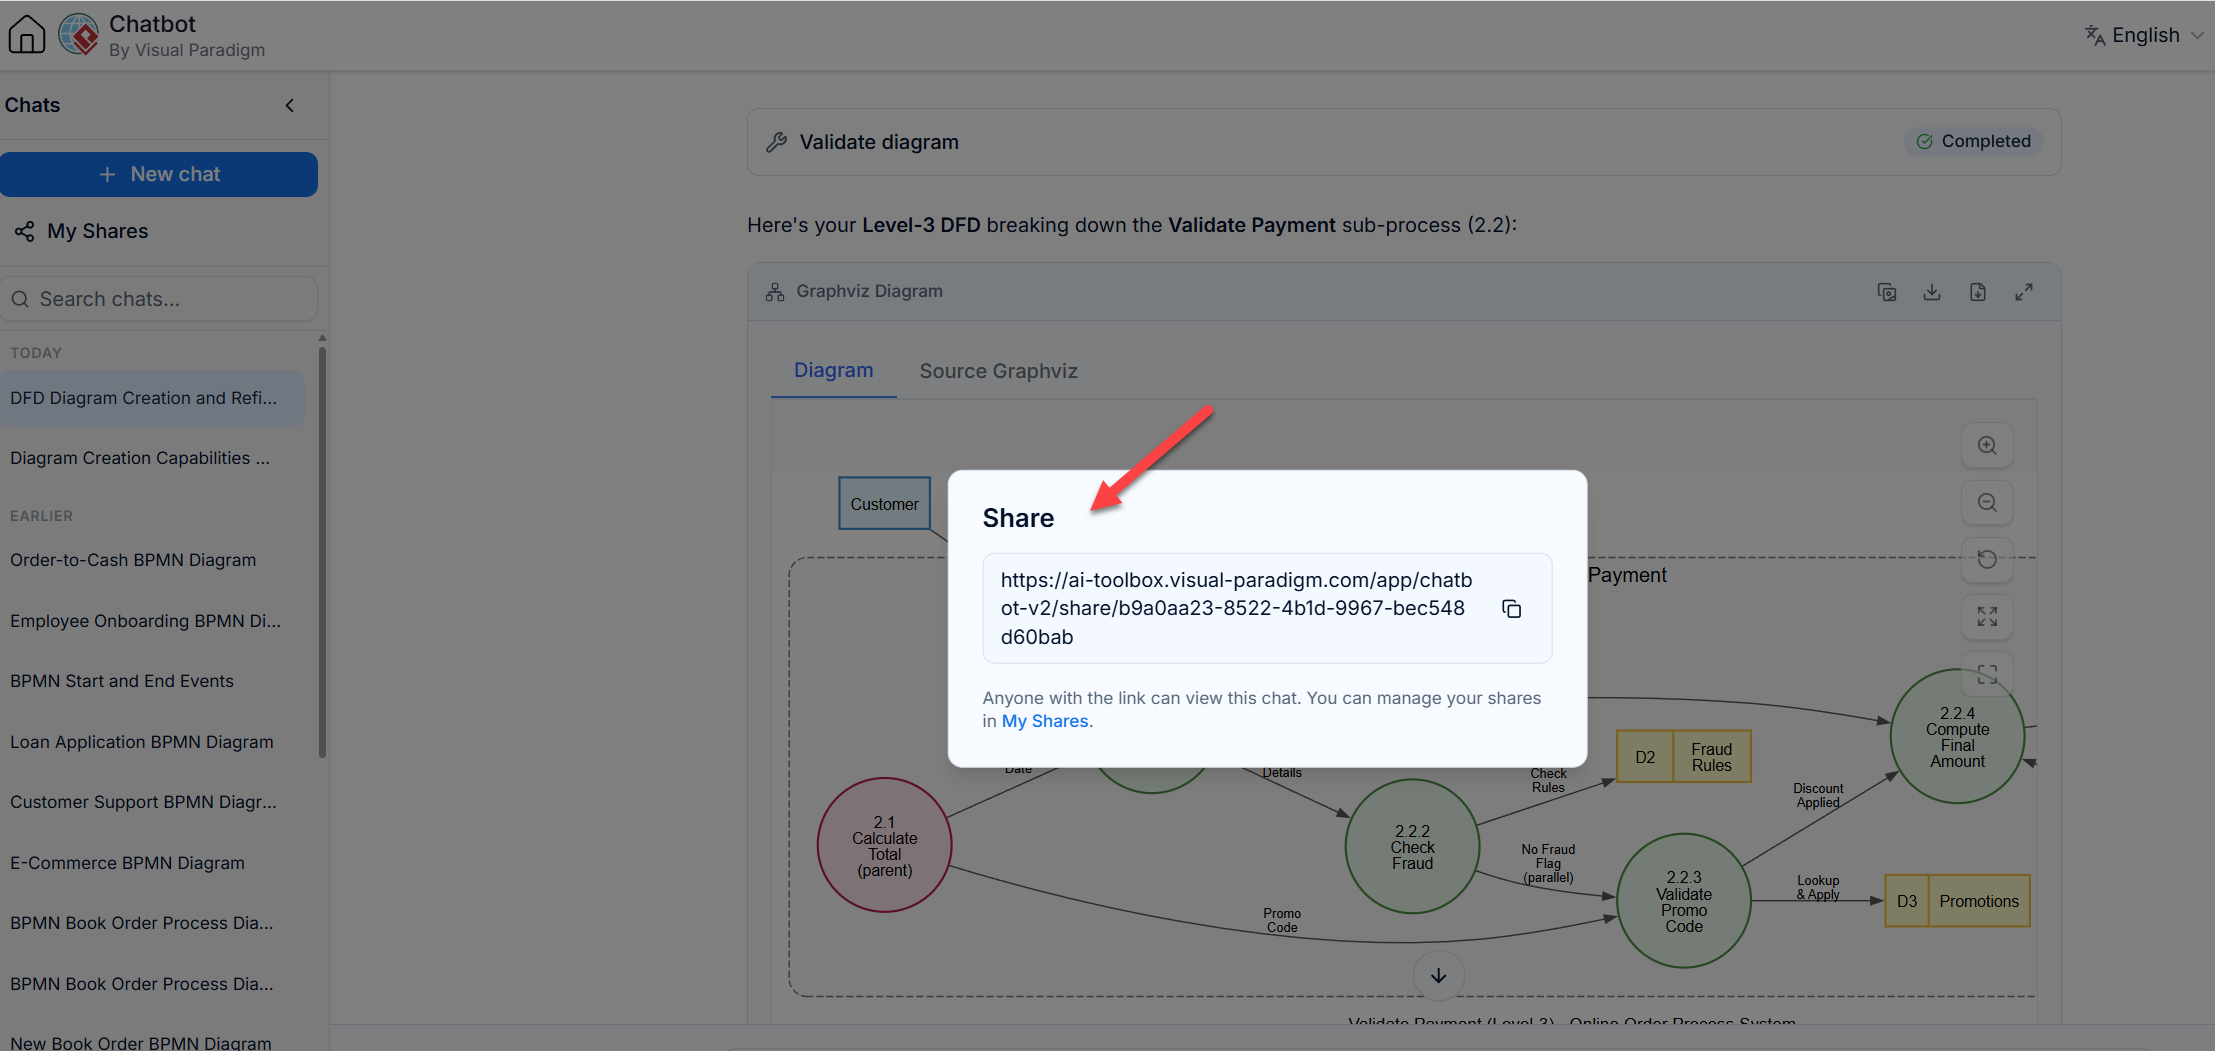
Collaboration: You can share the session URL with colleagues, allowing them to jump into the exact same context to continue modeling or provide feedback.
By leveraging shared sessions, you transform the VP AI Chatbot from a simple chart generator into a collaborative, persistent modeling assistant that grows with your project.
Conclusion
AI-assisted visual modeling transforms tedious drawing tasks into dynamic, interactive conversations. By using the Visual Paradigm AI Chatbot, you can rapidly prototype high-level system architectures and seamlessly drill down into specific functional areas using top-down decomposition.
This approach ensures your DFDs remain consistent, accurate, and understandable at every level of abstraction. Whether you are defining broad system boundaries or detailing specific validation logic, the AI acts as an intelligent partner, handling syntax and layout so you can focus on the system design itself. With the ability to resume and share sessions, teams can collaborate more effectively, ensuring that complex data flows are clearly communicated and correctly implemented.
References
- Try the AI Diagramming Chatbot — Generate diagrams from natural-language descriptions and explore how AI can help with your modeling work.
- Explore Solutions & Use Cases — See how the AI Diagramming Chatbot can help you solve real-world modeling and diagramming needs across different industries and use cases.
- Learn More About AI Diagramming Chatbot — Explore the chatbot’s features, capabilities, and how it can support your diagramming workflow.
- Stay Updated on AI Diagramming Chatbot — See the latest features, enhancements, and improvements added to the AI Diagramming Chatbot.
This post is also available in Deutsche, Español and فارسی.
Related posts:
 How Visual Paradigm’s AI Chatbot Revolutionizes Diagram Creation
 AI-Powered Use Case Modeling: Accelerating Agile Discovery with Visual Paradigm
 From Stories to Systems: Mastering Use-Case 2.0 for Agile and AI-Driven Development
Agile Modeling in Action: Accelerating Sprints with Just-in-Time Use Cases
From Stories to Systems: Mastering Use-Case 2.0 for Agile and AI-Driven Development
Agile Modeling in Action: Accelerating Sprints with Just-in-Time Use Cases
