Home » Archives for vpwing » Page 17
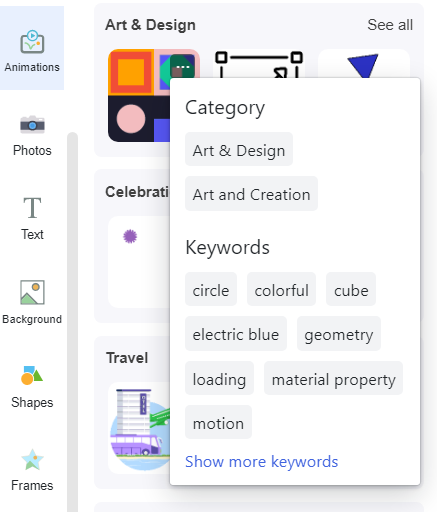
When creating animated flipbook, instead of adding animation effects to different text and images, we can also choose to add animated shapes. There are now 1000+ pre-made animated shapes in the library of VP Online. In this article, you can know how to find out similar animated elements that fit your needs. https://www.youtube.com/watch?v=9ZY8JiswpHE&width=854&height=480 Category and Keywords All animates shapes have category and keywords, which can help us to search the animated shapes we need and find similar elements easily. You can find them by clicking the "..." on the top right corner of…
continue reading →
To make our flipbook more attractive, adding animation is an effective method. Animation adds a dynamic element to your content, making it more engaging and visually appealing to readers. While VP Online provides various animation effects, there's now an additional way to create animated flipbooks: using animated shapes. Animated shapes come with pre-built animations, making it easy to enhance your animated flipbook with captivating effects. By simply adding these animated shapes to your pages, you can create a more interactive and lively flipbook experience for your audience easily. https://www.youtube.com/watch?v=M0Lq-4hdhpA&width=854&height=480 Where To Find The…
continue reading →
-
Posted on June 10, 2022
-
/Under Chart
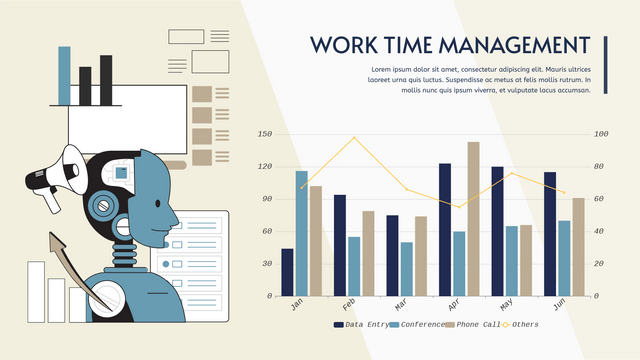
What Is A Grouped Column And Line Chart Grouped column And Line chart is a kind of combined chart consisted in grouped column chart and line chart. A line chart is placed on the top of a grouped column chart to show 2 sets of data together with widely difference. When To Use Grouped Column And Line Chart In a grouped column and line chart, Y-axis on both 2 sides are representing the value of the 2 sets of data. In this case, the difference between the ranges of their data are usually…
continue reading →
Fliplify flipbook Maker support creation of flipbook from stretch and conversion from other documents to flipbook. After online flipbook is created, we can share it with others through the internet, including Facebook. In this article, we will show you how to do so. https://www.youtube.com/watch?v=h1WiCpwuU4U&width=854&height=480 How To Share The Flipbook Via Facebook After publishing a flipbook, go to My Flipbook, then click share on the right. We can then see the following browser. Click the logo of Facebook below to share the flipbook. Introduce your flipbook in the post and share it in your…
continue reading →
-
Posted on June 7, 2022
-
/Under Chart
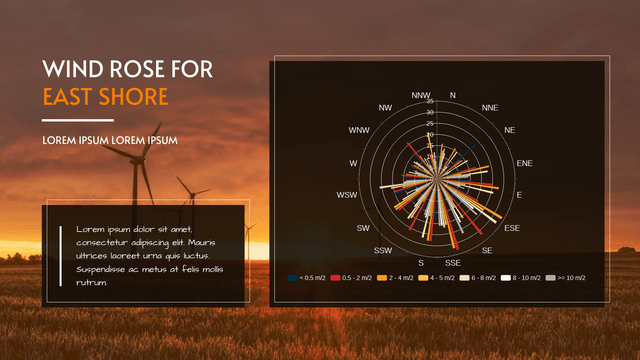
What Is A Rose Chart Rose chart shows data in 360 degrees with a shape of a compass. Is is commonly divided into 8 to 16 parts to show geography data. With different size and colors, we can see the difference between data clearly without calculating each part of them. When To Use Rose Chart As amount and direction can be shown in the chart clearly, rose chart is commonly used in data analysis of geography fieldwork. However, there is an important when reading rose chart that the outer segment does not represent…
continue reading →
-
Posted on June 2, 2022
-
/Under Diagram
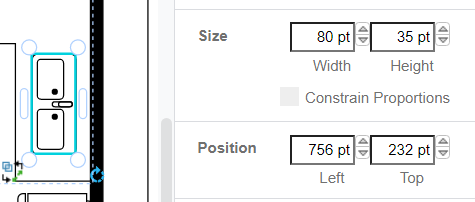
When creating diagrams, it's important to be able to design with specific units in mind. In Visual Paradigm Online, you can change the unit of measurement to suit your needs. The design tool allows you to change units to Points (pt), Inches ("), and Millimeters (mm) as per your requirement. In this article, we will explain how you can change the units in your diagrams using Visual Paradigm Online. https://www.youtube.com/watch?v=3_nxVnFnDeg&width=854&height=480 Changing the Units in Diagrams To change the units in your diagrams, follow these simple steps: Step 1: Open your diagram in…
continue reading →
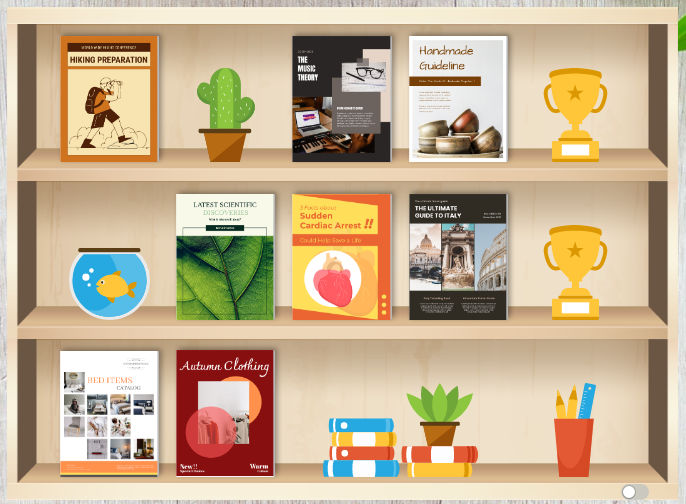
After creating stunning flipbooks in Fliplify, you can showcase them in a digital bookshelf and share them with others. To enhance the visual appeal of your bookshelf, consider adding decorative elements to make it more engaging and attractive! https://www.youtube.com/watch?v=wyDiD9sACSQ&width=854&height=480 How To Add Decorations To Bookshelf First, go to My Bookshelf in our workspace and choose the bookshelf we want to edit. Place the books you want to show in the bookshelf. We will then find that there are some space remaining. After that, click the Add Random Shelf Items in the bottom-left, you will…
continue reading →
-
Posted on May 26, 2022
-
/Under Chart
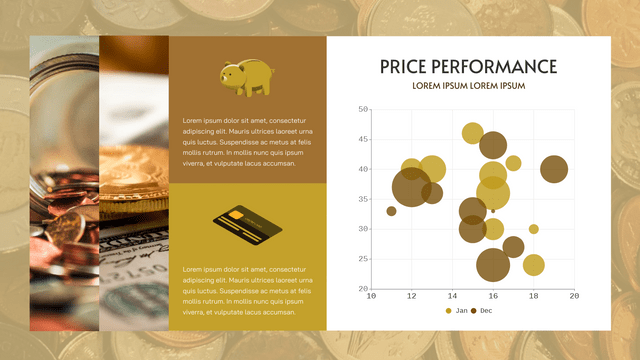
What Is A Bubble Chart Bubble chart shows the data by bubbles in different sizes and position, while colors can be used to represent different categories. As they are drawn in the same scale, we can clearly see the trend of specific issues over time. When To Use Doughnut Chart When there are more than 3 sets of data is going to show in a chart, then bubble chart will be a good choice for you. As they are shown as a bubble instead of a point or column, it will be difficult to…
continue reading →
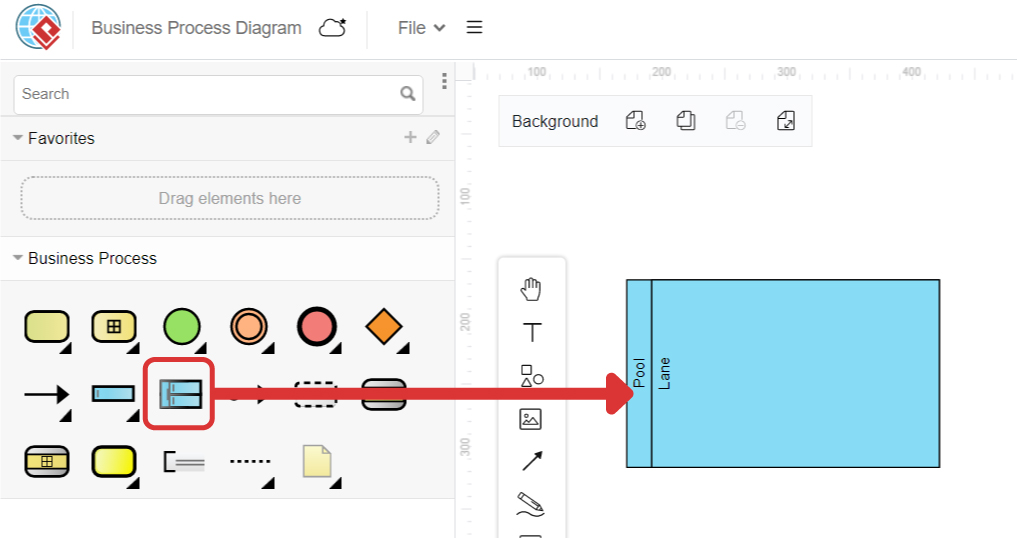
Business Process Model and Notation (BPMN) is a graphical notation for modeling business processes, which is widely adopted by organizations to model, analyze, and communicate their business processes. It provides a standardized approach for modeling the flow of activities within a business process, making it easier for all stakeholders to understand the process and collaborate in its improvement. In BPMN, a pool represents a participant in a business process, while a lane represents a functional decomposition within a participant. Understanding the differences between pools and lanes is essential for effectively modeling business processes…
continue reading →
-
Posted on May 18, 2022
-
/Under Chart
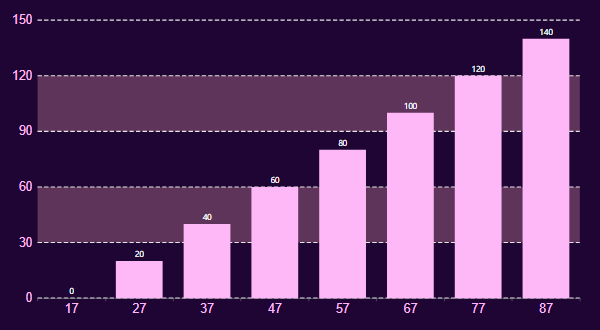
In bar charts and column charts, the length of the bars are changed according to the value. Although we can read the value by the split lines, we sometimes may not get the exact number, while extra time is also needed. In this case, we may choose to show the values on the chart directly. How To Show Values On Bar Charts https://www.youtube.com/watch?v=JUcNMfi2Sc8&width=854&height=480 Under Panel-Chart, there is a option Label. Click it and you will finds that there are numbers on the top of each of the bars. Moreover, we can customize the style…
continue reading →

