




BPMN with Visual Paradigm AI: A Comprehensive Guide
Introduction
In today’s fast-paced business environment, clear communication and efficient workflows are the backbone of organizational success. Yet, many teams struggle to translate complex processes into understandable, actionable models. This is where Business Process Model and Notation (BPMN) comes in—the global standard that has revolutionized how businesses visualize, analyze, and optimize their workflows.
For years, creating professional BPMN diagrams required specialized expertise and significant time investment. But the landscape has changed. With the introduction of AI-assisted features in modern tools like Visual Paradigm, the gap between textual descriptions and executable process models has never been narrower. What once took hours of manual diagramming can now be accomplished in minutes, making professional-grade business process modeling accessible to everyone—from business analysts to project managers.
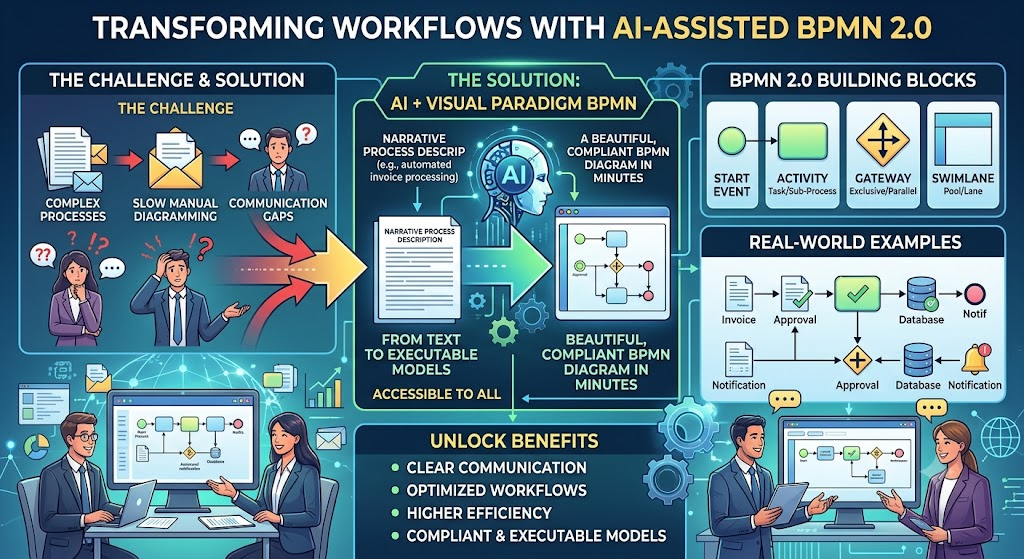
In this comprehensive guide, we’ll explore the fundamental building blocks of BPMN 2.0, from core elements like events, activities, and gateways to advanced concepts like swimlanes and executable models. You’ll discover how AI-powered tools are transforming narrative descriptions into fully-compliant BPMN diagrams, and see real-world examples ranging from automated invoice processing to complex multi-organization workflows.
Whether you’re taking your first steps into business process modeling or looking to leverage cutting-edge AI capabilities to enhance your workflow design, this guide will equip you with the knowledge to create clear, effective, and executable business process models.
Key Concepts
1. Core BPMN Elements
BPMN relies on four fundamental building blocks to construct any business process:
-
Events: Represented by circles, these are things that “happen” during a process (e.g., Start, Intermediate, End events).
-
Activities: Represented by rounded rectangles, these are the work performed within the process (e.g., Tasks, Sub-Processes).
-
Gateways: Represented by diamonds, these control the divergence and convergence of flows (e.g., Exclusive, Parallel, Inclusive).
-
Flow Objects: Connect the elements, primarily through Sequence Flows (solid arrows) and Message Flows (dashed arrows with envelopes).
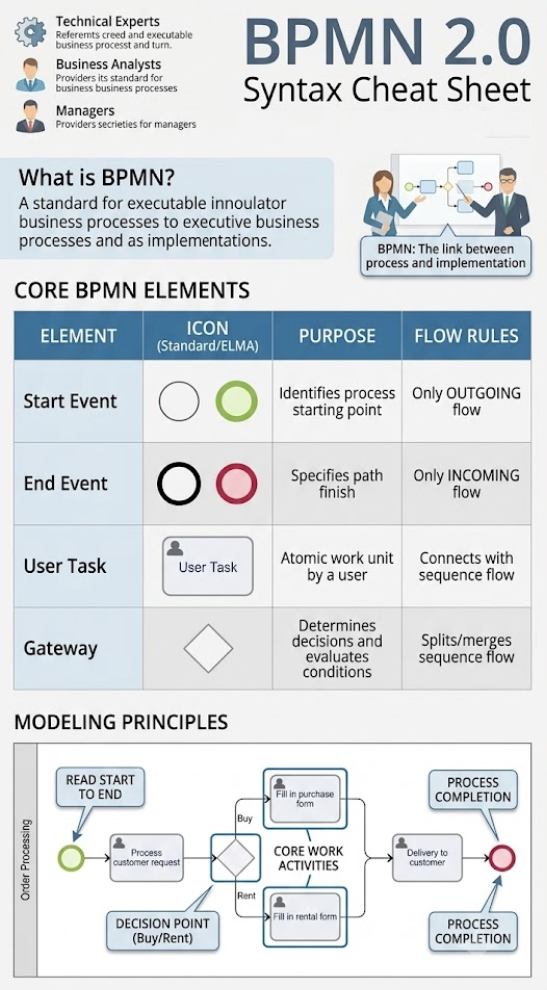
Diagram Example: A visual cheat sheet displaying the standard shapes: Start Event (green circle), End Event (red circle), Task (rounded rectangle), and Exclusive Gateway (diamond with an X).
2. Swimlanes and Pools
To model complex processes involving multiple roles or organizations, BPMN uses swimlanes:
-
Pools: Represent independent participants (e.g., different companies or distinct business units).
-
Lanes: Sub-divisions within a pool used to organize activities by role, department, or system (e.g., “Customer,” “Sales Dept,” “IT Support”).
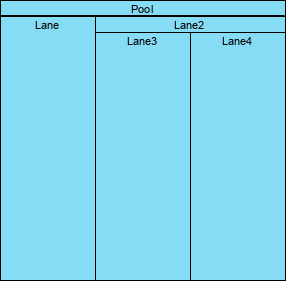
Diagram Example: A visual representation of a Pool divided into vertical Lanes, illustrating how responsibilities are grouped within a single process boundary.
3. Event Types
Events trigger or conclude actions within a process. They are categorized by timing:
-
Start Events: The beginning of a process (e.g., receiving an order).
-
Intermediate Events: Occur between tasks (e.g., waiting for a message or timer).
-
End Events: The termination of a process (e.g., order shipped or payment failed).

Diagram Example: Three circle shapes: a solid green circle for Start, a yellow circle with a double border for Intermediate, and a solid red circle with a thick border for End.
4. Gateway Logic
Gateways determine the flow path based on conditions or events:
-
Exclusive Gateway: Follows only one path (decision point).
-
Parallel Gateway: Splits or merges multiple paths that execute simultaneously.
-
Inclusive Gateway: Follows one or more paths based on conditions.
-
Event-Based Gateway: Waits for specific events to determine the path.

Diagram Example: A row of seven diamond shapes, each containing a unique symbol (e.g., X for Exclusive, + for Parallel, Circle for Inclusive) indicating different routing behaviors.
5. AI-Assisted BPMN Generation
Visual Paradigm’s AI BPMN Generator transforms plain-English text descriptions into fully editable BPMN 2.0 diagrams.
-
Input: Users provide a narrative describing the workflow.
-
Processing: The AI parses the text to identify roles (swimlanes), tasks, and decision points (gateways).
-
Output: A standard-compliant, editable Business Process Diagram is generated instantly.
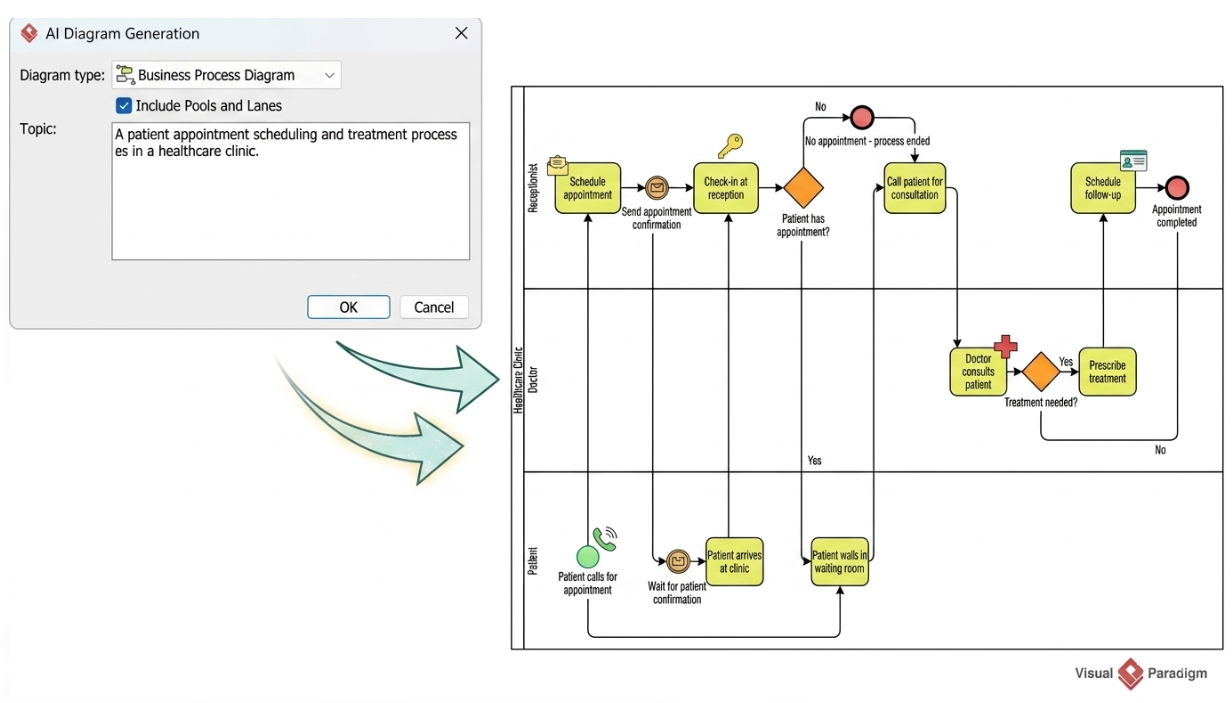
Diagram Example: An interface showing a text input box containing a patient appointment narrative, with a generated BPMN diagram appearing instantly with three swimlanes (Receptionist, Doctor, Patient).
6. Executable Process Models
BPMN diagrams in Visual Paradigm are not just static drawings; they are executable specifications.
-
Analysis: Run simulations to identify bottlenecks or resource constraints.
-
Transformation: Convert diagrams directly into executable code (e.g., BPEL) or integrate with BPM engines.
-
Agile Integration: Transform tasks into actionable backlog items or RACI models.
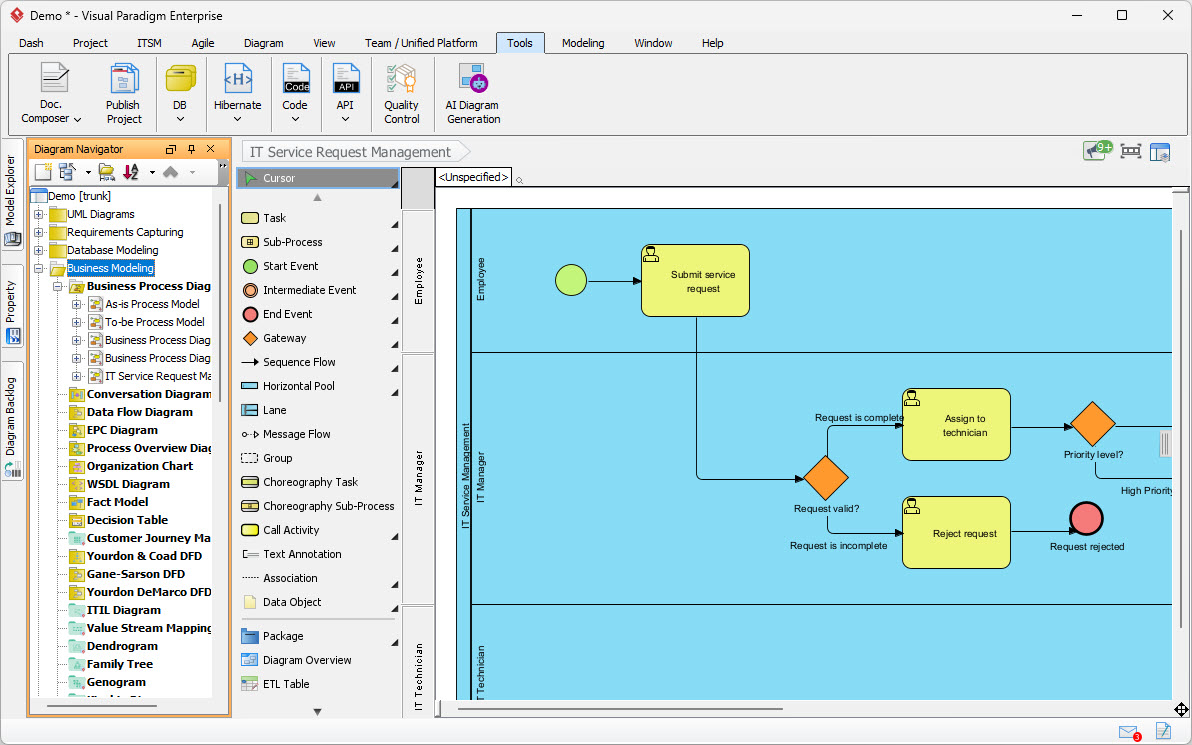
Diagram Example: A detailed BPMN diagram titled “IT Service Request Management” showing swimlanes for Employee, IT Manager, and Technician, with decision gates and parallel processing paths.
Examples
Example 1: Automated Invoice Processing
A standard process where an invoice is received, checked against purchase orders, and entered into the system.
Narrative: “An invoice arrives. The system checks if the invoice details match the purchase order. If there is a mismatch, the invoice is blocked. If it matches, the invoice is entered into the SAP system and processed.”
Generated Structure:
-
Swimlanes: SAP System, External
-
Gateway: Exclusive (Match?)
-
Flow:
-
Start Event → Task “Check Invoice Details”
-
Gateway “Invoice Present?” (Yes/No)
-
If “No”: Create New Entry → Insert Details
-
If “Yes”: Check for Mismatch → Block or Insert → End Event
-
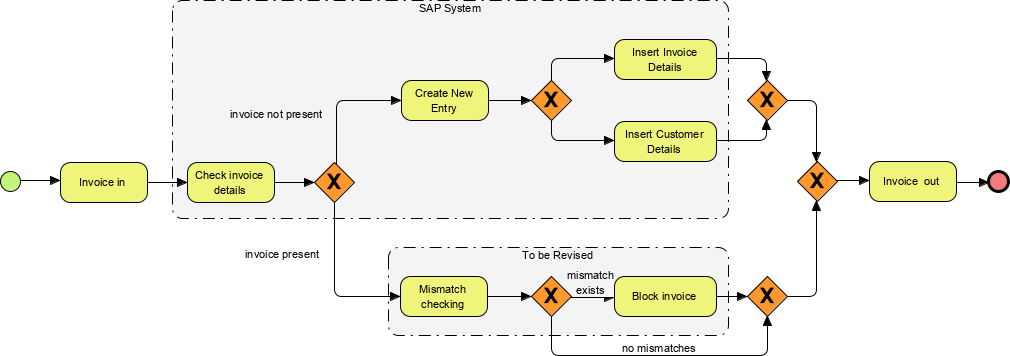
Diagram Example: A complex flowchart with dashed-line groups representing the “SAP System” and “To be Revised” sections, showing decision diamonds and multiple parallel paths for invoice handling.
Example 2: Employee Onboarding
A multi-role process involving HR and IT departments.
Narrative: “HR sends an offer letter. Once signed, HR notifies IT to prepare. IT creates an email account, grants system access, and sets up a laptop in parallel.”
Generated Structure:
-
Swimlanes: HR, IT
-
Gateway: Parallel (Split after “Notify IT”)
-
Flow:
-
HR: Send Offer → Collect Documents → Notify IT
-
IT Parallel Gateway: Split into “Create Email”, “Grant Access”, “Set Up Laptop”
-
Convergence and End Event
-
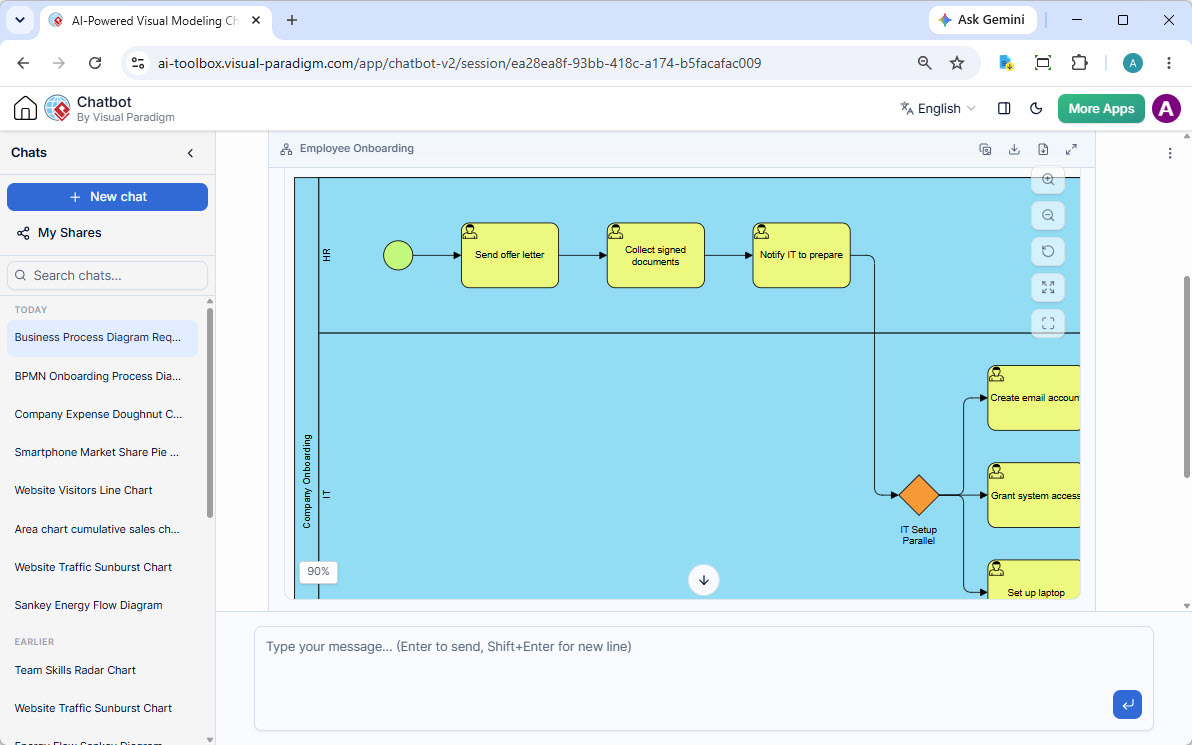
Diagram Example: A clean workflow with an HR lane performing sequential tasks, followed by a parallel gateway splitting the flow into three simultaneous IT tasks.
Example 3: Order Fulfillment with Warehousing
A process demonstrating how to handle stock availability and shipping.
Narrative: “Customer places an order. Sales checks stock. If insufficient, suggest a change. If sufficient, Warehouse packs and ships goods.”
Generated Structure:
-
Swimlanes: Customer, Online Shop, Warehouse
-
Gateway: Exclusive (Sufficient Stock?)
-
Flow:
-
Customer → Place Order
-
Shop → Check Stock Level
-
Gateway “Sufficient Stock?”
-
No: Suggest Change → End
-
Yes: Request Pack Goods → Warehouse Pack → Ship → Invoice → End
-
-
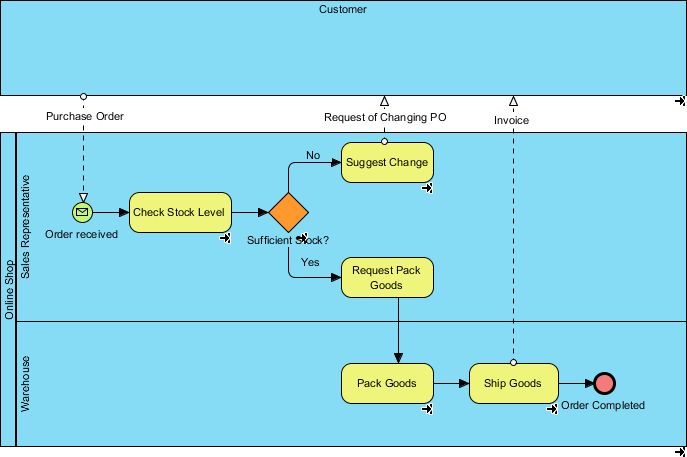
Diagram Example: A swimlane diagram showing the flow from “Purchase Order” through stock checking, branching into “Request Pack Goods” for the warehouse, and concluding with “Order Completed.”
Example 4: IT Service Request Management
A complex scenario involving validation and priority assignment.
Narrative: “Employee submits a request. IT Manager checks validity. If valid, assign to Technician based on priority. If invalid, reject.”
Generated Structure:
-
Swimlanes: Employee, IT Manager, Technician
-
Gateways: Valid? (Exclusive), Priority? (Parallel/Inclusive)
-
Flow:
-
Employee → Submit Request
-
Manager → Check Validity
-
Gateway “Request Valid?”
-
No: Reject Request → End
-
Yes: Assign to Technician → Priority Gateway → Technician handles
-
-
Diagram Example: A professional diagram showing the validation gate and priority routing, highlighting how complex decision logic is structured across different organizational roles.
Example 5: Customer Onboarding Workflow
A retail example demonstrating simple branching logic.
Narrative: “Customer submits a request. Staff reviews intent: Buy or Rent? Fill respective forms, then proceed to delivery.”
Generated Structure:
-
Swimlanes: Customer, Store Staff
-
Gateway: Decision (Buy/Rent)
-
Flow:
-
Start → Process Request
-
Gateway: Buy? / Rent?
-
Branch A: Fill Purchase Form → Delivery
-
Branch B: Fill Rental Form → Delivery
-
Example 6: Nobel Prize Nomination Process
A multi-organization example using message flows.
Narrative: “Committee sends forms to Nominators. Experts assess candidates. Committee collects reports and selects winners.”
Generated Structure:
-
Pools: Nobel Committee, Nominator, Expert, Assembly
-
Message Flows: Dotted lines with envelopes (Nomination Form, Assessment Report)
-
Flow: Cross-pool communication showing the exchange of documents and data objects.
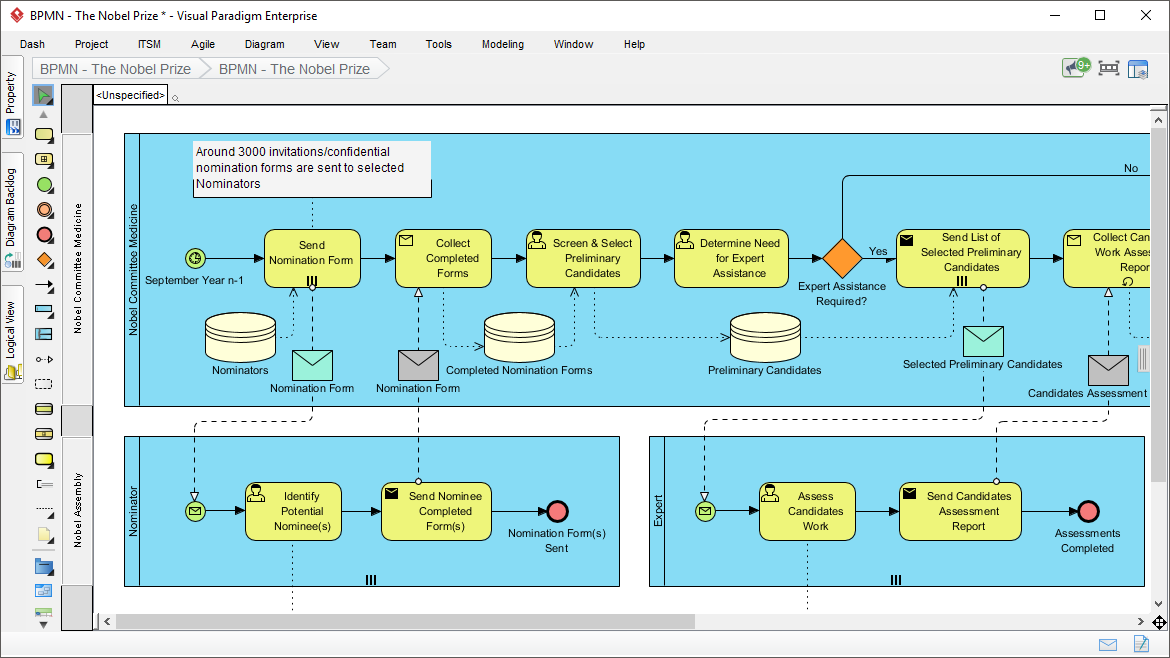
Diagram Example: A detailed diagram showing multiple pools and message flows, illustrating the exchange of “Nomination Forms” and “Assessment Reports” between different entities.
BPMN Reference
-
BPMN for Beginners – A Complete Guide to Business Process Modeling Notation
-
How AI-Powered NLP is Revolutionizing Text-to-BPMN Generation for Enterprise Process Modeling
This post is also available in Deutsche, Español, فارسی, Français, English, Bahasa Indonesia, 日本語, Polski, Portuguese, Ру́сский, Việt Nam, 简体中文 and 繁體中文.
