




Mastering Apache ECharts in Visual Paradigm: From AI Prompt to Final Asset
Introduction
In the modern data-driven landscape, creating compelling and interactive data visualizations is essential for effective storytelling and decision-making. Apache ECharts is a powerful tool for this purpose, but manually constructing its complex JSON configurations from scratch can be a daunting and time-consuming task. Visual Paradigm solves this challenge by bridging the gap between natural language ideation and precise code customization.
By integrating an intelligent AI Chatbot with VPasCode (Visual Paradigm as Code), users can now generate, fine-tune, and publish interactive ECharts seamlessly. This comprehensive guide walks you through the complete three-phase workflow, demonstrating how to transform a simple text prompt into a polished, publication-ready data asset without the friction of manual coding.
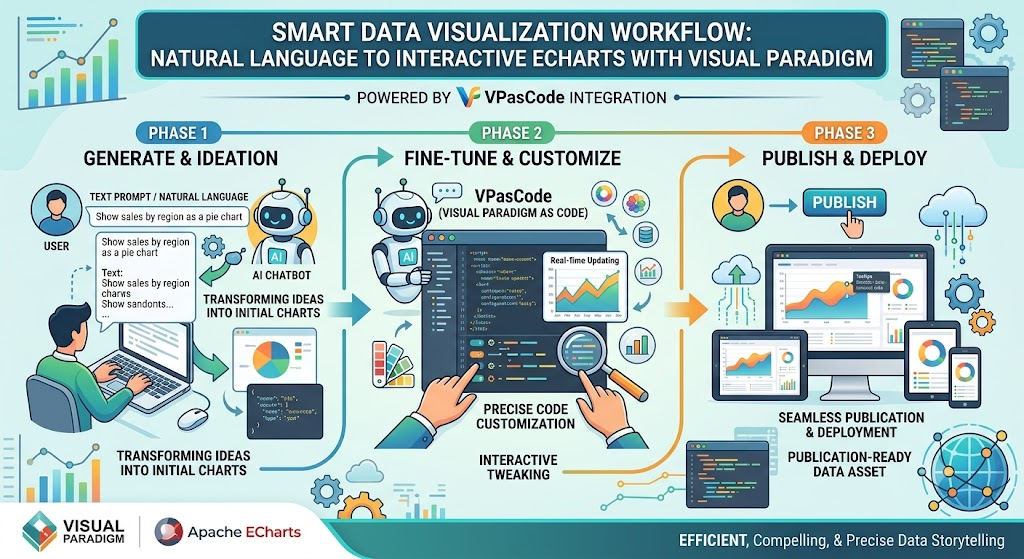
The 3-Phase ECharts Workflow
Phase 1: Instant Ideation with the AI Chatbot
The journey begins with conversational design, allowing you to focus on the what rather than the how.
-
Prompt the AI: Open the Visual Paradigm AI Chatbot interface and describe your target visualization using natural language. For example, you might type, “Generate a monthly sales bar chart for regional growth.”
-
Initial Rendering: The AI instantly interprets your request, constructs the underlying configuration logic, and generates a live visual preview of the chart directly within the chat window. This allows you to quickly validate the core concept and data structure before moving forward.
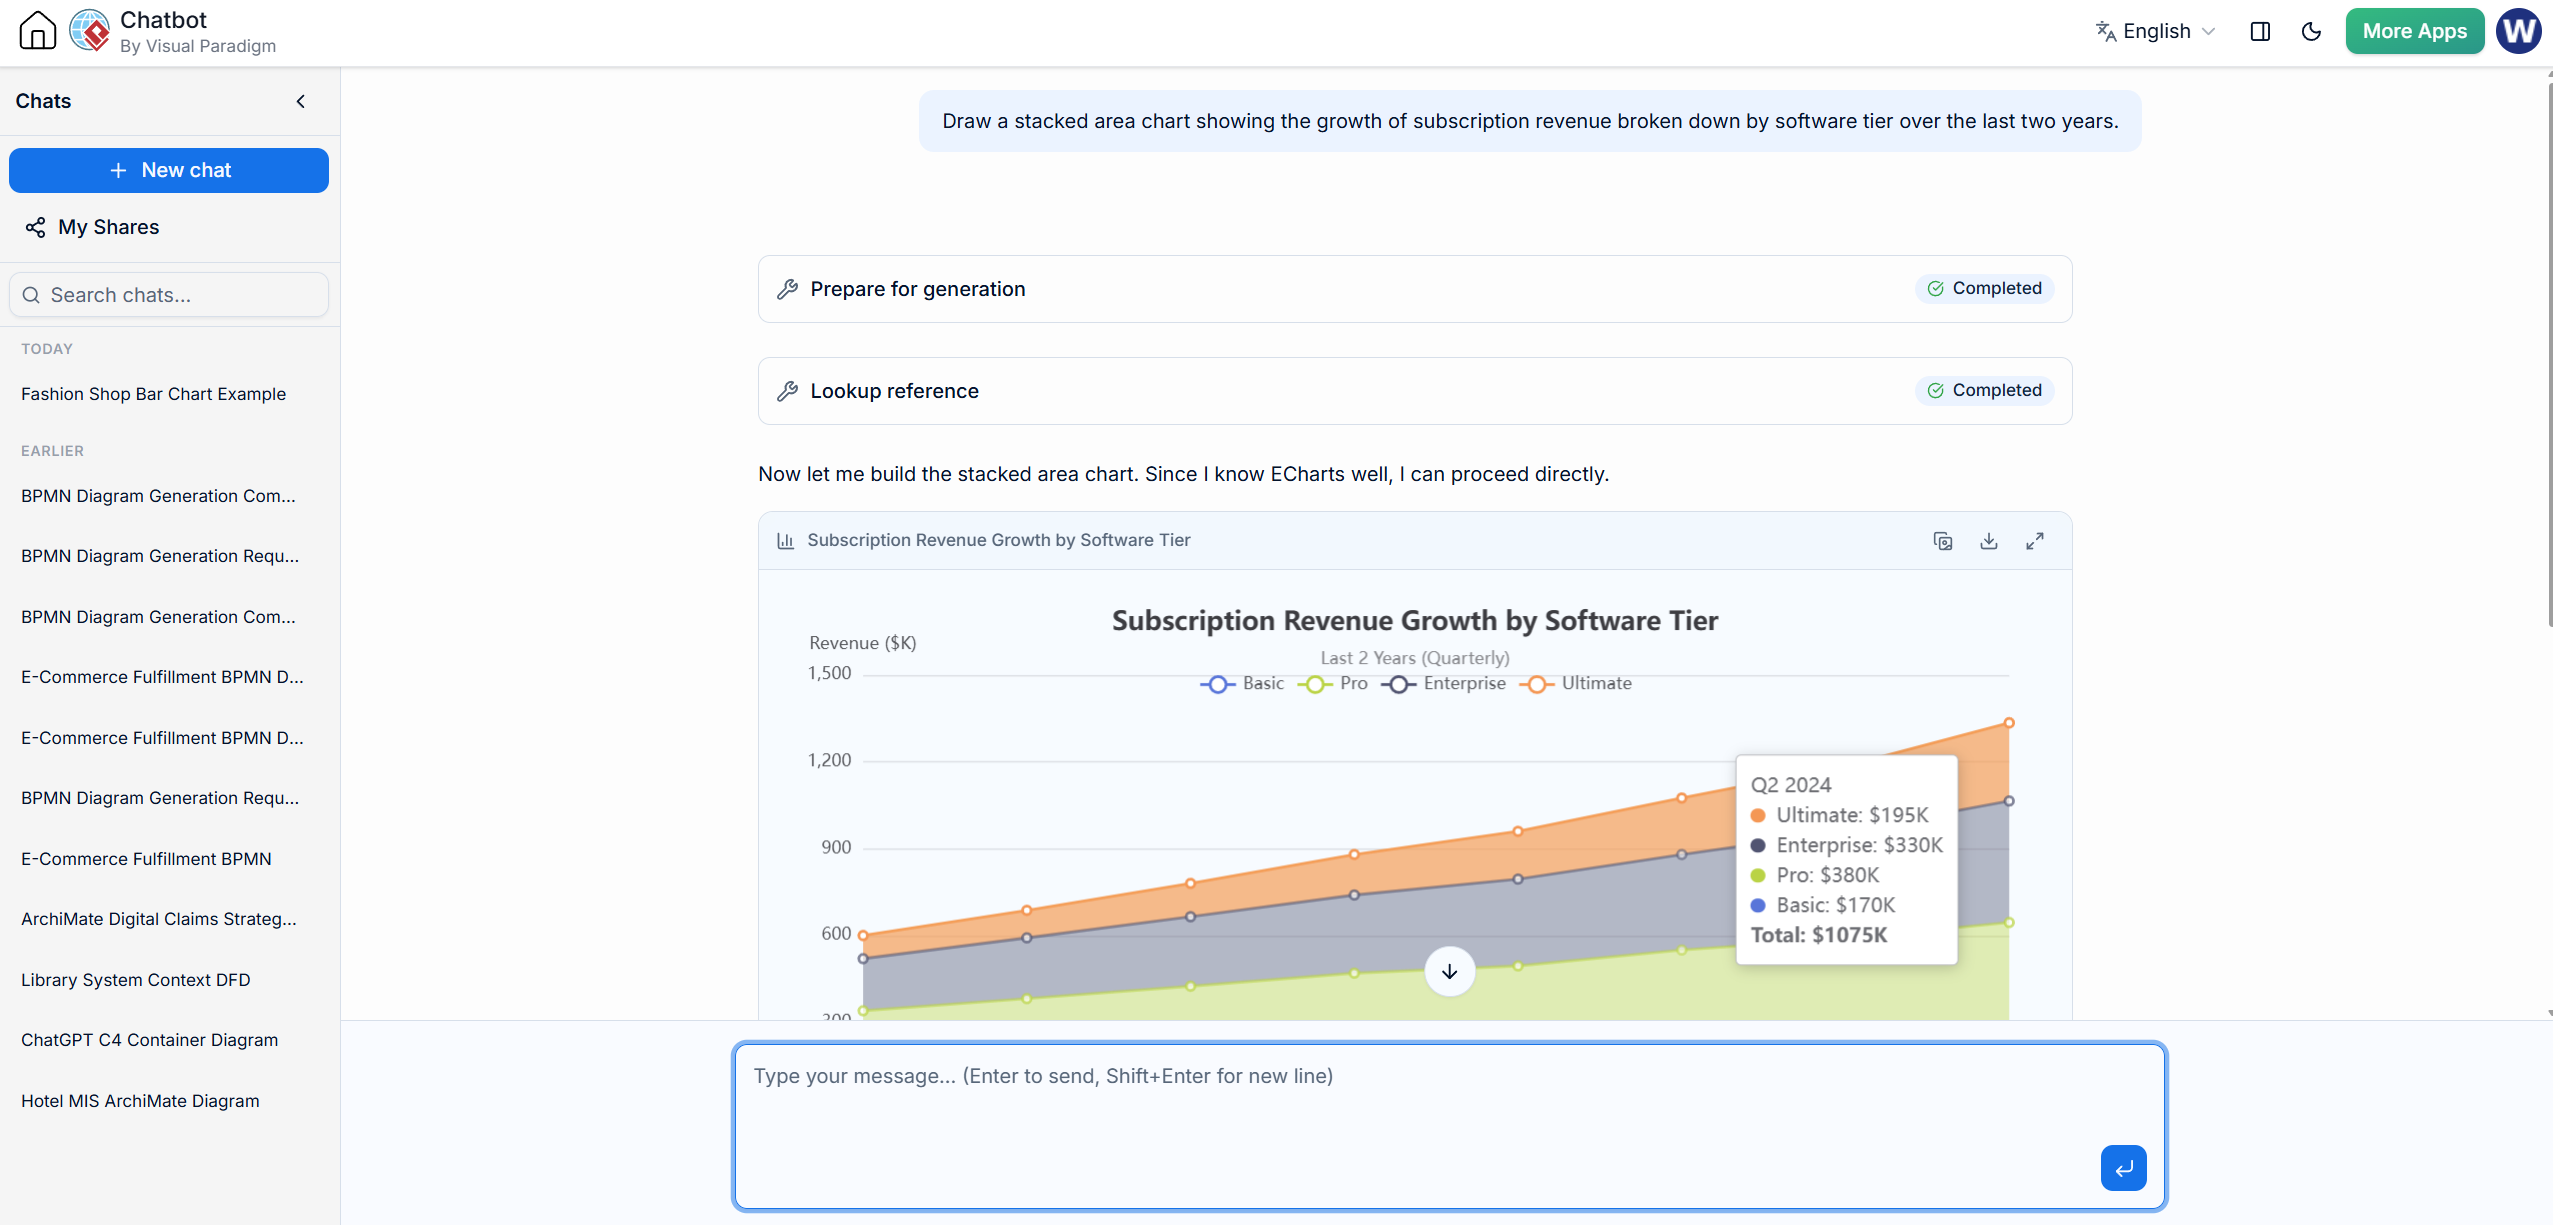
Figure of the AI Chatbot interface showing the prompt and initial chart preview
Phase 2: Seamless Transition via ‘Open in VPasCode’
Once the initial concept is validated, the workflow transitions smoothly from conversational AI to a robust code environment.
-
Locate the Bridge: Look for the Open in VPasCode button positioned directly beneath the AI-rendered chart preview in the chatbot interface.
-
Transfer Context: Click the button to automatically push the raw ECharts configuration and the embedded dataset straight into the VPasCode workspace. This critical step eliminates the need for manual copy-pasting, ensuring that all data parameters, axes, and initial styling are perfectly preserved.
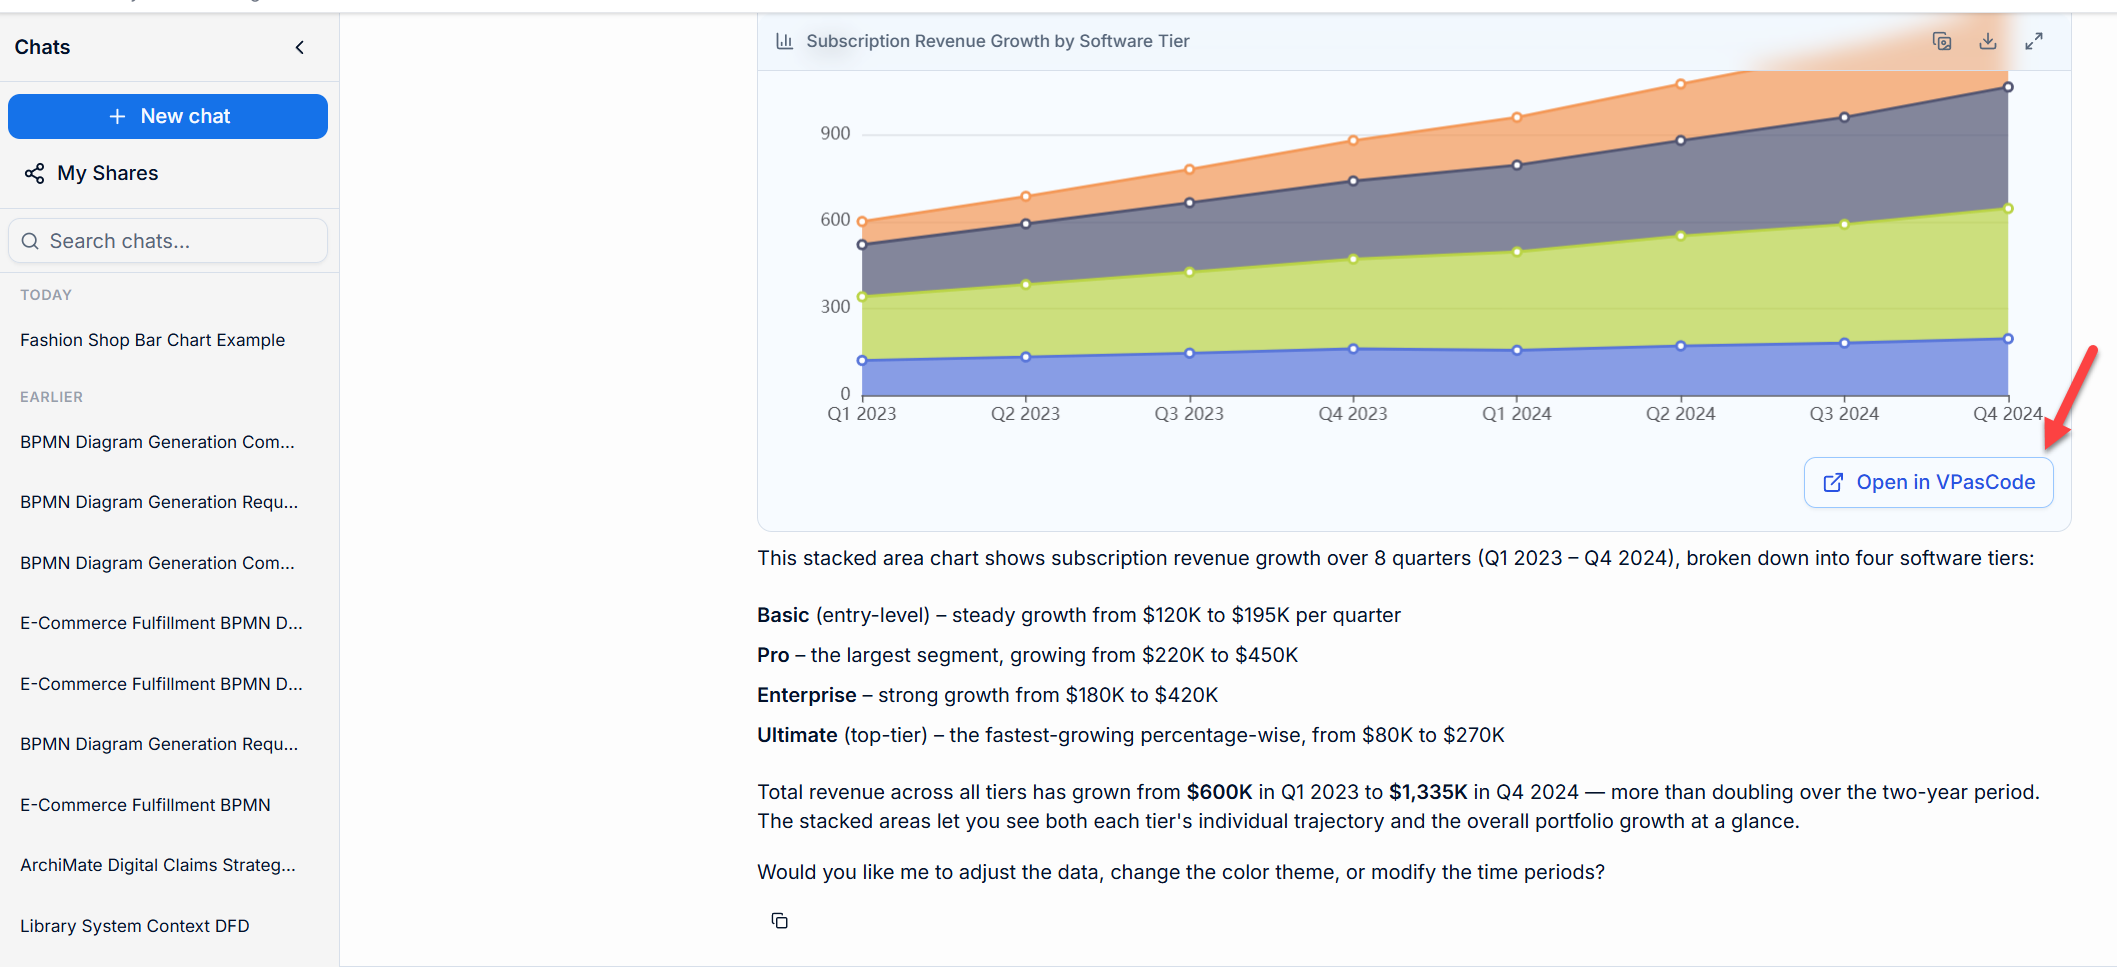
Figure: highlighting the ‘Open in VPasCode’ button and the transition process
Phase 3: Deep Customization and Export
With the foundational chart loaded into VPasCode, you gain full control over the final design and distribution.
-
Side-by-Side Control: The VPasCode workspace features a dual-pane interface. Use the code editor on the left panel to update data arrays, modify specific metrics, or tweak styling details—such as applying custom brand color palettes. The preview panel on the right updates instantly in real time, allowing you to see the impact of your code changes immediately.
-
Final Output: Once your chart is fully finalized and polished, you can export the interactive visualization. Choose to export it as a high-resolution image asset for static documents, or generate a live, shareable URL for dynamic web viewing.
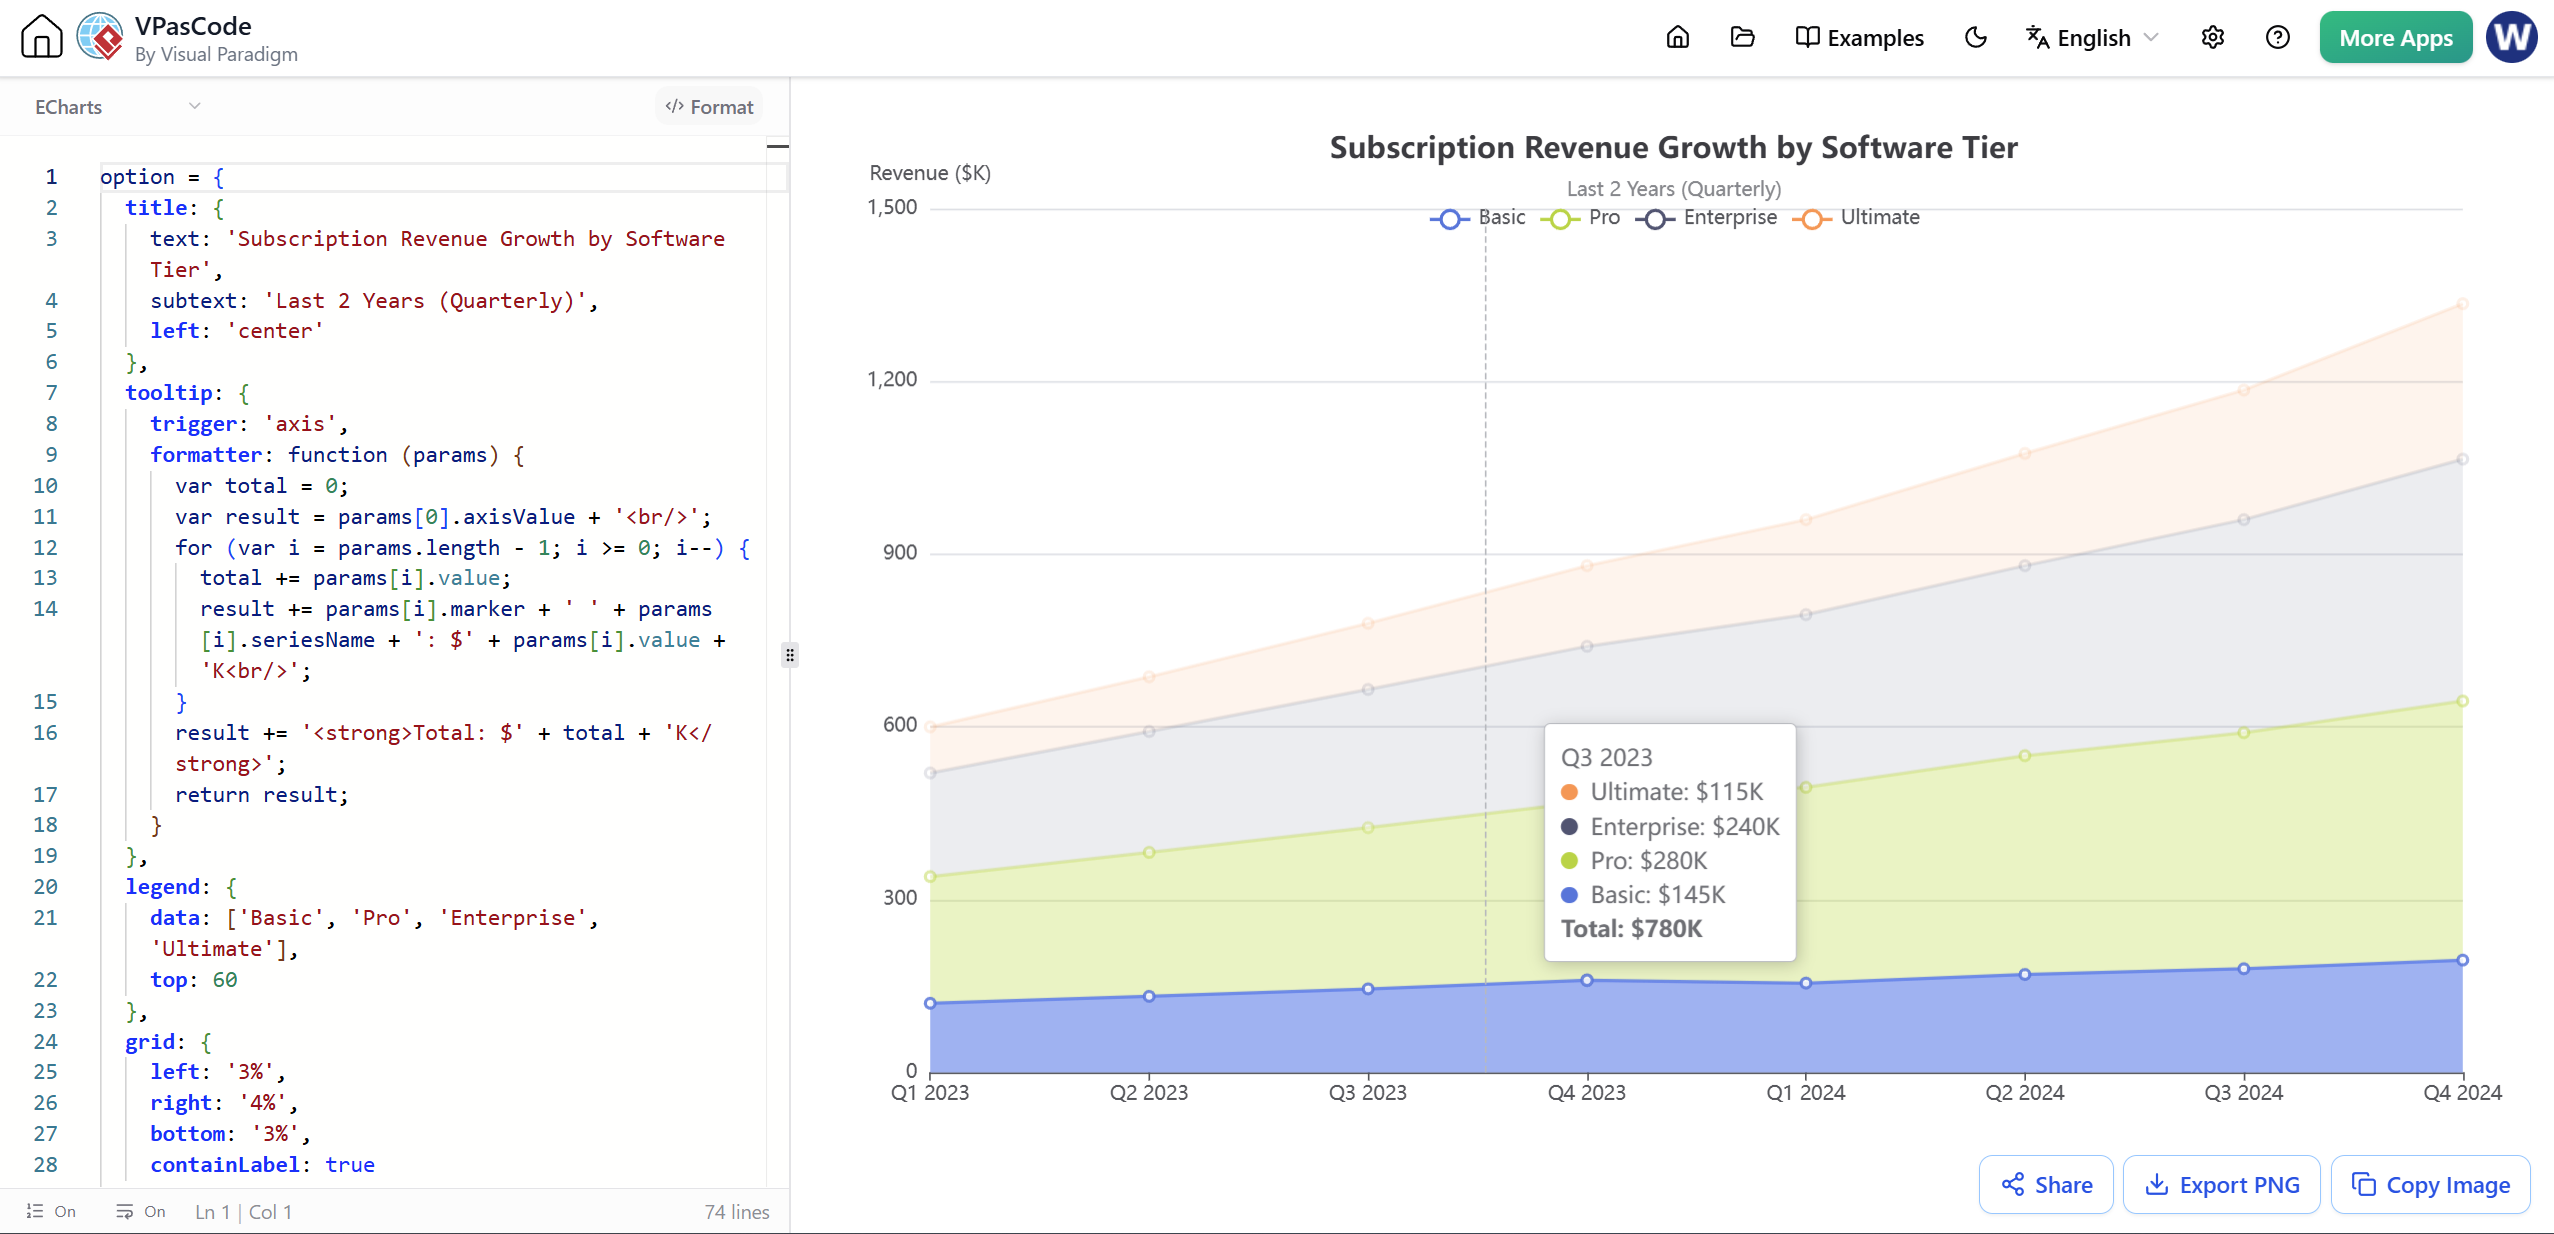
Figure: Insert original image of the VPasCode side-by-side editor and preview interface
Key Advantages of the Workflow
Adopting this integrated Visual Paradigm workflow offers several distinct benefits for data analysts, developers, and business professionals:
-
Zero-Friction Handoff: Moving from conversational ideation to technical code requires only a single click. This seamless handoff preserves all data parameters and eliminates context-switching fatigue.
-
Granular Precision: You benefit from the rapid prototyping speed of generative AI while retaining full code-level control. This ensures you can meet exact design specifications and brand guidelines without compromising on functionality.
-
Flexible Distribution: The workflow supports diverse output needs. You can easily export static, high-quality image assets for PDF reports and slide decks, or share dynamic live web links for interactive stakeholder viewing.
Conclusion
Visual Paradigm’s integrated ECharts workflow fundamentally simplifies the data visualization process. By combining the intuitive power of the AI Chatbot with the precision of VPasCode, it removes the traditional barriers to entry for creating complex Apache ECharts. Whether you are a developer looking to speed up your workflow or a business analyst needing to create precise, branded charts, this three-phase process ensures you can move from a simple idea to a final, polished asset with zero friction. Embrace this workflow to transform how you build, customize, and share your data stories.
References
-
VPasCode: Visual Paradigm as Code: Manage and customize Visual Paradigm assets using a code-based approach.
- Try the AI Diagramming Chatbot — Generate diagrams from natural-language descriptions and explore how AI can help with your modeling work.
- Explore Solutions & Use Cases — See how the AI Diagramming Chatbot can help you solve real-world modeling and diagramming needs across different industries and use cases.
- Learn More About AI Diagramming Chatbot — Explore the chatbot’s features, capabilities, and how it can support your diagramming workflow.
- Stay Updated on AI Diagramming Chatbot — See the latest features, enhancements, and improvements added to the AI Diagramming Chatbot.
This post is also available in Deutsche, Español, فارسی, Français, English, Bahasa Indonesia, 日本語, Polski, Portuguese, Ру́сский, Việt Nam, 简体中文 and 繁體中文.
