



Pairing VPasCode with OpenDocs: A Comprehensive Guide
The VPasCode–OpenDocs workflow connects diagram creation with documentation publishing:
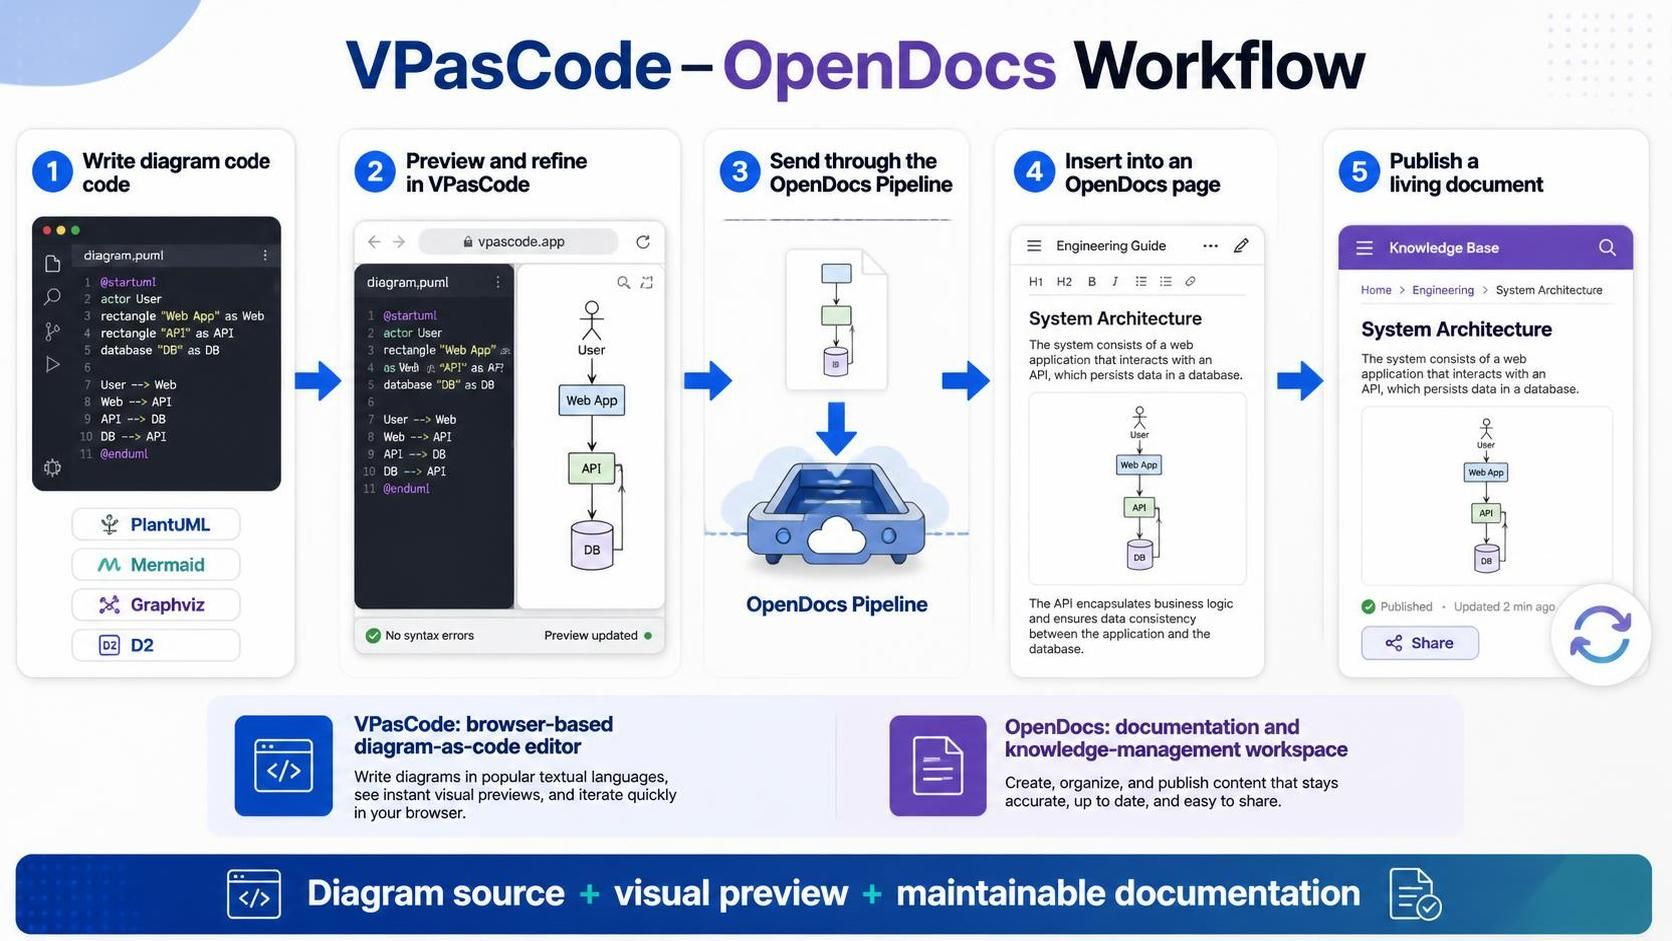
Textual Diagram:
Write diagram code
      ↓
Preview and refine in VPasCode
      ↓
Send through the OpenDocs Pipeline
      ↓
Insert into an OpenDocs page
      ↓
Publish a living document
VPasCode is Visual Paradigm’s browser-based diagram-as-code editor. It supports text-based formats such as PlantUML, Mermaid, Graphviz, D2, and other diagram syntaxes. OpenDocs is the documentation and knowledge-management workspace where those diagrams can be organized, explained, shared, and maintained. The integration allows a diagram and its source code to move from VPasCode into OpenDocs without manually exporting, downloading, and re-uploading image files.
1. What “pairing” VPasCode with OpenDocs means
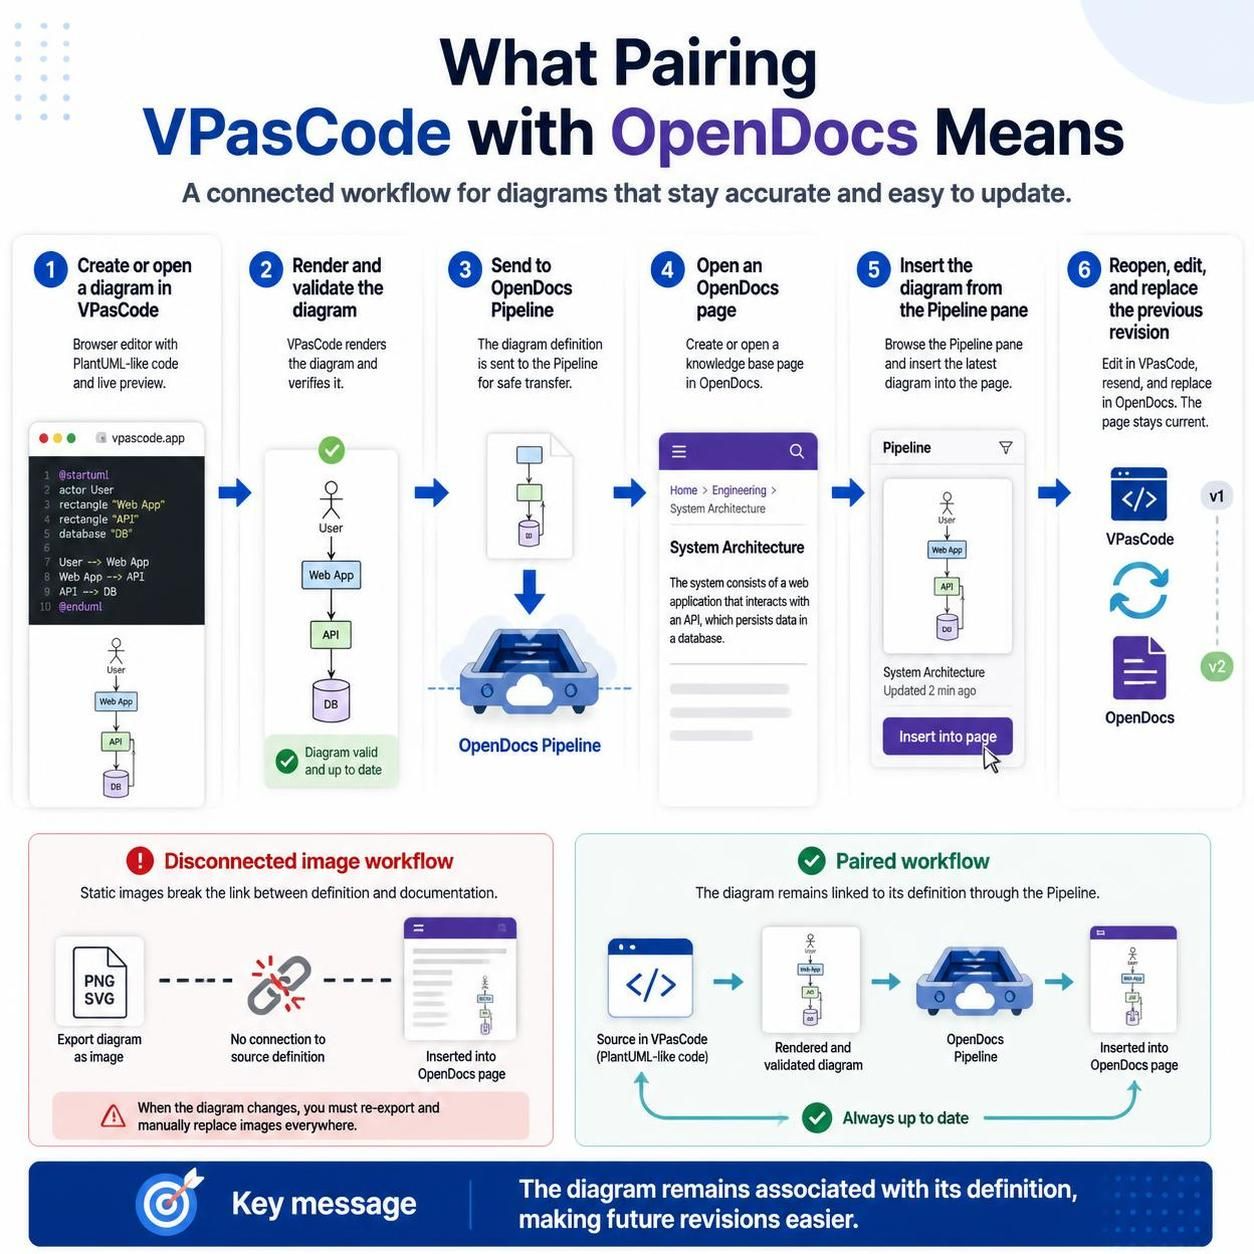
Pairing does not usually mean configuring a permanent account-to-account connection or installing a plug-in. It means using the Send to OpenDocs Pipeline workflow:
-
Create or open a diagram in VPasCode.
-
Render and validate the diagram.
-
Send it to the OpenDocs Pipeline.
-
Open an OpenDocs page.
-
Insert the diagram from the Pipeline pane.
-
Later, reopen the diagram in VPasCode, edit it, and replace the previous revision.
The important idea is that the diagram is not treated as a disconnected PNG or SVG attachment. It remains associated with the diagram definition, making future revisions much easier.
2. The role of each product
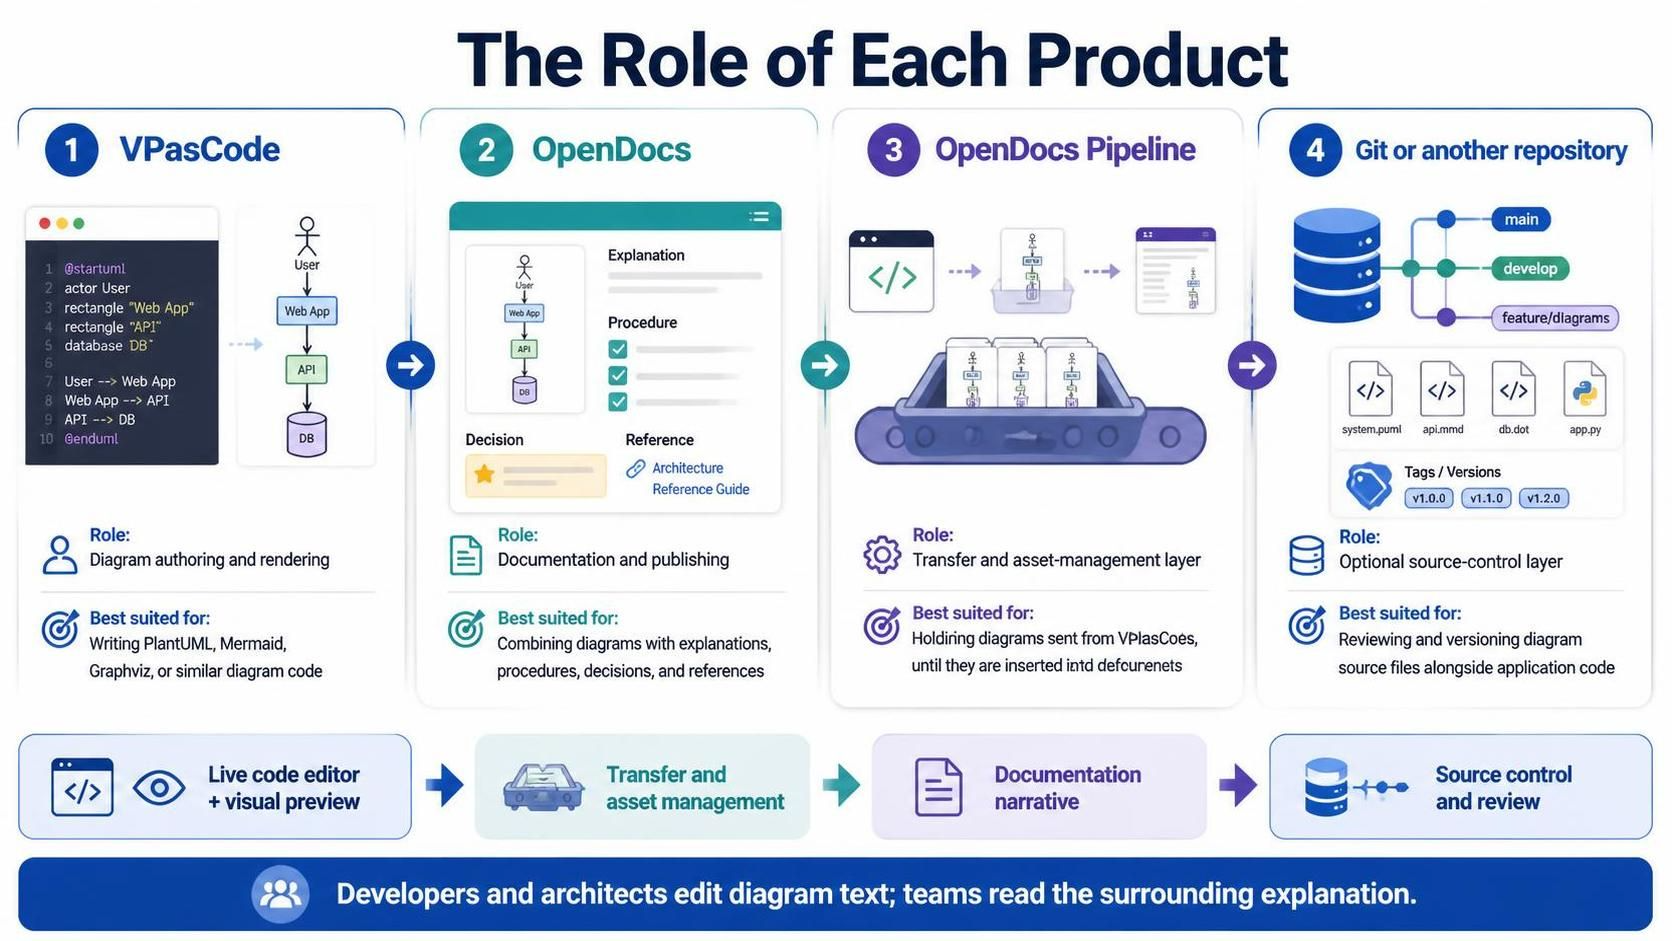
| Tool | Primary role | Best suited for |
|---|---|---|
| VPasCode | Diagram authoring and rendering | Writing PlantUML, Mermaid, Graphviz, or similar diagram code |
| OpenDocs | Documentation and publishing | Combining diagrams with explanations, procedures, decisions, and references |
| OpenDocs Pipeline | Transfer and asset-management layer | Holding diagrams sent from VPasCode until they are inserted into documents |
| Git or another repository | Optional source-control layer | Reviewing and versioning diagram source files alongside application code |
VPasCode provides a live code editor and visual preview. This makes it useful for developers and architects who prefer editing text rather than manually arranging shapes. OpenDocs provides the surrounding narrative: what the diagram means, why a decision was made, how a system is operated, and who owns it.
3. Prerequisites
Before starting, prepare the following:
-
Access to VPasCode.
-
Access to an OpenDocs workspace.
-
A PlantUML, Mermaid, Graphviz, or supported diagram definition.
-
An OpenDocs page where the diagram will be used.
-
Appropriate Visual Paradigm edition access if the Pipeline feature is edition-dependent.
The integration announcement identifies Visual Paradigm Online Combo and Visual Paradigm Desktop Professional with the relevant entitlement as supported editions. Licensing and feature availability can change, so check the edition attached to your account if the Pipeline button is not visible.
4. Basic pairing procedure
Step 1: Create the diagram in VPasCode
Open VPasCode and select the appropriate diagram engine. For example, choose PlantUML for formal UML or C4-style architecture diagrams.
Paste or write the diagram source in the editor. A simple example:
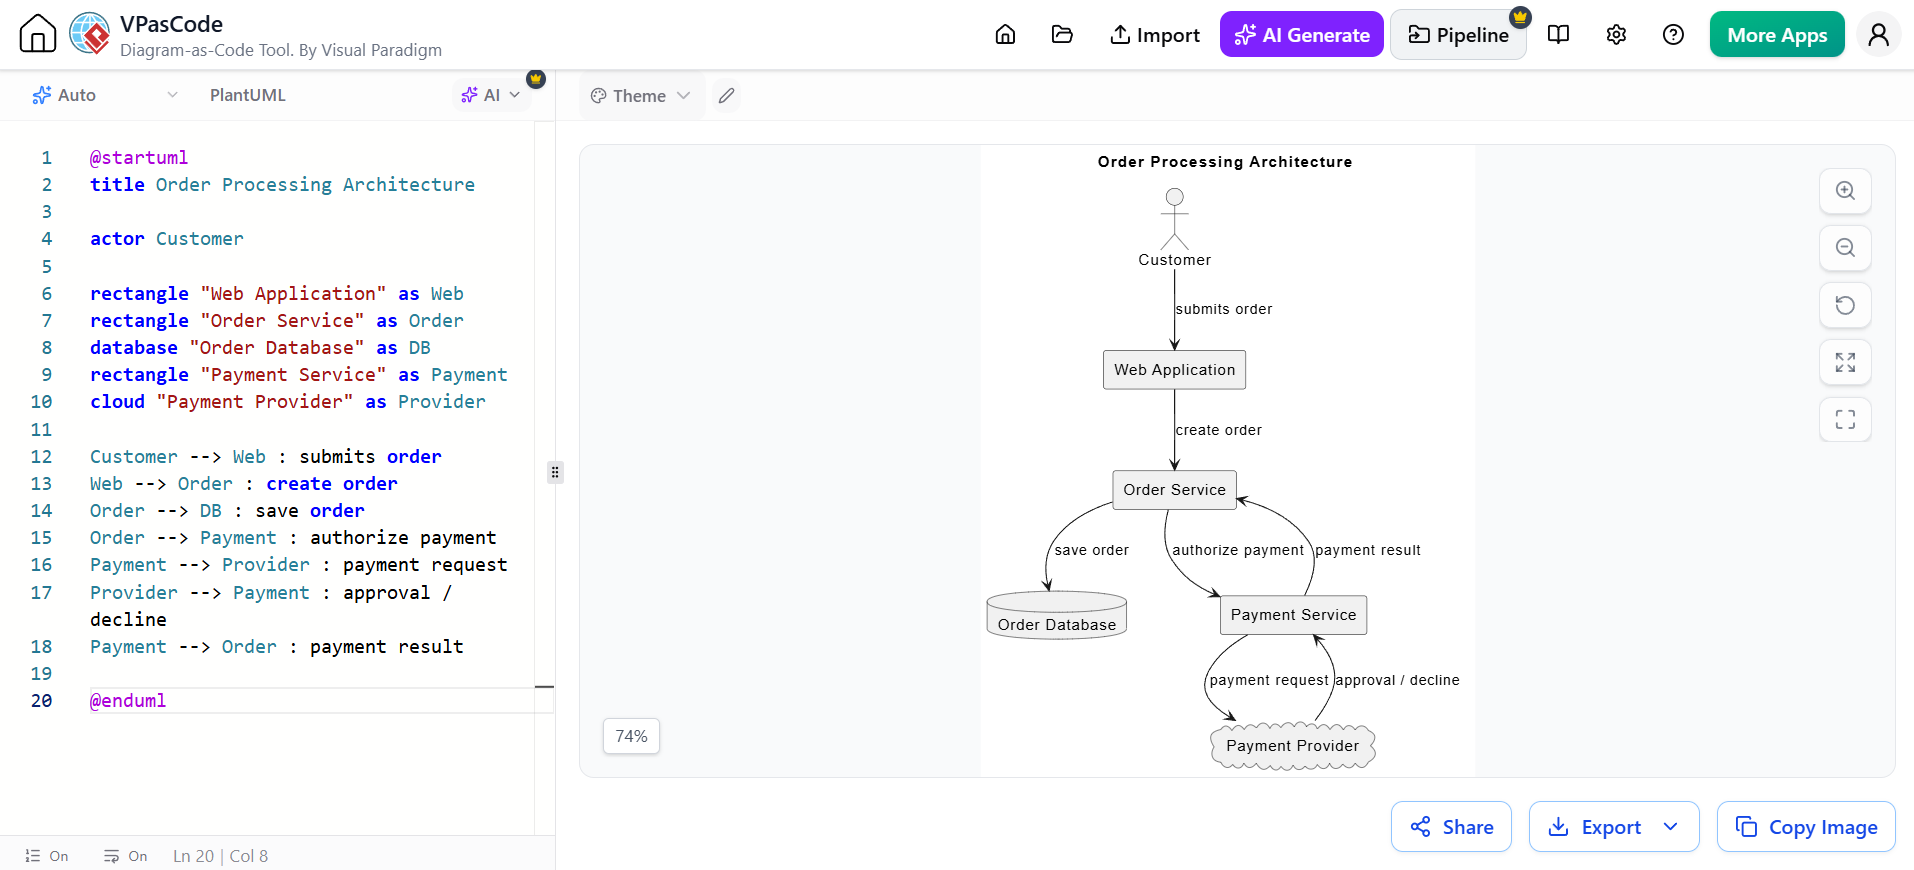
@startuml
title Order Processing Architecture

actor Customer

rectangle "Web Application" as Web
rectangle "Order Service" as Order
database "Order Database" as DB
rectangle "Payment Service" as Payment
cloud "Payment Provider" as Provider

Customer --> Web : submits order
Web --> Order : create order
Order --> DB : save order
Order --> Payment : authorize payment
Payment --> Provider : payment request
Provider --> Payment : approval / decline
Payment --> Order : payment result

@enduml
VPasCode renders the diagram as you edit it, allowing you to identify syntax problems and layout issues before sending it to OpenDocs. It supports real-time previewing and multiple text-to-diagram engines.
Step 2: Review the preview
Check the following before transferring the diagram:
-
Is the title descriptive?
-
Are actors, services, databases, and external systems clearly named?
-
Are relationships flowing in an understandable direction?
-
Are labels short enough to remain readable?
-
Does the diagram explain one subject rather than several unrelated subjects?
-
Is the level of detail appropriate for the intended audience?
For documentation, a smaller diagram with a clear purpose is often better than one enormous architecture map.
Step 3: Send the diagram to OpenDocs
In the VPasCode interface:
-
Look beneath or near the diagram preview.
-
Click Send to OpenDocs Pipeline.
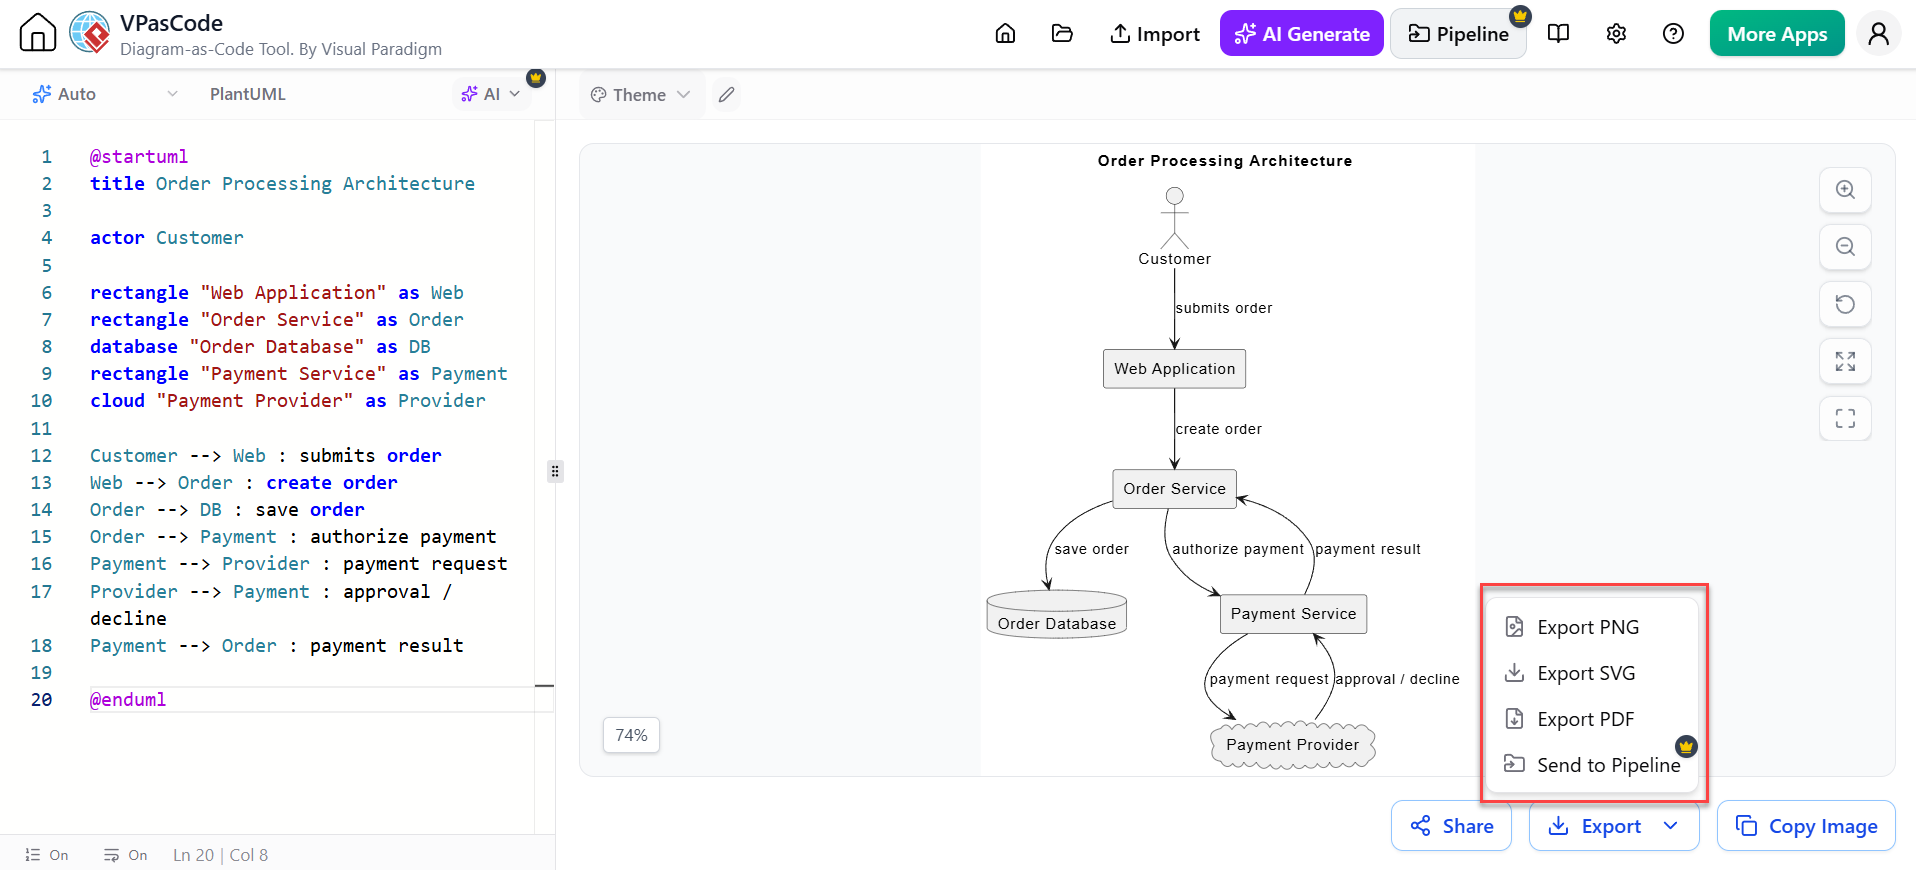
-
Enter a title.
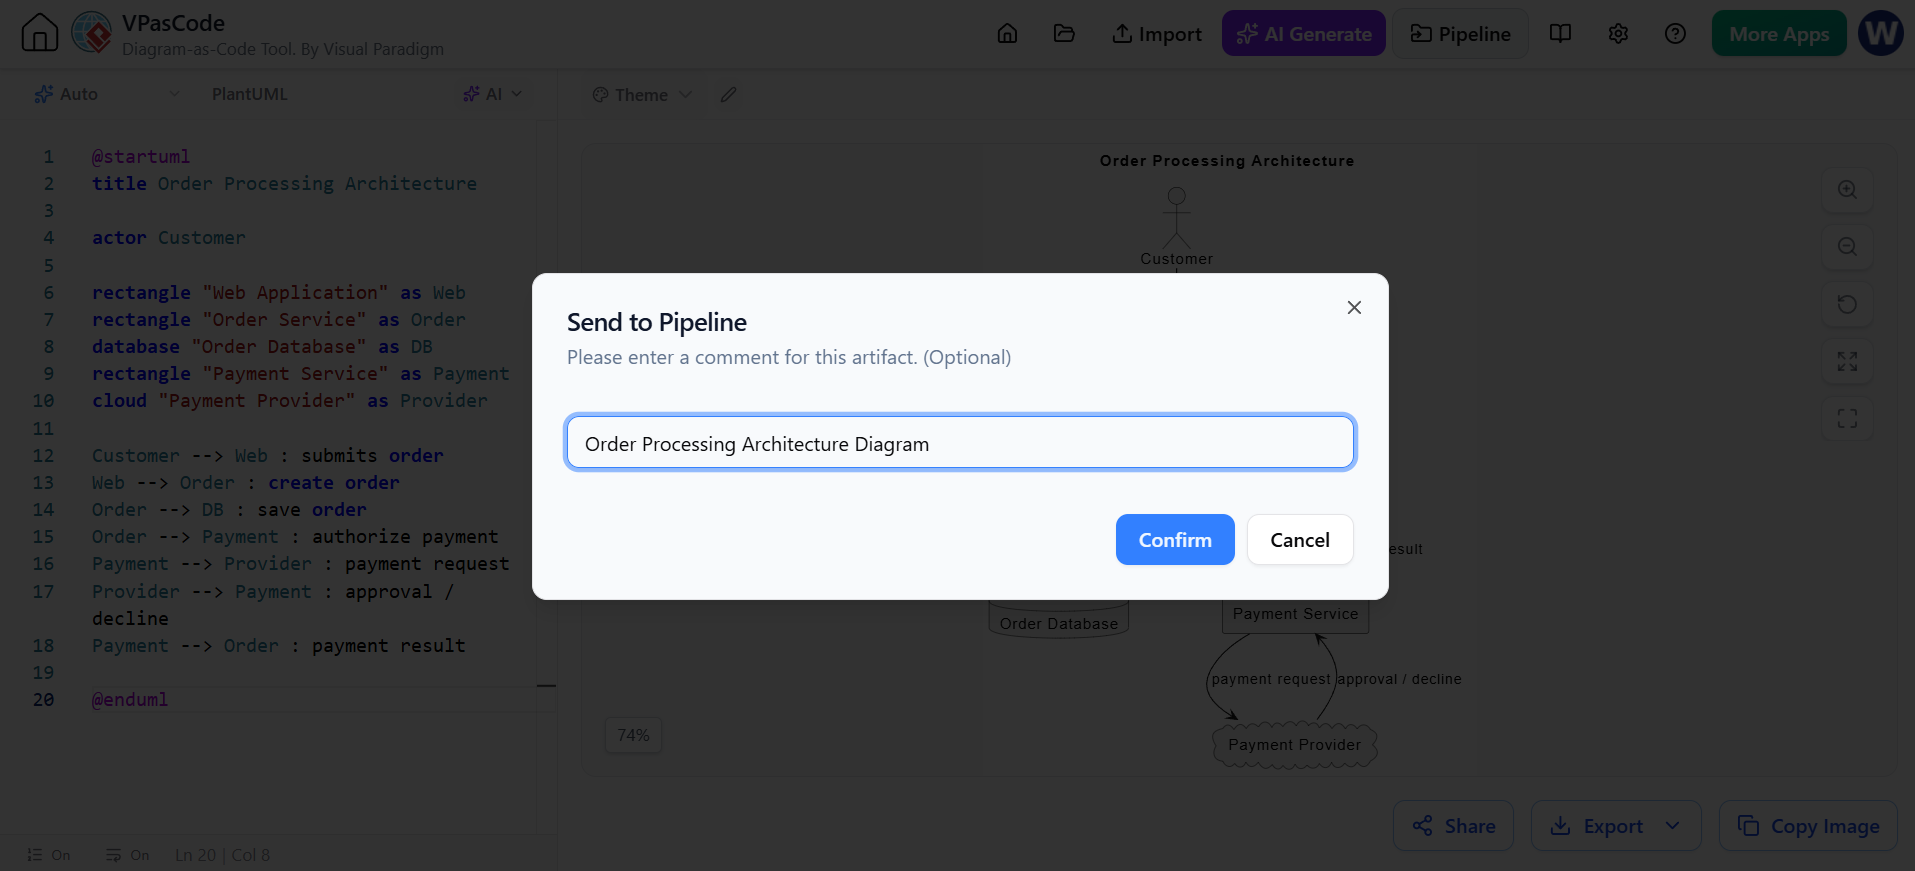
-
Click Confirm.
The transfer packages the diagram preview and its source definition for use in OpenDocs.
A useful description might be:
Order-processing architecture for version 2.4.
Added Payment Service and external payment-provider interaction.
Intended for the “Checkout Architecture” page.
Step 4: Open the OpenDocs Pipeline
Go to the OpenDocs Dashboard and open the page where the diagram belongs.
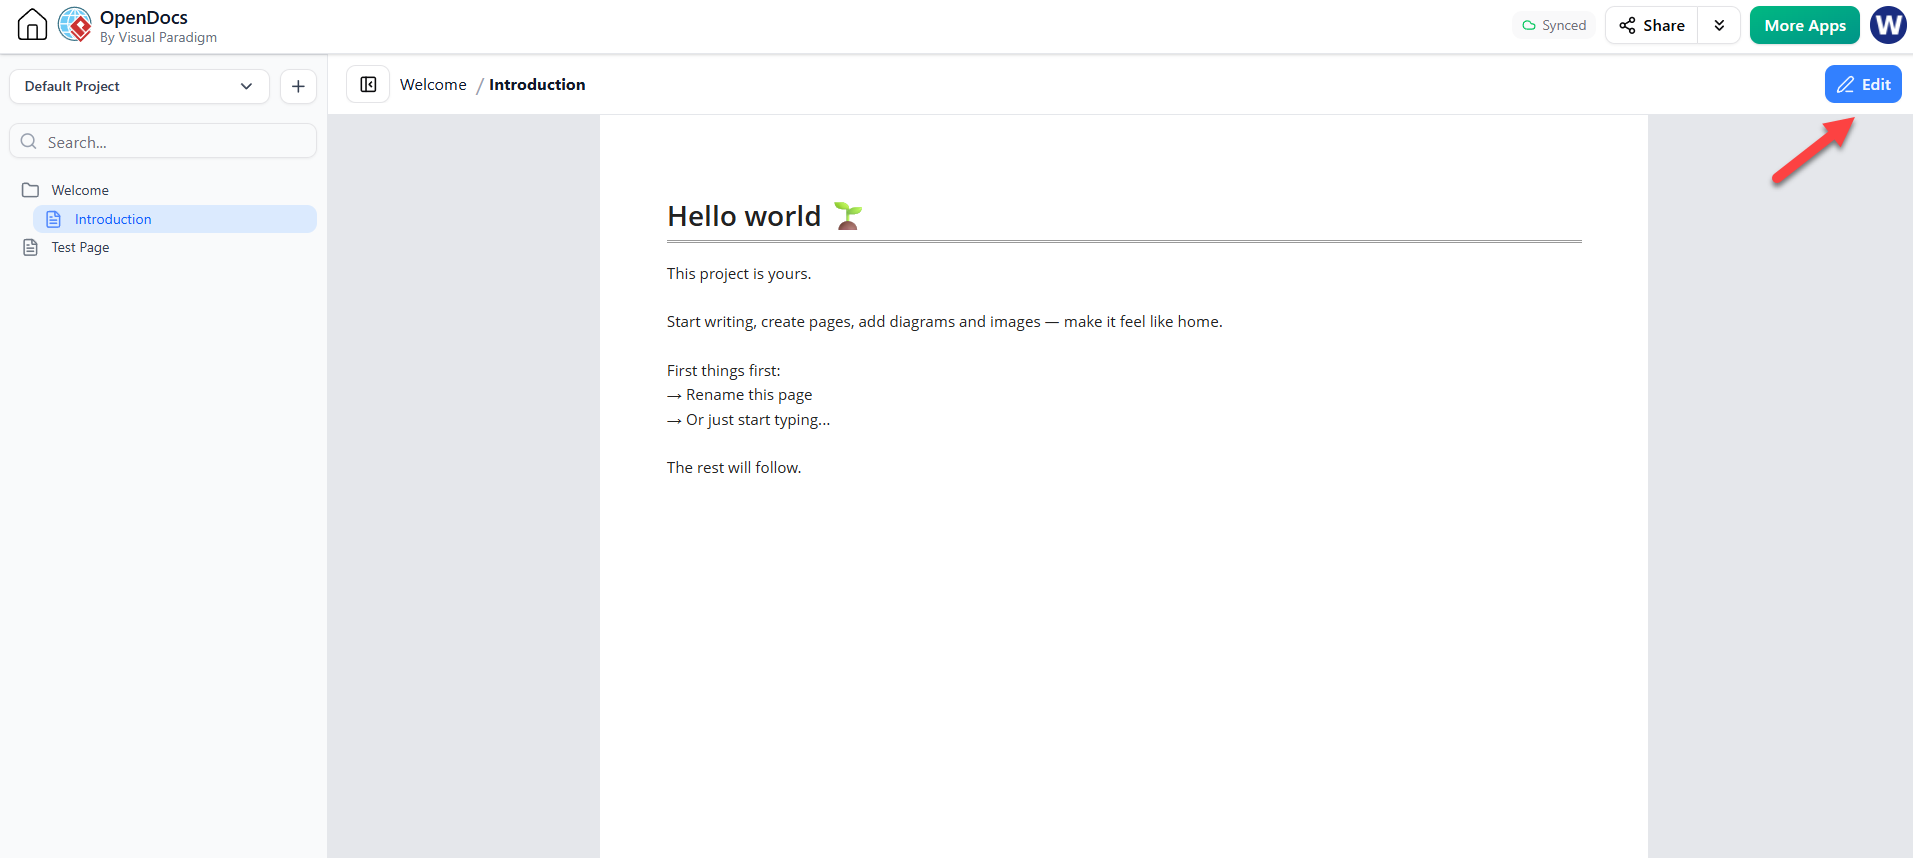
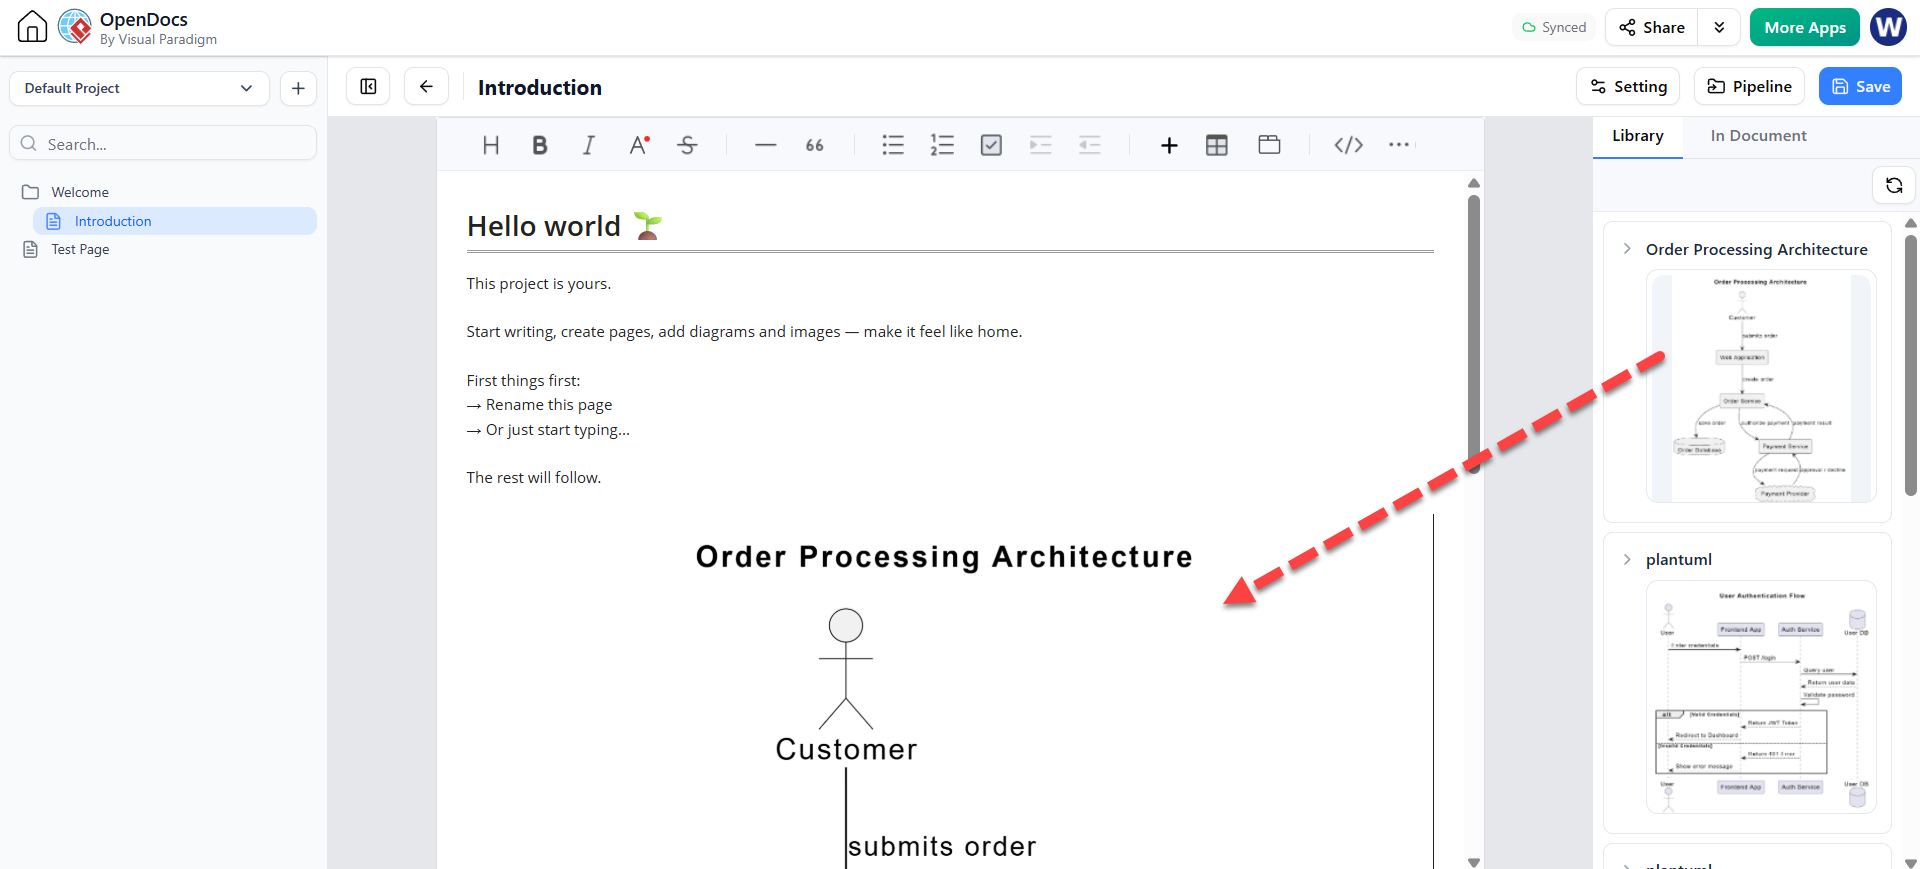
Open the Pipeline pane. Press Edit and Click on Pipline
The diagram sent from VPasCode should appear in the available asset list, usually with a thumbnail.
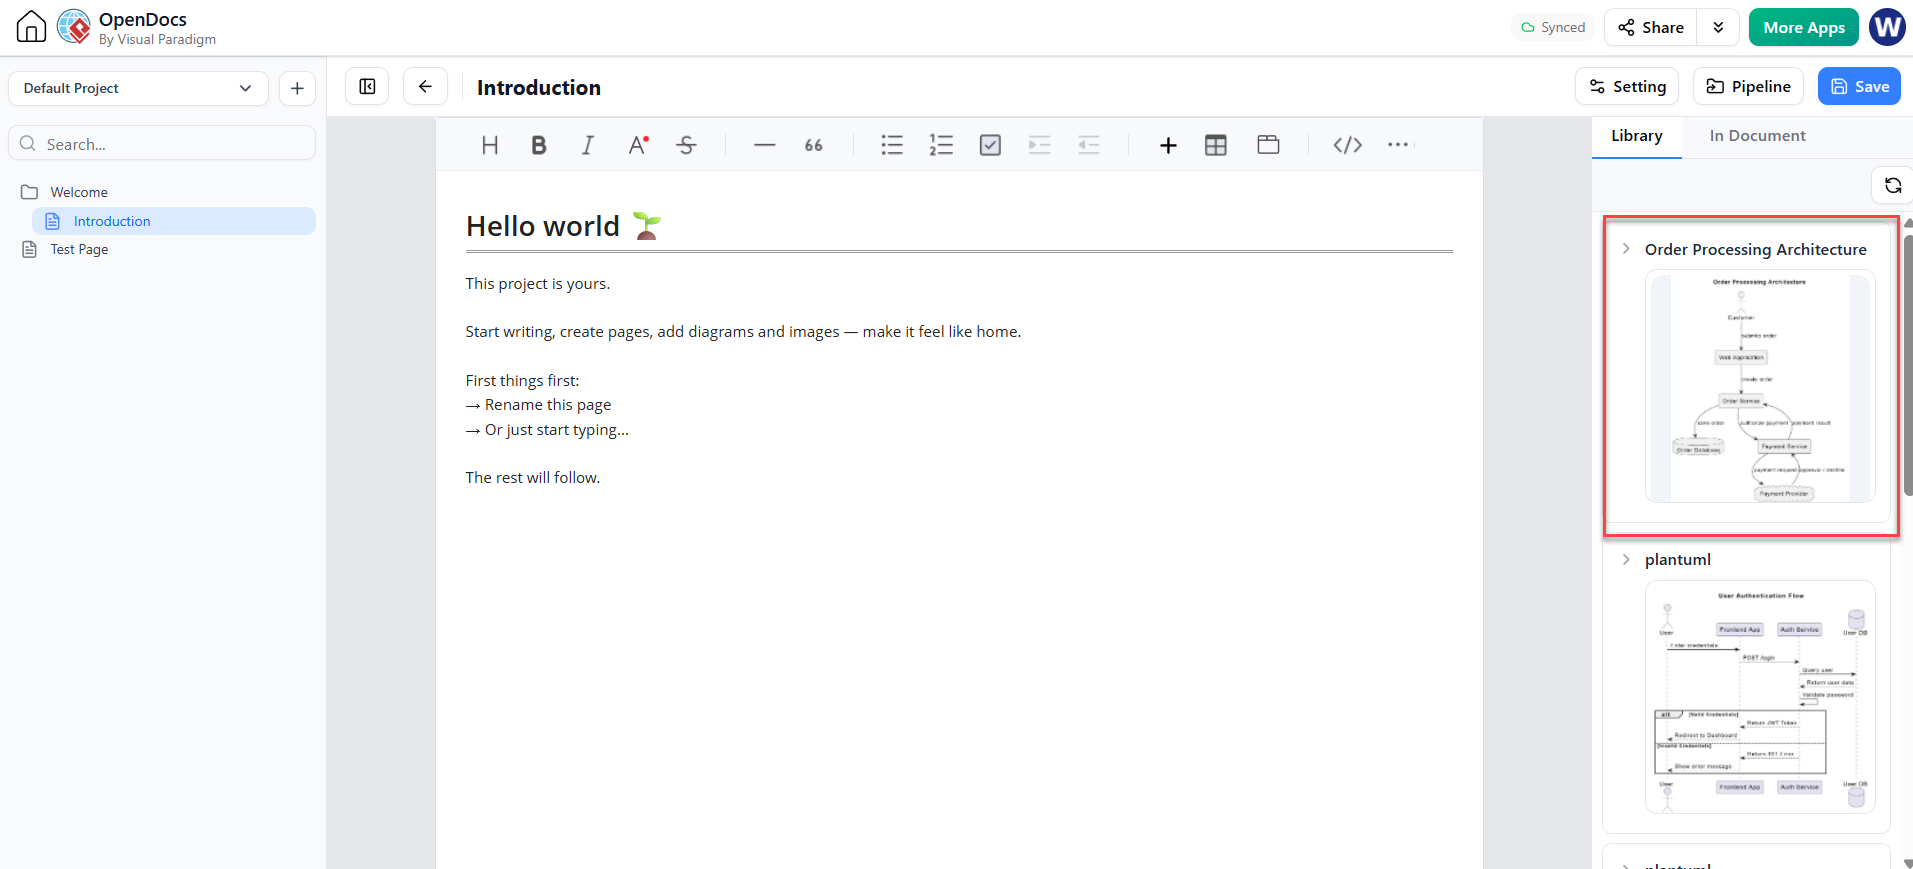
Step 5: Insert the diagram
In the Pipeline pane:
-
Find the diagram thumbnail.
-
Hover over it.
-
Select the Diagram.
-
Position it in the document.
-
Add explanatory text around it.
-
Save or publish the page.
The recommended workflow is to insert the diagram into a document that explains its context rather than publishing the visual by itself.
A good documentation section might look like this:
## Checkout architecture

The checkout process is split into order management and payment authorization.
The Order Service persists the order before requesting payment authorization.
This allows the system to retain an auditable order record even when the
external payment provider is temporarily unavailable.

[Inserted architecture diagram]

### Important behavior

- Payment authorization is performed asynchronously.
- The Payment Service does not access the Order Database directly.
- Failed payments return the order to the pending-payment state.
5. Updating a diagram already inserted into OpenDocs
The major advantage of the integration is the revision loop.
When the architecture changes:
-
Open the OpenDocs page containing the diagram.
-
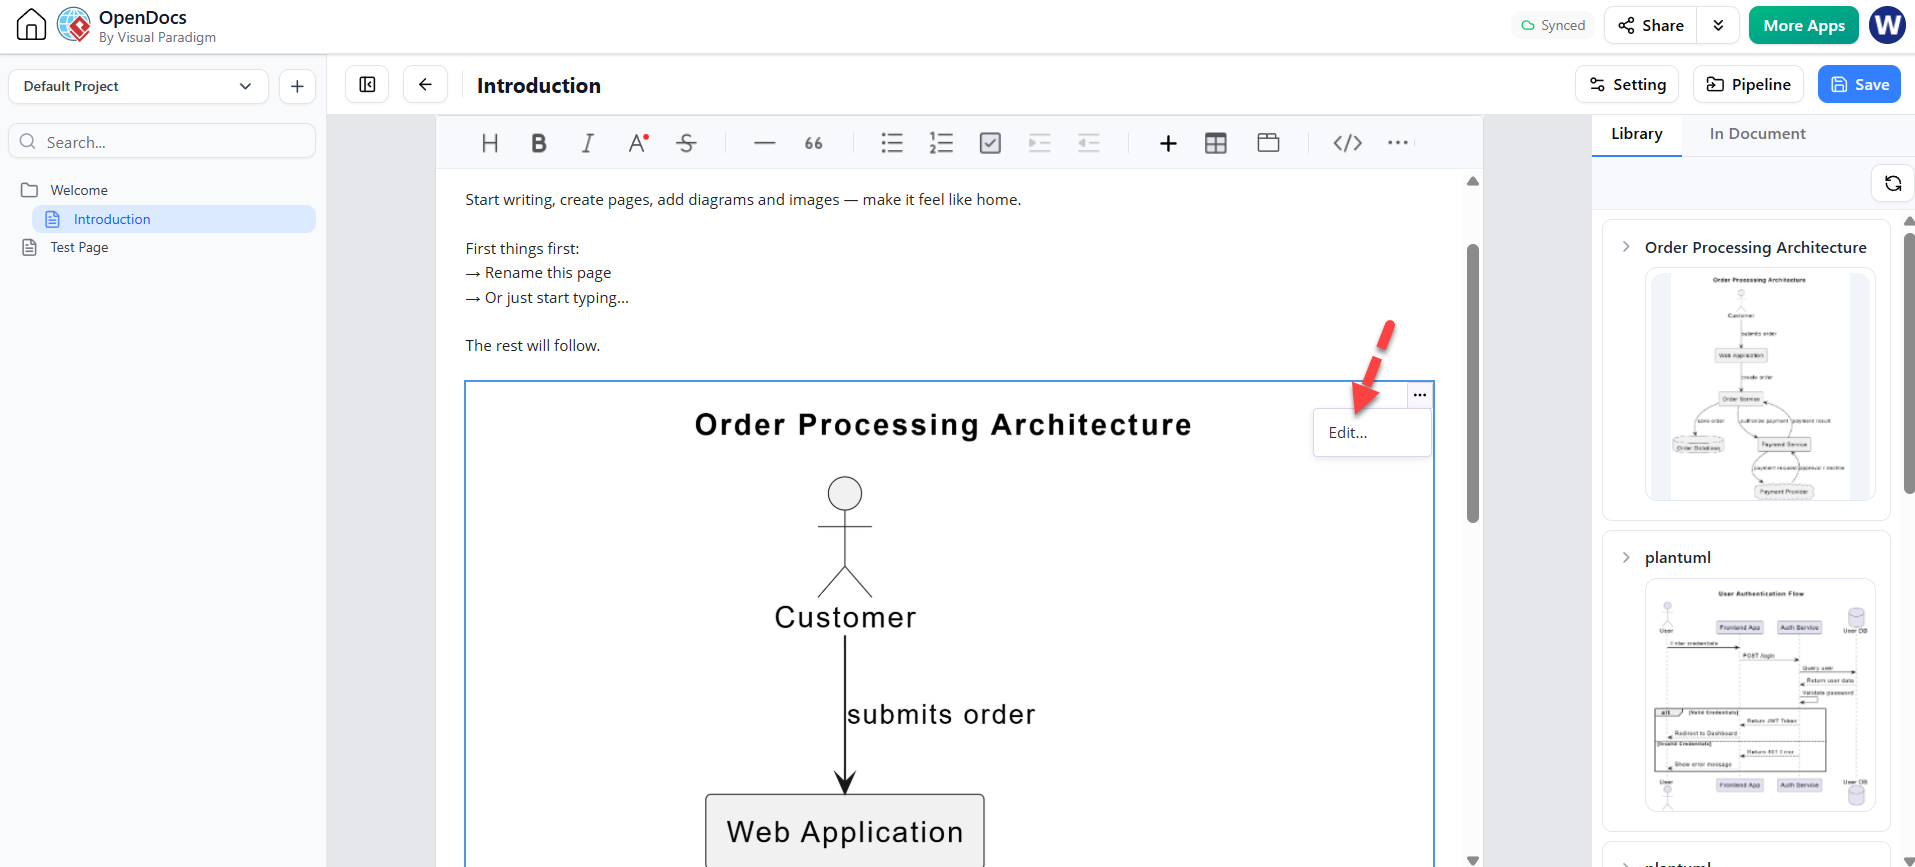
Click the … button associated with the inserted visual and click on Edit.
-
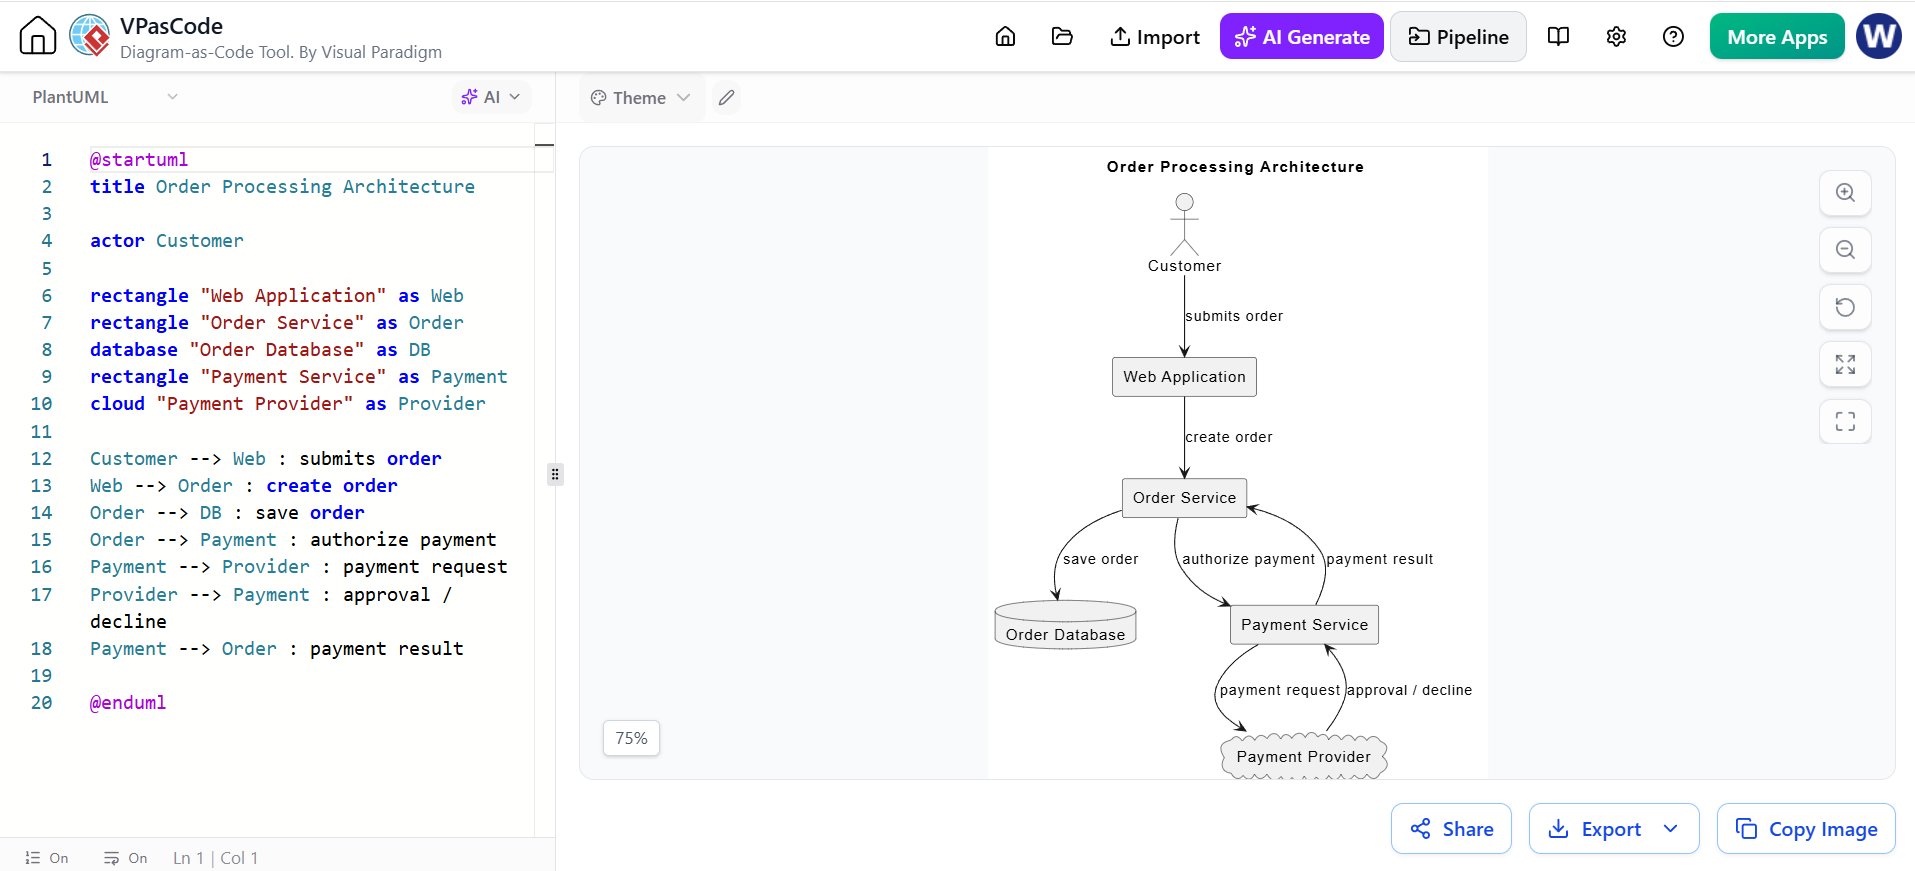
Reopen the diagram source in VPasCode.
-
Modify the PlantUML, Mermaid, or other source code. (or You can use AI Assisted Refinement)
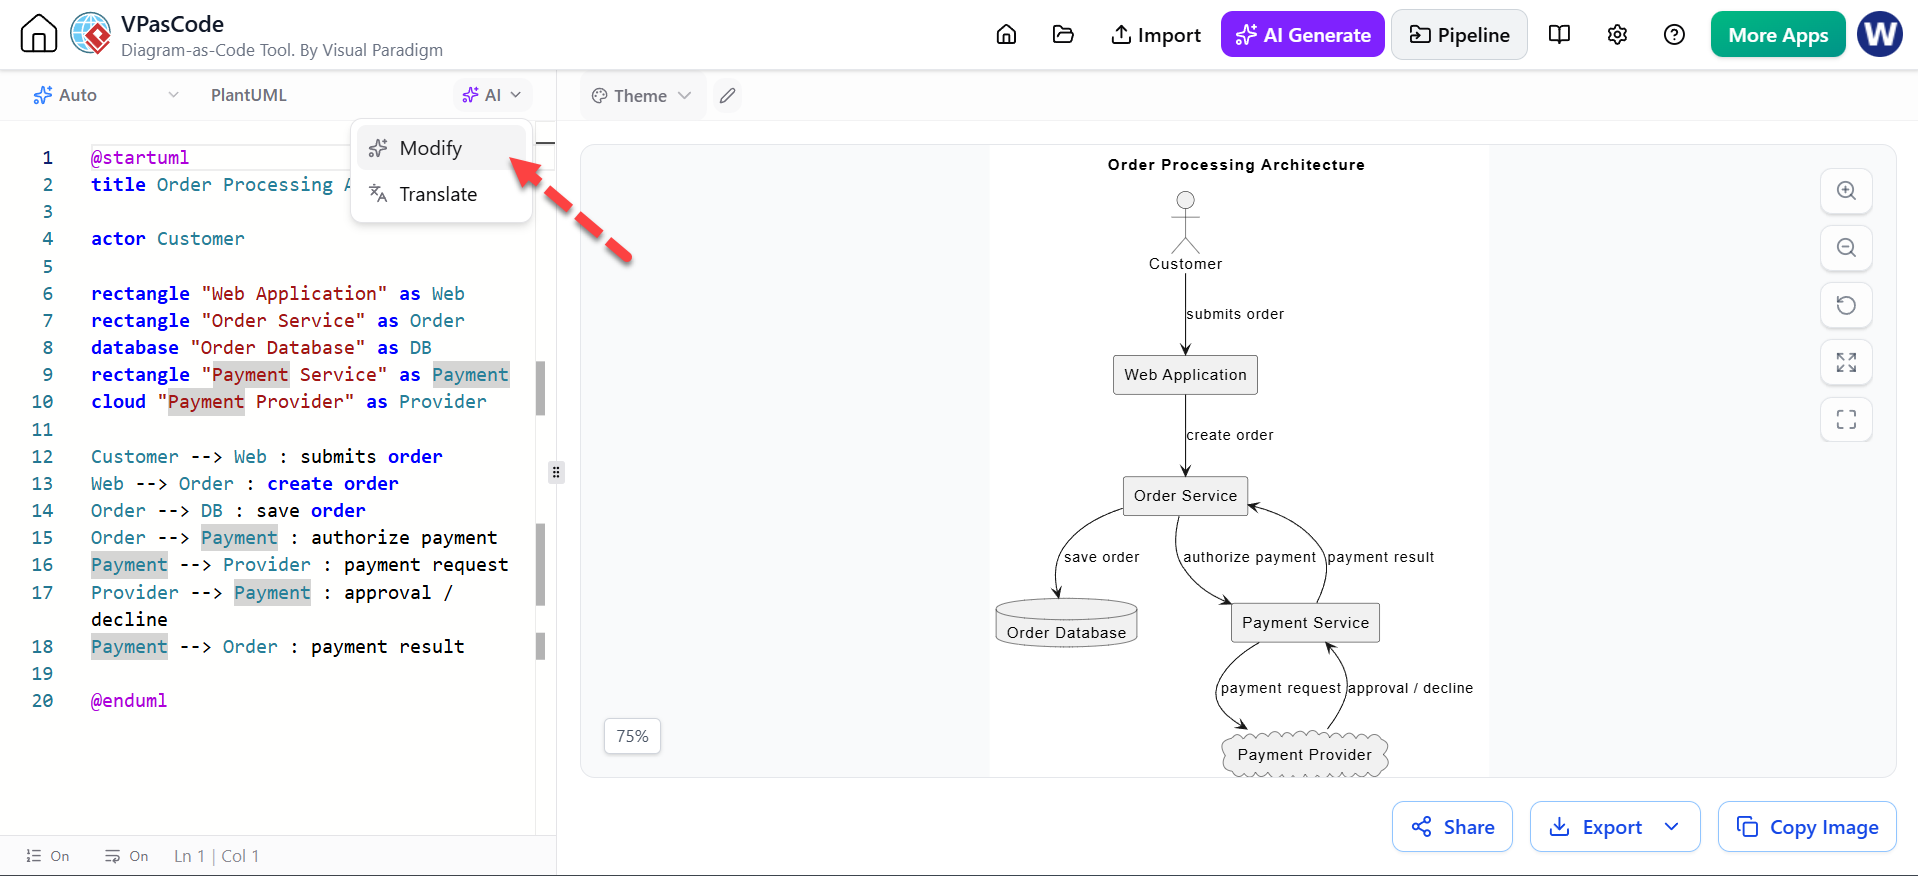
Enter the Prompt: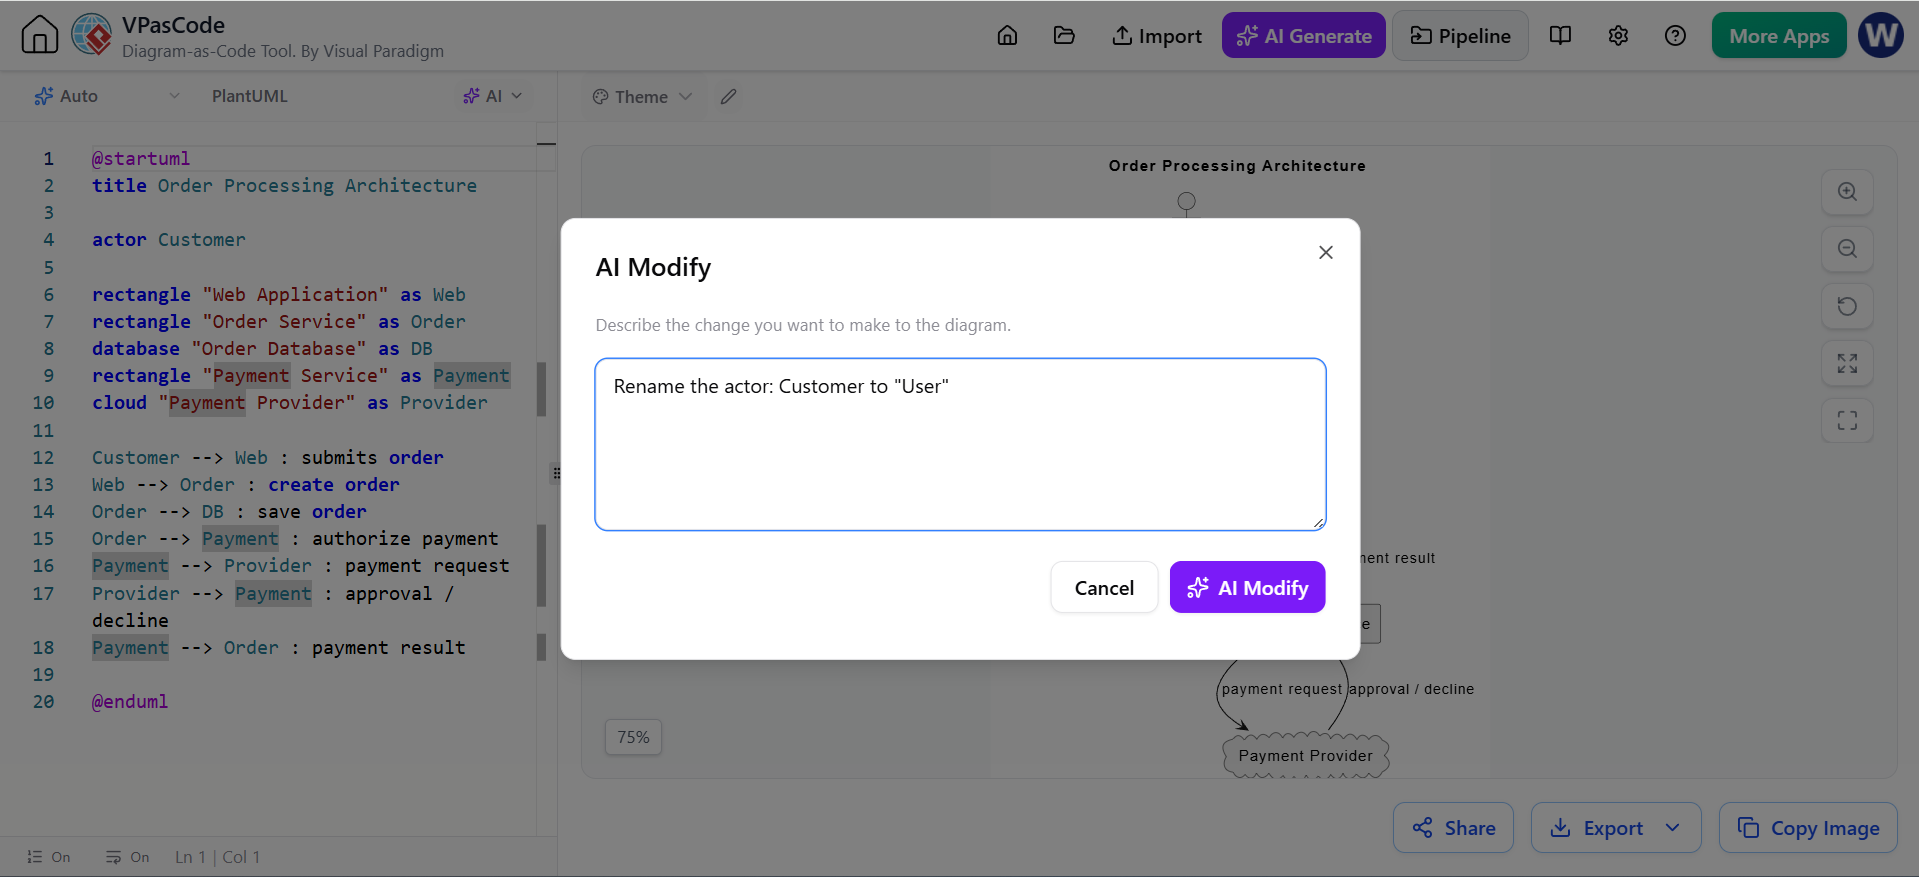
The Refinement Result:
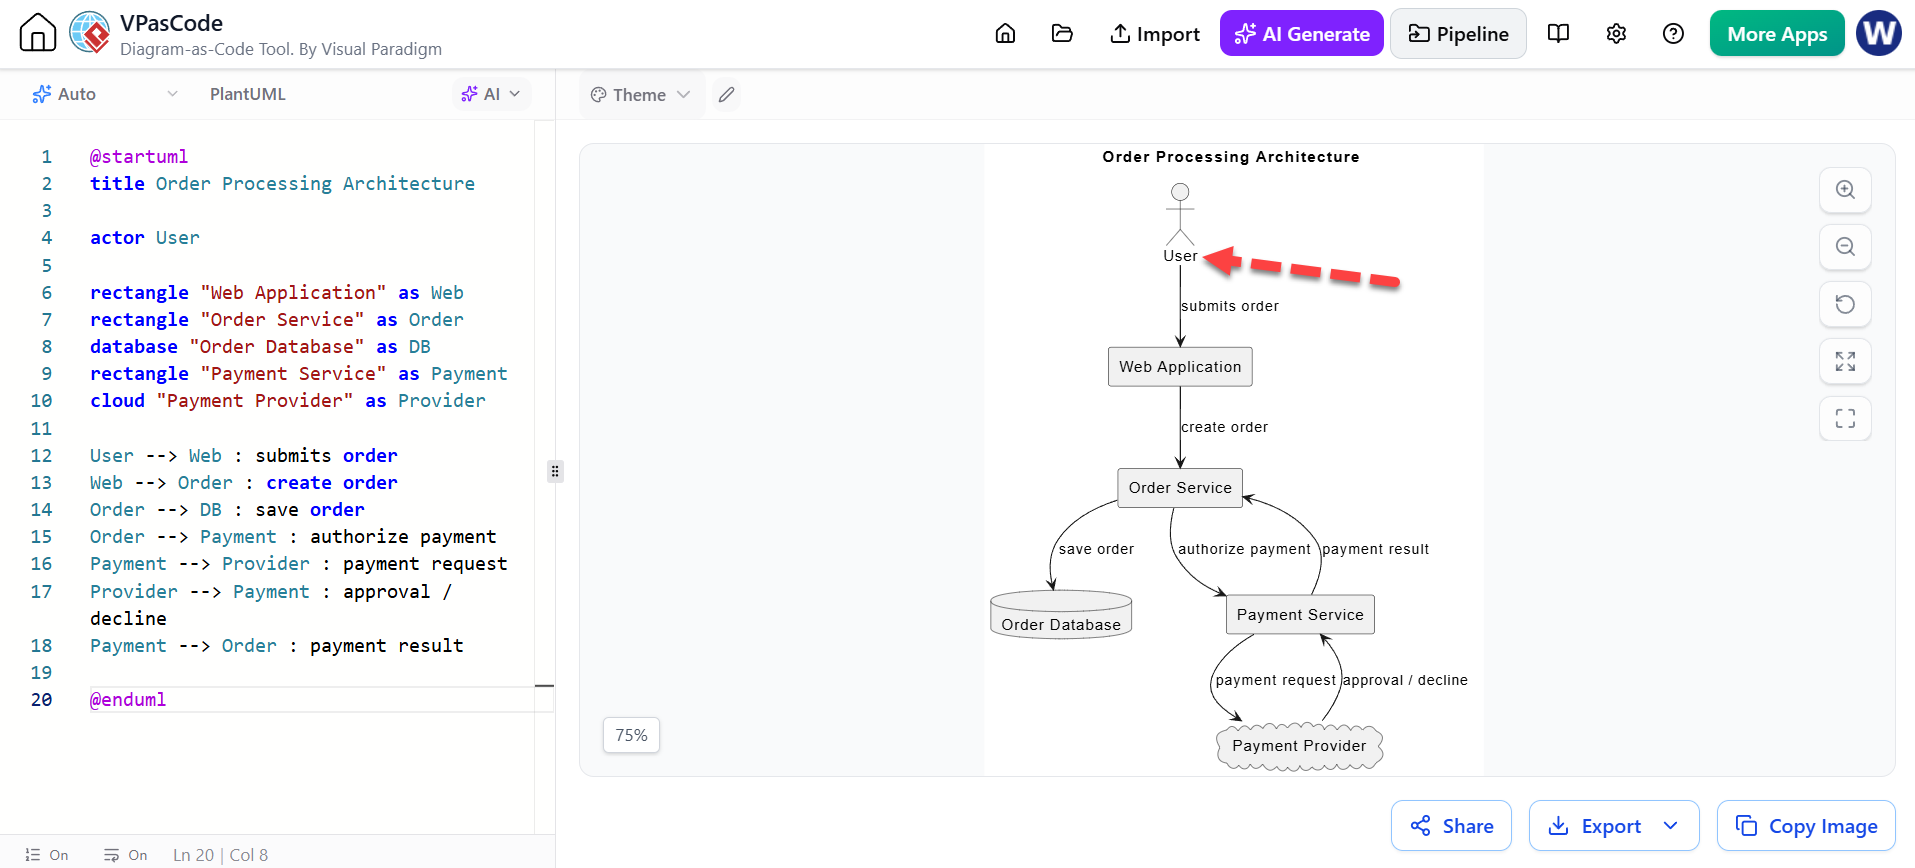
-
Confirm that the new preview is correct.
-
Send the revised diagram through the Pipeline again.
-
Return to OpenDocs.
-
Insert or select the latest revision.
-
Replace the old diagram.
This avoids rebuilding the visual manually or searching for the original image file. Visual Paradigm describes the Pencil action as a way to reopen the diagram source in VPasCode and update the documentation after resending it.
6. The complete lifecycle
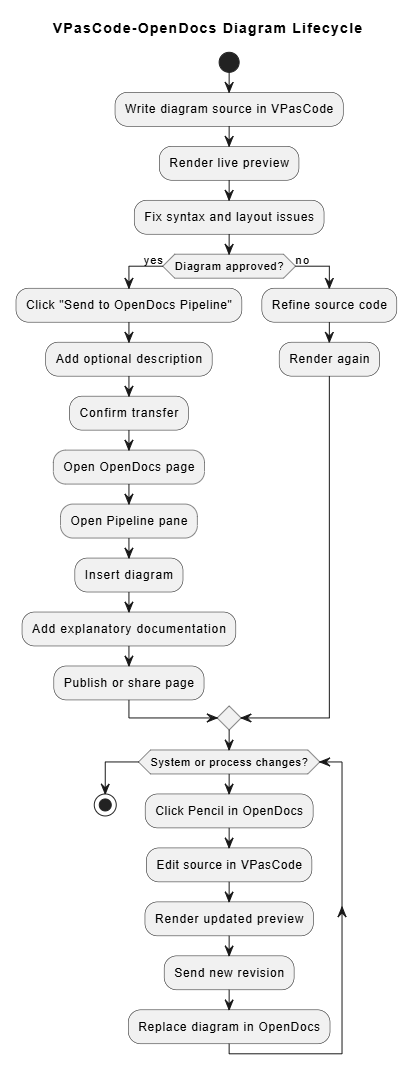
@startuml
title VPasCode–OpenDocs Diagram Lifecycle

start

:Write diagram source in VPasCode;
:Render live preview;
:Fix syntax and layout issues;

if (Diagram approved?) then (yes)
  :Click "Send to OpenDocs Pipeline";
  :Add optional description;
  :Confirm transfer;
  :Open OpenDocs page;
  :Open Pipeline pane;
  :Insert diagram;
  :Add explanatory documentation;
  :Publish or share page;
else (no)
  :Refine source code;
  :Render again;
endif

while (System or process changes?)
  :Click Pencil in OpenDocs;
  :Edit source in VPasCode;
  :Render updated preview;
  :Send new revision;
  :Replace diagram in OpenDocs;
endwhile

stop
@enduml
7. Why use this workflow?
7.1 It reduces manual publishing work
The traditional process often looks like this:
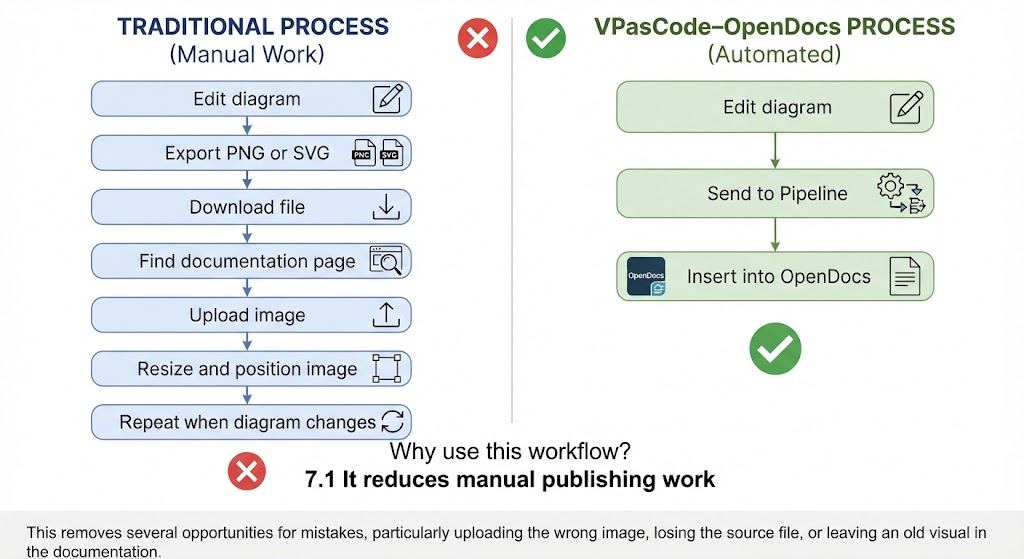
Edit diagram
  ↓
Export PNG or SVG
  ↓
Download file
  ↓
Find documentation page
  ↓
Upload image
  ↓
Resize and position image
  ↓
Repeat when diagram changes
The VPasCode–OpenDocs process is shorter:
Edit diagram
  ↓
Send to Pipeline
  ↓
Insert into OpenDocs
This removes several opportunities for mistakes, particularly uploading the wrong image, losing the source file, or leaving an old visual in the documentation.
7.2 It treats diagrams as maintainable source
A PlantUML or Mermaid diagram is text. Text can be:
-
Reviewed during code review.
-
Stored in Git.
-
Compared line by line.
-
Updated with search and replace.
-
Reused in multiple contexts.
-
Generated or refined with AI.
-
Maintained alongside application code.
For example, this change is easy to understand in a source-control diff:
 rectangle "Order Service" as Order
+rectangle "Fraud Detection Service" as Fraud
 database "Order Database" as DB

 Order --> DB : save order
+Order --> Fraud : evaluate risk
A binary image diff would not communicate the architectural change nearly as clearly.
7.3 It creates a living document
A static diagram becomes obsolete as soon as the system changes. The Pipeline provides a practical revision path between the source diagram and the published documentation.
The intended model is:
Source definition
      ↓
Rendered visual
      ↓
OpenDocs explanation
      ↓
Current published knowledge
This is particularly valuable for architecture pages, operating procedures, onboarding guides, and product documentation that change frequently.
7.4 It separates authoring from publishing
Different people can work at different levels:
-
An architect or developer can focus on diagram syntax.
-
A technical writer can improve the surrounding explanation.
-
A product manager can use the published page without learning PlantUML.
-
An operations team can consume the final system view in a shared knowledge base.
The diagram remains precise while the documentation remains readable to a wider audience.
7.5 It supports more than one diagram language
PlantUML is well suited to UML, C4, component, deployment, sequence, activity, and use-case diagrams. Mermaid is convenient for flowcharts, timelines, Gantt charts, user journeys, state diagrams, and lightweight documentation visuals. Graphviz is useful for dependency and relationship graphs. VPasCode brings these styles into one authoring environment.
8. Practical usage cases
Usage case 1: Microservices architecture
Situation: A team needs to document services, data stores, and external integrations.
Workflow:
-
Create a component or C4-style diagram in PlantUML.
-
Preview it in VPasCode.
-
Send it to OpenDocs.
-
Add service responsibilities and ownership information.
-
Publish the architecture page.
-
Update the diagram when services or dependencies change.
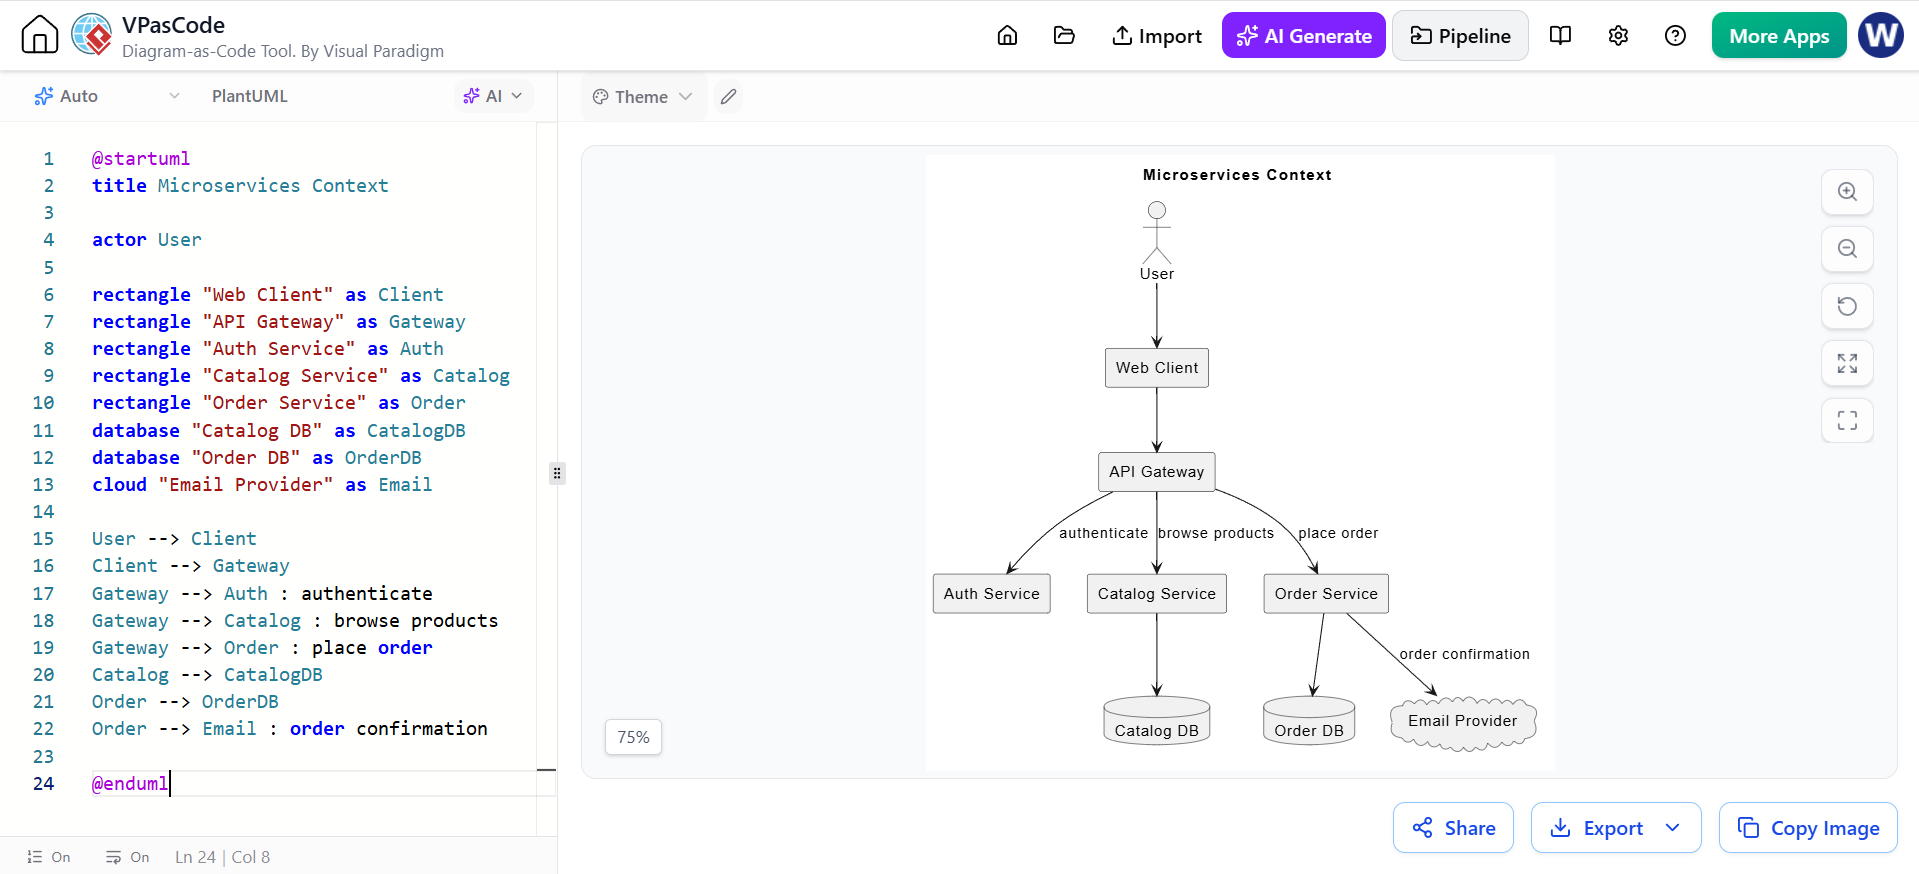
@startuml
title Microservices Context

actor User

rectangle "Web Client" as Client
rectangle "API Gateway" as Gateway
rectangle "Auth Service" as Auth
rectangle "Catalog Service" as Catalog
rectangle "Order Service" as Order
database "Catalog DB" as CatalogDB
database "Order DB" as OrderDB
cloud "Email Provider" as Email

User --> Client
Client --> Gateway
Gateway --> Auth : authenticate
Gateway --> Catalog : browse products
Gateway --> Order : place order
Catalog --> CatalogDB
Order --> OrderDB
Order --> Email : order confirmation

@enduml
OpenDocs content surrounding the diagram:
-
System purpose.
-
Service ownership.
-
Authentication model.
-
Data ownership.
-
Availability assumptions.
-
Known architectural risks.
-
Links to deployment and operational procedures.
Usage case 2: Authentication sequence
Situation: Support staff need to understand what happens during login.
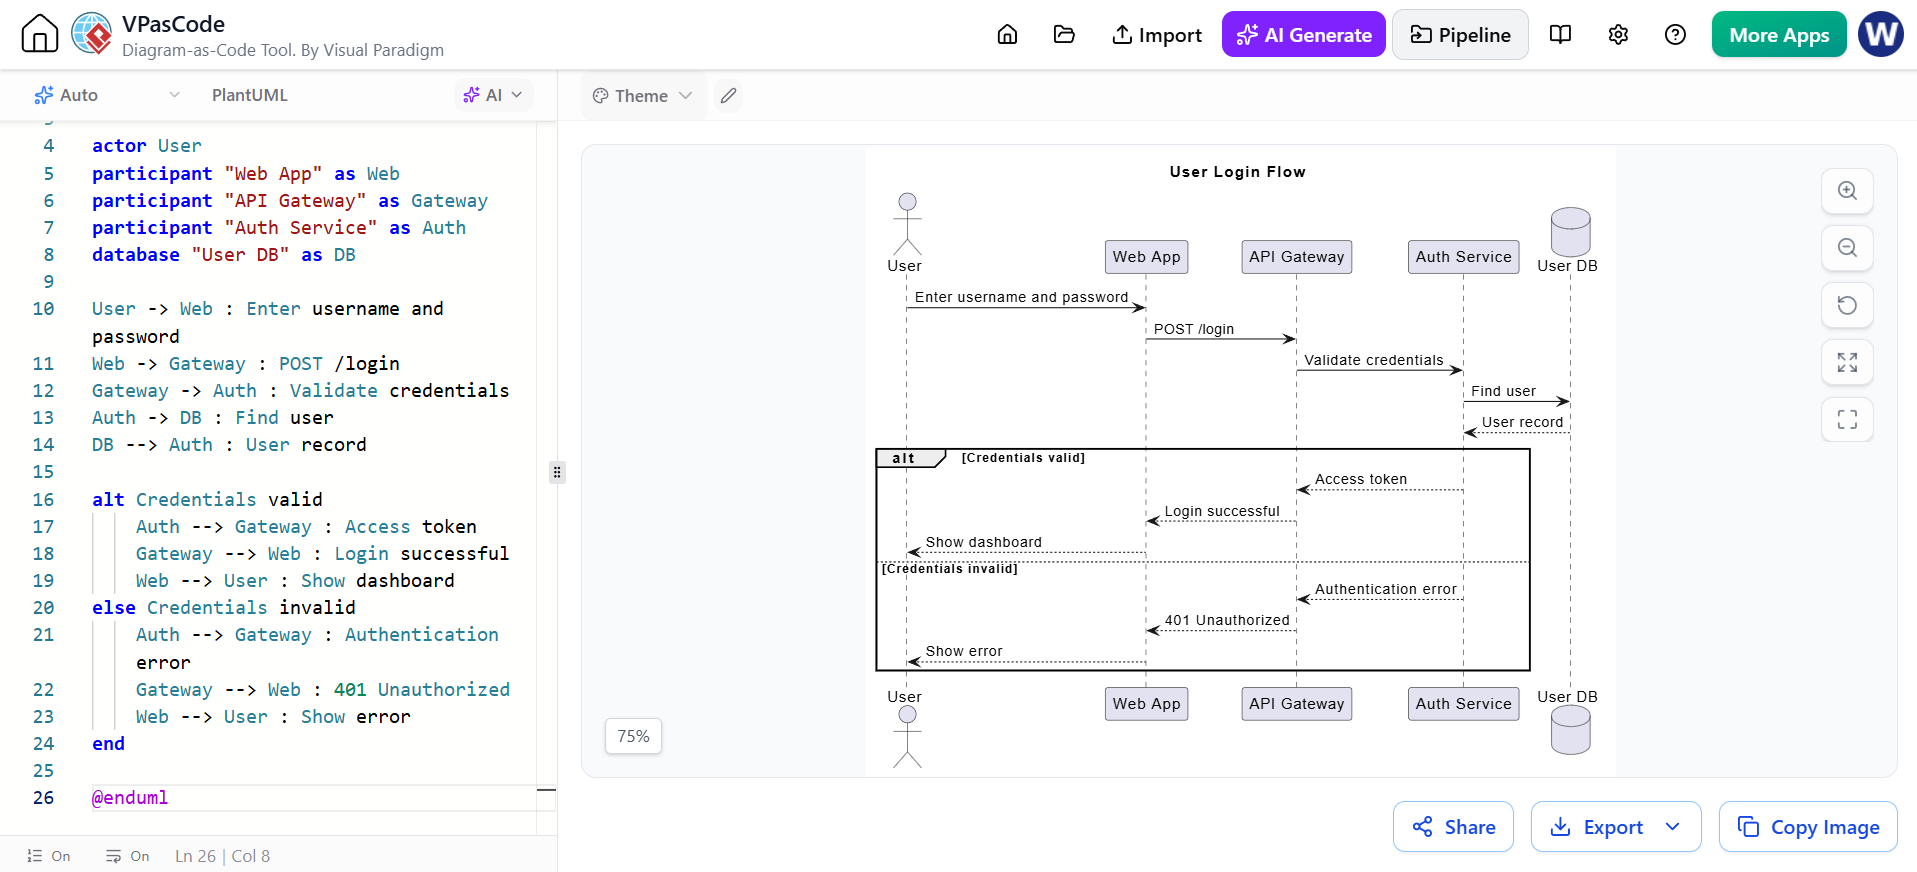
@startuml
title User Login Flow

actor User
participant "Web App" as Web
participant "API Gateway" as Gateway
participant "Auth Service" as Auth
database "User DB" as DB

User -> Web : Enter username and password
Web -> Gateway : POST /login
Gateway -> Auth : Validate credentials
Auth -> DB : Find user
DB --> Auth : User record

alt Credentials valid
    Auth --> Gateway : Access token
    Gateway --> Web : Login successful
    Web --> User : Show dashboard
else Credentials invalid
    Auth --> Gateway : Authentication error
    Gateway --> Web : 401 Unauthorized
    Web --> User : Show error
end

@enduml
In OpenDocs, accompany the diagram with:
-
Token expiration rules.
-
Retry limits.
-
Error-handling behavior.
-
Security responsibilities.
-
Troubleshooting steps.
Usage case 3: Agile roadmap or sprint workflow
Mermaid is often convenient for team-facing process visuals:
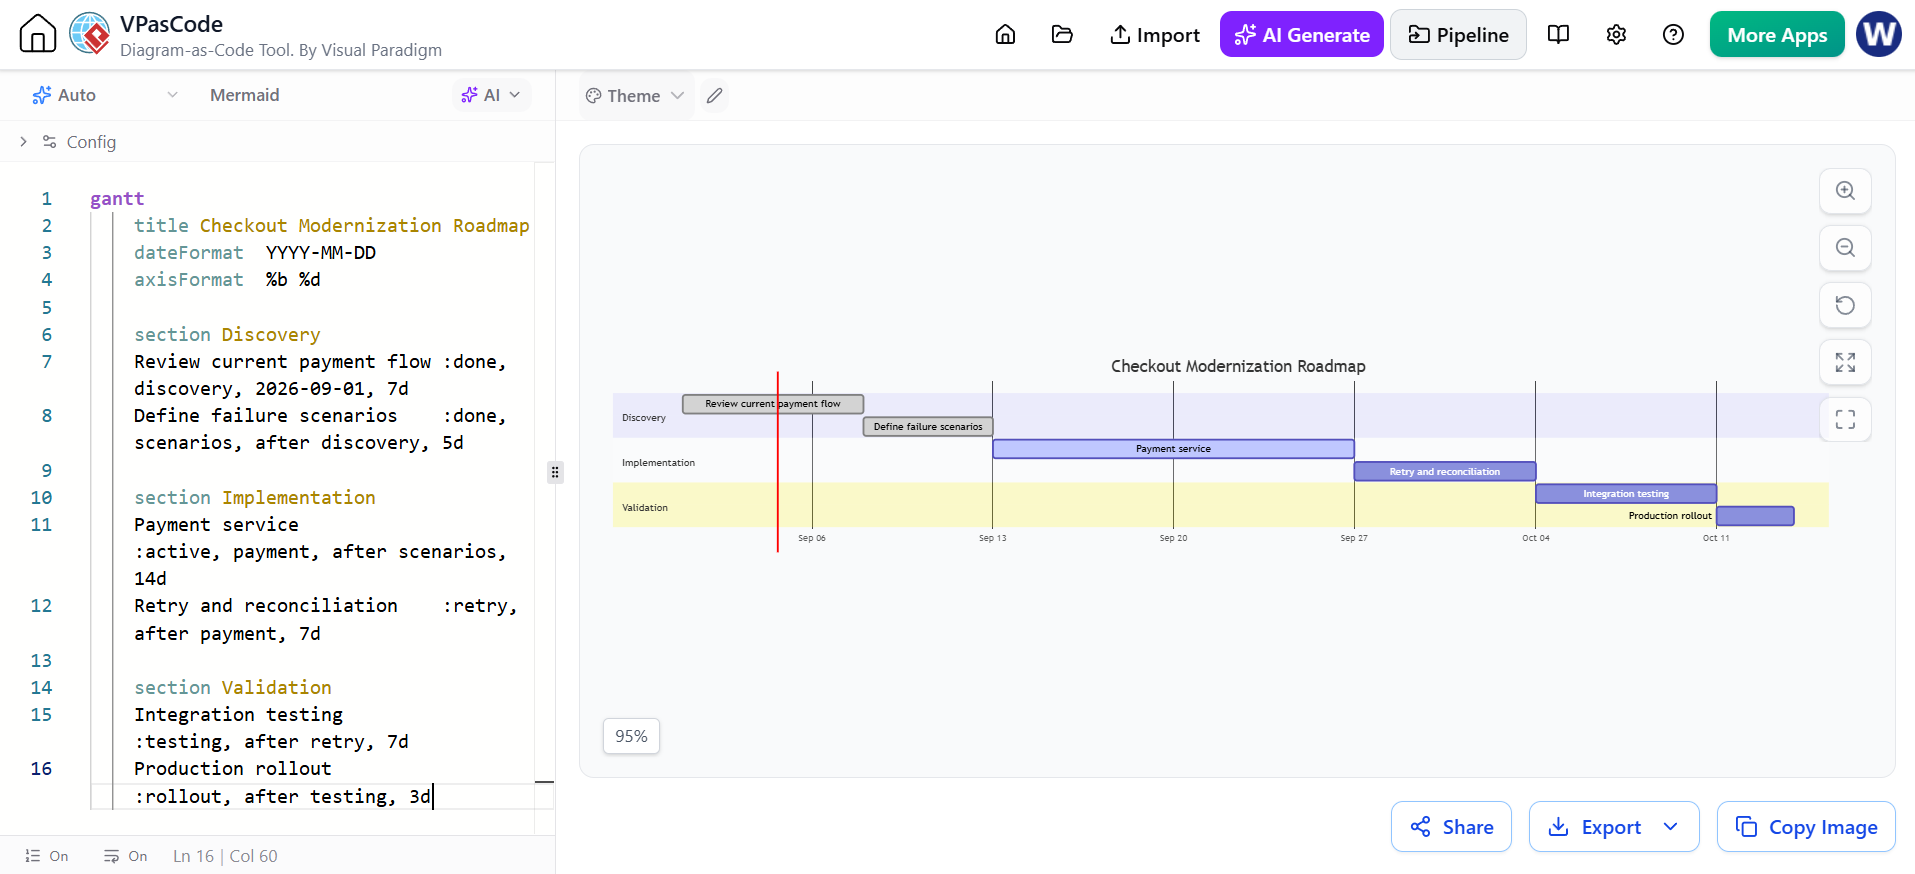
gantt
    title Checkout Modernization Roadmap
    dateFormat  YYYY-MM-DD
    axisFormat  %b %d

    section Discovery
    Review current payment flow :done, discovery, 2026-09-01, 7d
    Define failure scenarios    :done, scenarios, after discovery, 5d

    section Implementation
    Payment service             :active, payment, after scenarios, 14d
    Retry and reconciliation    :retry, after payment, 7d

    section Validation
    Integration testing         :testing, after retry, 7d
    Production rollout          :rollout, after testing, 3d
Send the roadmap to OpenDocs and insert it into:
-
A project handbook.
-
A sprint planning page.
-
A release-notes page.
-
A stakeholder update.
-
A risk and dependency register.
Usage case 4: Data model documentation
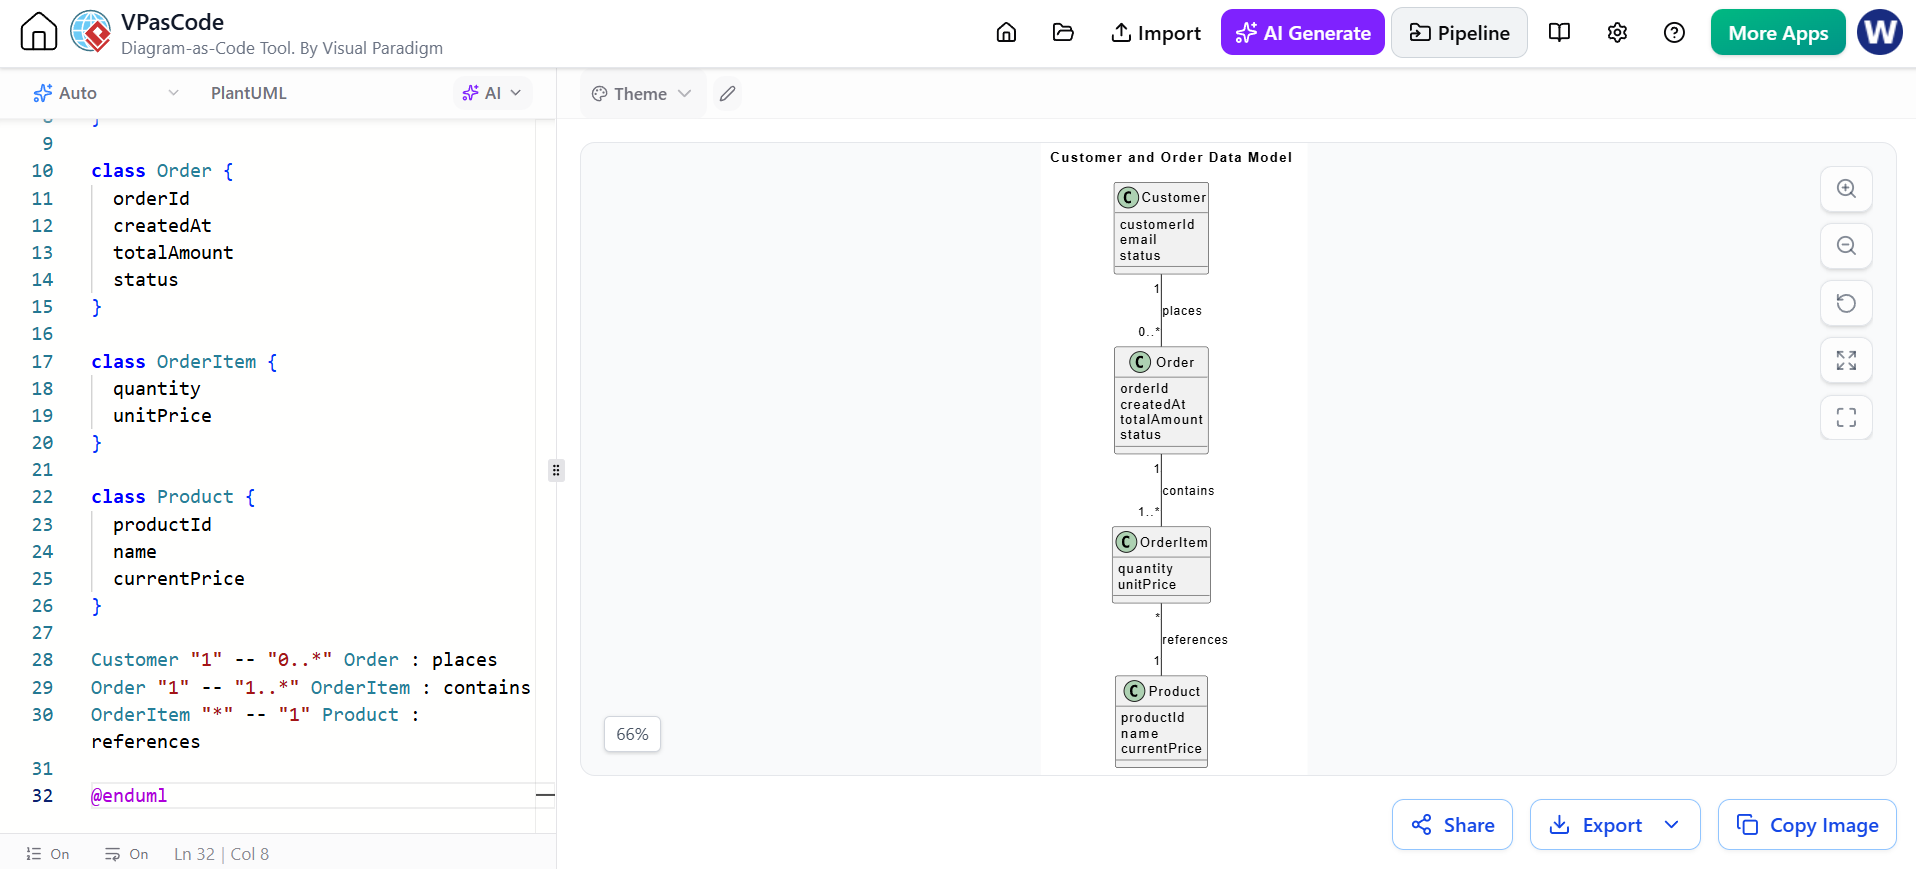
@startuml
title Customer and Order Data Model

class Customer {
  customerId
  email
  status
}

class Order {
  orderId
  createdAt
  totalAmount
  status
}

class OrderItem {
  quantity
  unitPrice
}

class Product {
  productId
  name
  currentPrice
}

Customer "1" -- "0..*" Order : places
Order "1" -- "1..*" OrderItem : contains
OrderItem "*" -- "1" Product : references

@enduml
In OpenDocs, document:
-
Which system owns each entity.
-
Whether relationships are enforced by foreign keys.
-
Data-retention rules.
-
PII classification.
-
Migration procedures.
-
API representations of the entities.
Usage case 5: Incident response
During an incident, create a focused dependency diagram rather than a complete enterprise architecture:
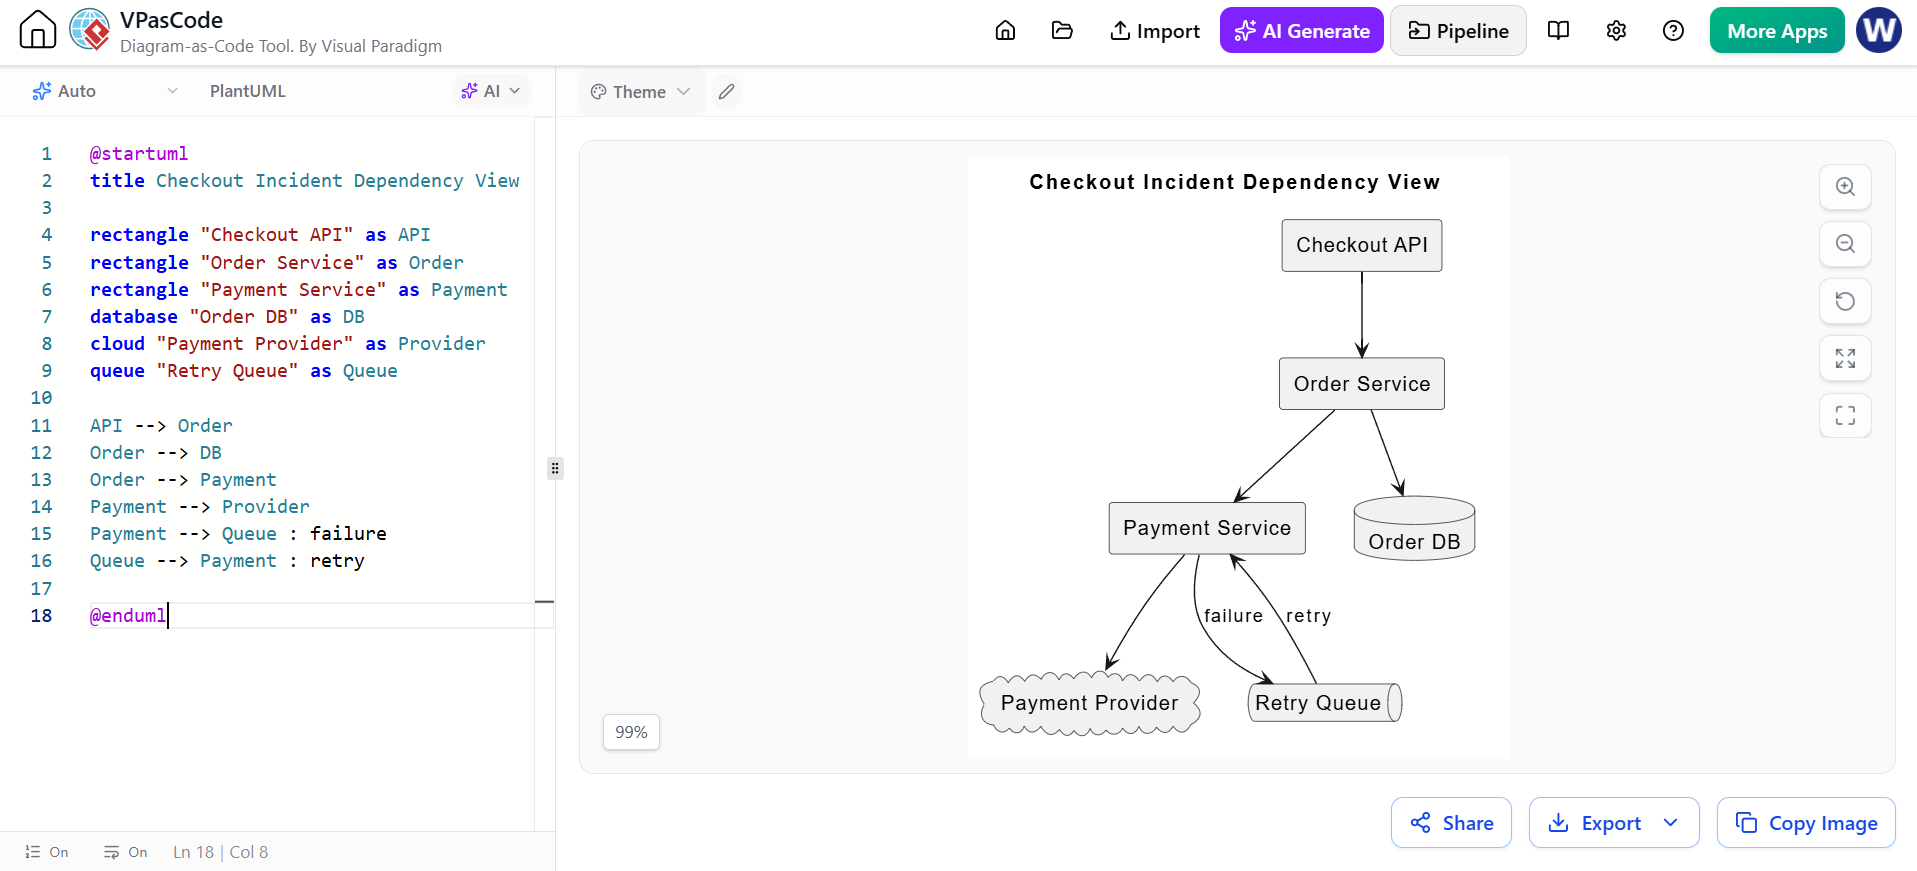
@startuml
title Checkout Incident Dependency View

rectangle "Checkout API" as API
rectangle "Order Service" as Order
rectangle "Payment Service" as Payment
database "Order DB" as DB
cloud "Payment Provider" as Provider
queue "Retry Queue" as Queue

API --> Order
Order --> DB
Order --> Payment
Payment --> Provider
Payment --> Queue : failure
Queue --> Payment : retry

@enduml
Insert it into the incident page with:
-
Incident impact.
-
Current failure point.
-
Detection time.
-
Mitigation.
-
Recovery steps.
-
Follow-up actions.
This is more useful than attaching a generic architecture diagram that contains irrelevant systems.
9. Example: architecture-as-code repository structure
A team can keep diagram source under version control and publish selected revisions to OpenDocs:
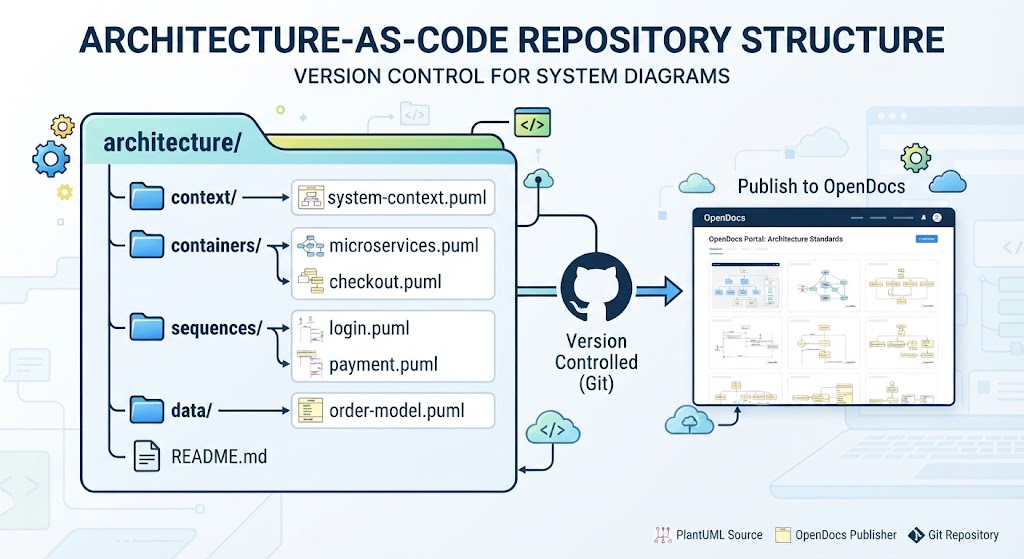
architecture/
├── context/
│   └── system-context.puml
├── containers/
│   ├── microservices.puml
│   └── checkout.puml
├── sequences/
│   ├── login.puml
│   └── payment.puml
├── data/
│   └── order-model.puml
└── README.md
A typical working loop is:
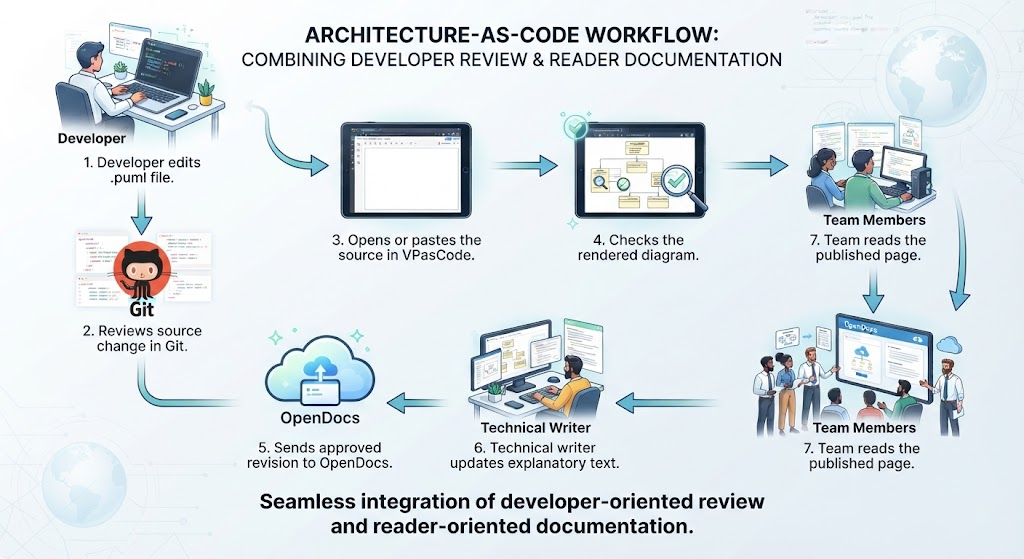
Developer edits .puml file
       ↓
Reviews source change in Git
       ↓
Opens or pastes the source in VPasCode
       ↓
Checks the rendered diagram
       ↓
Sends approved revision to OpenDocs
       ↓
Technical writer updates explanatory text
       ↓
Team reads the published page
This combines developer-oriented review with reader-oriented documentation.
10. Recommended OpenDocs page structure
A useful page should not consist only of an inserted image. Use a repeatable template:
# [System or Process Name]

## Purpose

What does this system or process do?

## Scope

What is included and excluded?

## Diagram

[Inserted VPasCode diagram]

## How to read the diagram

Explain the major boundaries, actors, and flows.

## Responsibilities

| Element | Responsibility | Owner |
|---|---|---|
| API Gateway | Routes external requests | Platform Team |
| Order Service | Creates and tracks orders | Commerce Team |
| Payment Service | Authorizes payments | Payments Team |

## Important decisions

- Why was this boundary chosen?
- Which component owns the data?
- What happens when a dependency fails?

## Operational notes

- Monitoring dashboards
- Alerts
- Recovery procedures
- Known limitations

## Revision history

- Version 2.4 — Added fraud-check integration
- Version 2.3 — Separated payment authorization
The diagram supplies visual orientation; the surrounding page supplies meaning and operational context.
11. PlantUML diagram examples for the workflow itself
High-level integration diagram
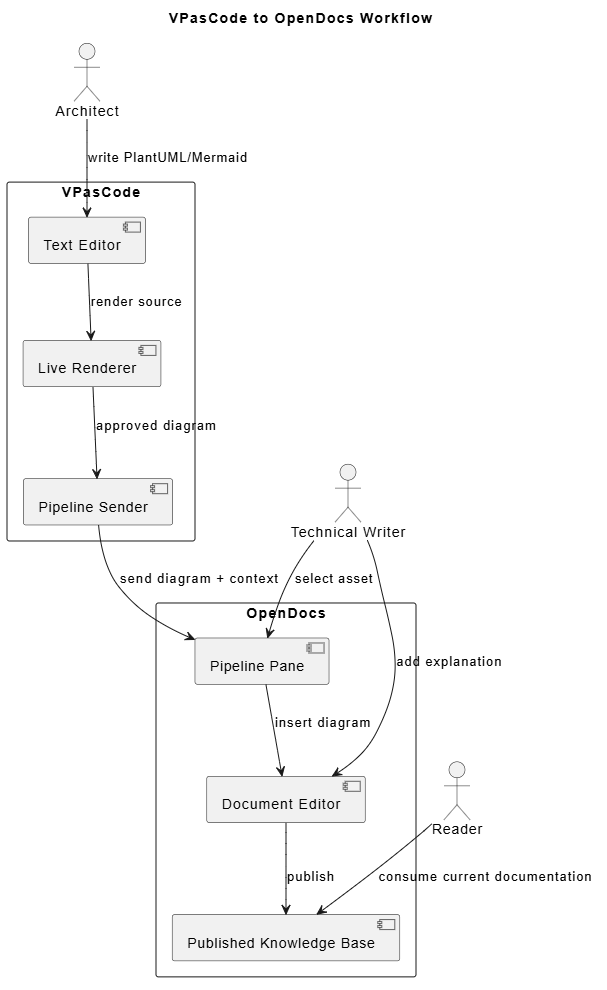
@startuml
title VPasCode to OpenDocs Workflow

actor Architect
actor "Technical Writer" as Writer
actor Reader

rectangle "VPasCode" as VPasCode {
  component "Text Editor" as Editor
  component "Live Renderer" as Renderer
  component "Pipeline Sender" as Sender
}

rectangle "OpenDocs" as OpenDocs {
  component "Pipeline Pane" as Pipeline
  component "Document Editor" as Docs
  component "Published Knowledge Base" as KB
}

Architect --> Editor : write PlantUML/Mermaid
Editor --> Renderer : render source
Renderer --> Sender : approved diagram
Sender --> Pipeline : send diagram + context
Writer --> Pipeline : select asset
Pipeline --> Docs : insert diagram
Writer --> Docs : add explanation
Docs --> KB : publish
Reader --> KB : consume current documentation

@enduml
Revision loop
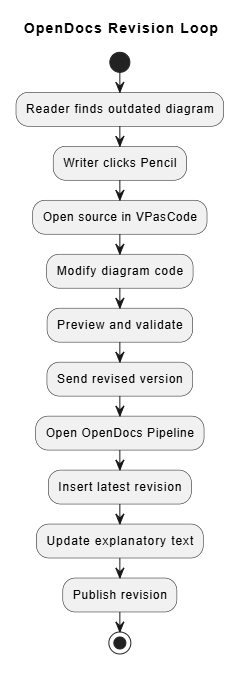
@startuml
title OpenDocs Revision Loop

start

:Reader finds outdated diagram;
:Writer clicks Pencil;
:Open source in VPasCode;
:Modify diagram code;
:Preview and validate;
:Send revised version;
:Open OpenDocs Pipeline;
:Insert latest revision;
:Update explanatory text;
:Publish revision;

stop
@enduml
Architecture decision workflow
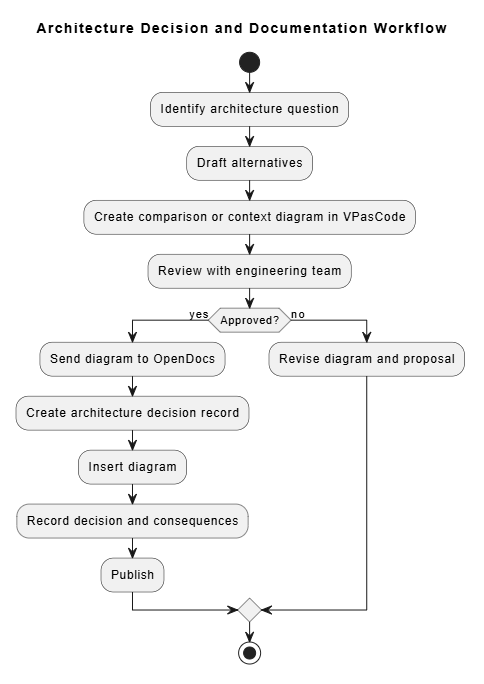
@startuml
title Architecture Decision and Documentation Workflow

start

:Identify architecture question;
:Draft alternatives;
:Create comparison or context diagram in VPasCode;
:Review with engineering team;
if (Approved?) then (yes)
  :Send diagram to OpenDocs;
  :Create architecture decision record;
  :Insert diagram;
  :Record decision and consequences;
  :Publish;
else (no)
  :Revise diagram and proposal;
endif

stop
@enduml
12. Benefits compared with a manual image workflow
| Concern | Manual export and upload | VPasCode–OpenDocs workflow |
|---|---|---|
| Diagram creation | Often disconnected from documentation | Created in a dedicated text-to-diagram editor |
| Updating | Export and upload a new image | Reopen source, revise, and resend |
| Source visibility | May be lost after export | Source remains associated with the workflow |
| Reviewability | Image changes are difficult to inspect | Text changes can be reviewed line by line |
| Publishing | Multiple file-handling steps | Send, select, and insert |
| Collaboration | People exchange image files | Authors work with source; readers consume documentation |
| Reuse | Copy images manually | Reuse a maintained diagram definition |
| Consistency | Different authors may use different styles | Shared syntax and themes can improve consistency |
| Audience support | Often optimized for either engineers or readers | Engineers edit source; broader teams read OpenDocs |
13. What makes the workflow stand out
Diagram-as-code plus knowledge management
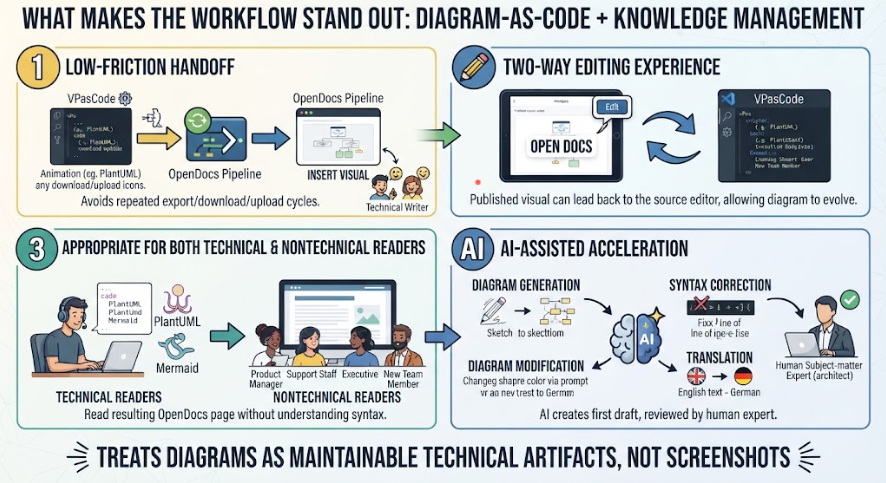
Many diagramming tools are good at drawing, and many documentation tools are good at prose. The distinctive part of this workflow is the connection between:
Structured diagram source
          +
Professional visual rendering
          +
Published explanatory documentation
The diagram is therefore treated as a maintainable technical artifact rather than a screenshot.
Low-friction handoff
The Pipeline avoids the repeated export/download/upload cycle. The official workflow consists of sending from VPasCode, optionally adding context, opening the OpenDocs Pipeline pane, and inserting the visual into a page.
Two-way editing experience
The Pencil action makes the workflow more than a one-time export. A published visual can lead back to the source editor, allowing the diagram to evolve instead of being replaced by an unrelated manually edited image.
Appropriate for both technical and nontechnical readers
Developers can use PlantUML or Mermaid source. Product managers, support staff, executives, and new team members can read the resulting OpenDocs page without understanding the syntax.
AI-assisted acceleration
Visual Paradigm describes AI capabilities for diagram generation, syntax correction, diagram modification, and translation. These features can help create a first draft, but the resulting diagram should still be reviewed by the responsible architect or subject-matter expert.
14. Best practices
Keep one diagram focused
Prefer:
-
“Payment authorization sequence”
-
“Checkout service dependencies”
-
“Customer data ownership”
Avoid combining all of these into one unreadable diagram.
Use descriptive titles
@startuml
title Payment Authorization Failure and Retry Flow
@enduml
Titles make diagrams easier to identify in the Pipeline and easier to understand when viewed outside their original page.
Add a purpose statement
Before the diagram, write one or two sentences explaining what the reader should learn from it.
Establish a source-of-truth policy
Decide whether the canonical source is:
-
A Git repository.
-
VPasCode.
-
An OpenDocs-managed revision.
-
A combination of Git for source and OpenDocs for published knowledge.
For engineering teams, a strong policy is:
Git = canonical diagram source
VPasCode = visual editing and validation
OpenDocs = published explanation and discoverability
Include change context when sending
Use the optional Pipeline description for meaningful metadata:
Release 3.1:
- Added Fraud Detection Service
- Payment authorization now occurs asynchronously
- Updated retry path
Review layout for the audience
A diagram can be technically correct and still be difficult to read. Check:
-
Font size.
-
Direction of flow.
-
Amount of crossing lines.
-
Boundary clarity.
-
Consistent terminology.
-
Whether abbreviations are explained.
Separate conceptual and implementation diagrams
Use a conceptual diagram for business and product audiences. Use a detailed deployment or component diagram for engineers and operations staff. Do not force both audiences to consume the same level of detail.
Treat AI output as a draft
AI can produce valid-looking syntax while misunderstanding system behavior. Validate:
-
Component responsibilities.
-
Data ownership.
-
Security boundaries.
-
Failure paths.
-
Protocols.
-
Deployment assumptions.
15. Common problems and solutions
The “Send to OpenDocs Pipeline” button is missing
Check:
-
Whether you are signed in to the correct Visual Paradigm account.
-
Whether your edition includes the integration.
-
Whether the diagram has rendered successfully.
-
Whether the browser has blocked a pop-up or authentication request.
-
Whether the workspace is correctly configured.
The diagram appears in the Pipeline but not on the page
Open the correct OpenDocs workspace and page, then open the Pipeline pane. The asset normally must be explicitly inserted; sending it to the Pipeline does not necessarily place it automatically in every document.
The diagram is too large or unreadable
Simplify the diagram rather than merely shrinking it:
-
Split it into multiple views.
-
Reduce label length.
-
Hide implementation details.
-
Use separate context, container, component, and sequence diagrams.
The diagram becomes outdated
Use the Pencil button from the inserted diagram, update the source in VPasCode, resend it, and replace the older revision.
The diagram source contains an error
Use VPasCode’s live validation and preview to isolate the problem. VPasCode also advertises AI-based syntax-error fixing in editions that include the relevant AI capability.
16. A recommended adoption plan
Phase 1: Start with one diagram
Choose a diagram that changes often, such as:
-
Checkout flow.
-
Login sequence.
-
Service dependency map.
-
Sprint roadmap.
Phase 2: Create a documentation template
Standardize:
-
Diagram title.
-
Purpose.
-
Scope.
-
Owners.
-
Operational notes.
-
Revision history.
Phase 3: Put source under version control
Store .puml, Mermaid, or Graphviz files alongside the relevant software or architecture repository.
Phase 4: Establish review rules
Require reviewers to check both:
-
The source code and rendered visual.
-
The explanatory OpenDocs text.
Phase 5: Expand the pattern
After the workflow is stable, apply it to:
-
API documentation.
-
Data models.
-
Security flows.
-
Deployment architecture.
-
Incident response.
-
Product roadmaps.
-
Onboarding material.
Conclusion
The point of pairing VPasCode with OpenDocs is to create a short, repeatable path from diagram source to understandable, maintainable documentation:
Author in text
  → preview visually
  → send through Pipeline
  → insert into OpenDocs
  → explain and publish
  → reopen and revise when reality changes
Its strongest benefits are reduced publishing friction, source-level maintainability, clearer review, easier collaboration, and documentation that can evolve with the system. It stands out because it does not merely export a picture: it connects diagram-as-code authoring with a knowledge base and preserves a practical route for future revisions.
