Beginner’s Guide to Enterprise Integration Patterns (EIP) Diagrams

Beginner’s Guide to Enterprise Integration Patterns (EIP) Diagrams

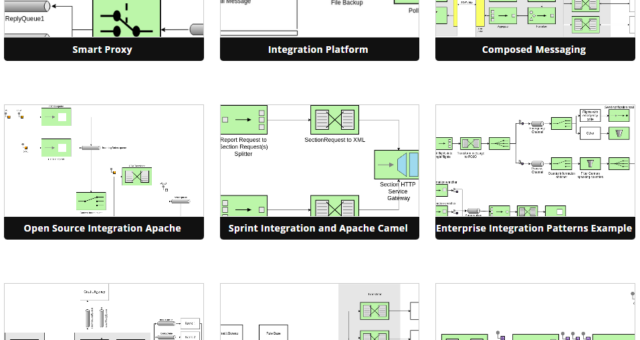
Introduction Enterprise Integration Patterns (EIP) provide a set of guidelines and best practices for integrating different software systems and applications within an enterprise. These patterns help organizations create efficient, reliable, and maintainable integration solutions. To help you understand and apply EIP effectively, this beginner's guide will introduce you to EIP diagrams and how you can learn by using a large collection of templates available in Visual Paradigm Online. Understanding Enterprise Integration Patterns (EIP) EIP was introduced in the book written by Gregor Hohpe and Bobby Woolf, which outlines 65 patterns for enterprise application…continue reading →
Beginner’s Guide to Robustness Diagrams with Visual Paradigm Online

Beginner’s Guide to Robustness Diagrams with Visual Paradigm Online

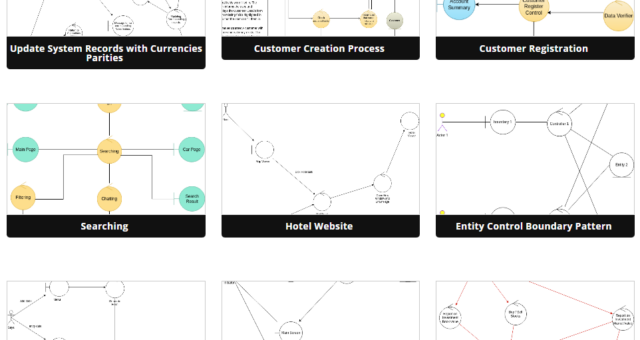
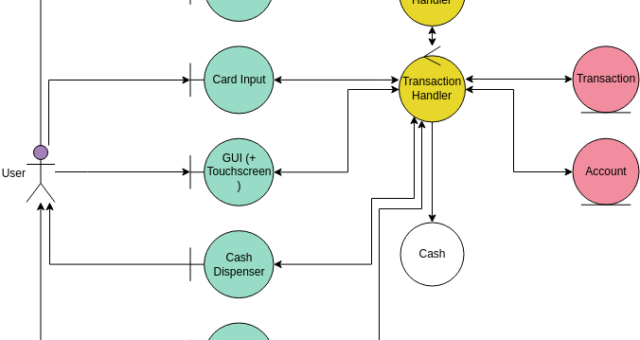
Introduction Robustness diagrams are a valuable tool in software engineering for modeling the interactions between different parts of a software system. They help you understand how different components or objects in a system collaborate to achieve specific functionality. In this beginner's guide, we will introduce you to robustness diagrams and show you how to create them using Visual Paradigm Online, a powerful online diagramming tool. What is a Robustness Diagram? A robustness diagram is a dynamic model used to illustrate the interaction between external actors (e.g., users, other systems, or devices) and the…continue reading →
Beginner’s Guide to Entity-Relationship (ER) Diagrams

Beginner’s Guide to Entity-Relationship (ER) Diagrams

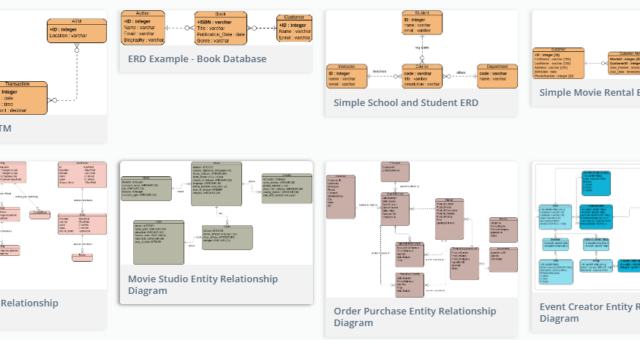
Introduction An Entity-Relationship (ER) diagram is a powerful tool used in database design to visualize and model the relationships between entities in a database system. ER diagrams help you understand the structure of a database and how different entities relate to each other. This beginner's guide will introduce you to the basics of ER diagrams and show you how to learn by examples using the large collection of templates available in Visual Paradigm Online, a popular diagramming tool. 1. What is an ER Diagram? An ER diagram is a visual representation of a…continue reading →
Beginner’s Guide to State Machine Diagrams

Beginner’s Guide to State Machine Diagrams

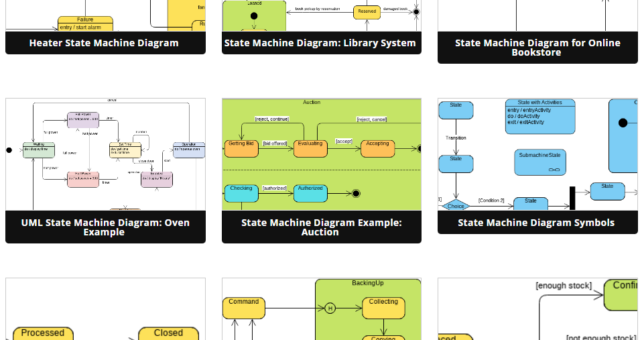
Introduction State Machine Diagrams are an essential tool in software engineering and system modeling. They help you visualize how objects or systems transition between various states in response to events. State Machine Diagrams are widely used in fields like software development, control systems, and business process modeling. In this beginner's guide, we'll introduce you to the basics of State Machine Diagrams and show you how to create them using Visual Paradigm Online, a powerful diagramming tool with a large collection of templates. What is a State Machine Diagram? A State Machine Diagram is…continue reading →
Beginner’s Guide to Component Diagrams in UML

Beginner’s Guide to Component Diagrams in UML

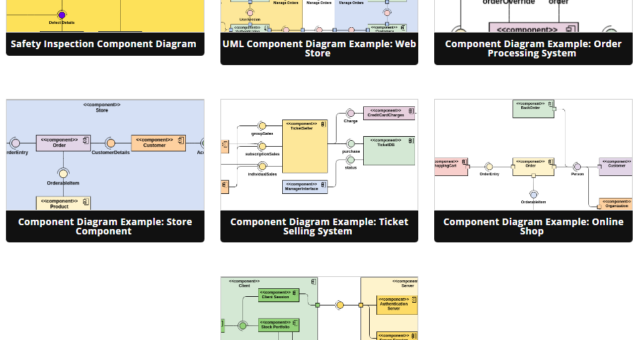
Introduction Unified Modeling Language (UML) is a visual language used in software engineering to model and design software systems. Component diagrams are one of the UML diagrams used to represent the high-level structure of a software system in terms of its components and their relationships. In this beginner's guide, we will introduce you to component diagrams in UML and show you how to create them using Visual Paradigm Online, a popular online UML modeling tool with a large collection of templates. What is a Component Diagram? A component diagram in UML provides a…continue reading →
Beginner’s Guide to Class Diagrams

Beginner’s Guide to Class Diagrams

Introduction Class diagrams are an essential part of object-oriented modeling and are widely used in software development to visualize and design the structure of a system. In this beginner's guide, we will introduce you to class diagrams, explain their key components, and show you how to create them using Visual Paradigm Online, a versatile modeling tool with a large collection of templates. What is a Class Diagram? A class diagram is a type of UML (Unified Modeling Language) diagram that represents the static structure of a system. It provides a visual representation of…continue reading →
Beginner’s Guide to Use Case Diagrams with Visual Paradigm Online

Beginner’s Guide to Use Case Diagrams with Visual Paradigm Online

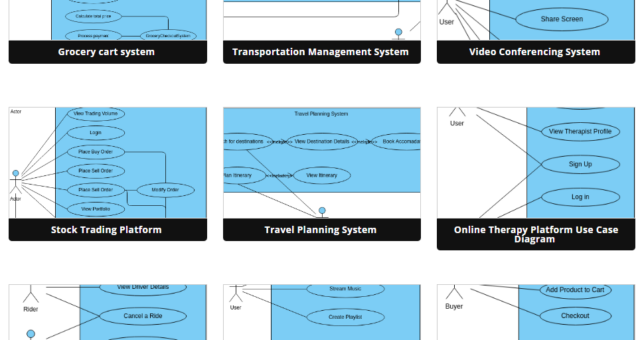
Introduction Use case diagrams are a fundamental tool in the field of software engineering and systems analysis. They help visualize the interactions between users or external systems and a software system. Use case diagrams are widely used to capture, define, and communicate the functional requirements of a system. In this beginner's guide, we will introduce you to use case diagrams and show you how to create them using Visual Paradigm Online, a powerful diagramming tool.   What is a Use Case Diagram? A use case diagram is a graphical representation of the interactions…continue reading →
Comprehensive Tutorial on Robustness Diagrams

Comprehensive Tutorial on Robustness Diagrams

Introduction Robustness analysis is a crucial step in software design, bridging the gap between the understanding of what a system needs to accomplish (analysis) and how it will be implemented (design). It helps designers make assumptions about the system's design and think about possible technical solutions. One valuable tool in robustness analysis is the Robustness Diagram, introduced by Rosenberg and Stephen in 2007. While not part of the official UML specification, robustness diagrams leverage UML concepts to represent the behavior of a system. In this tutorial, we will delve into the principles, elements,…continue reading →
Exploring Visual Paradigm Online Diagramming Tool: A Comprehensive Guide to System Modeling Diagrams

Exploring Visual Paradigm Online Diagramming Tool: A Comprehensive Guide to System Modeling Diagrams

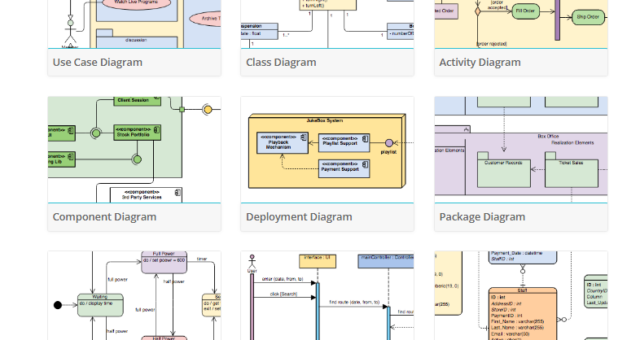
Introduction Visual Paradigm Online is a cloud-based diagramming tool that offers a comprehensive set of features for visual modeling and development of software and hardware systems. It provides an intuitive interface and an extensive collection of pre-built templates and shapes that make it easy to create professional-quality diagrams for various purposes. With Visual Paradigm Online, users can create a wide range of diagrams dedicated to software and hardware modeling and development, including UML diagrams, data flow diagrams, deployment diagrams, activity diagrams, and more. These diagrams enable users to visualize and understand the structure,…continue reading →
BPMN Essentials: A Comprehensive Guide to Business Process Modeling and Notation

BPMN Essentials: A Comprehensive Guide to Business Process Modeling and Notation

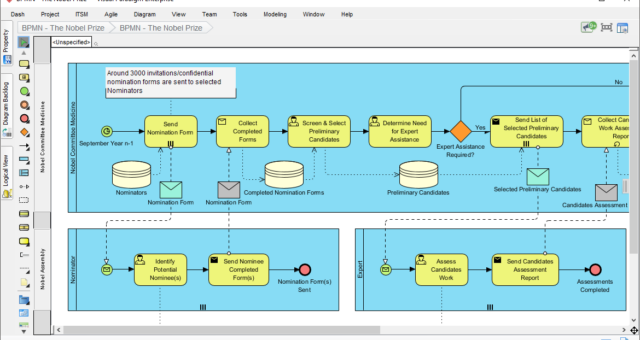
What is BPMN? BPMN stands for Business Process Model and Notation. It is a graphical representation of business processes that can be used to describe, analyze, and improve business processes. BPMN was developed by the Object Management Group (OMG) as a standard notation for modeling business processes. BPMN is a standard notation that uses graphical symbols and diagrams to represent business processes. These symbols and diagrams can be used to model different types of processes, such as business processes, system processes, and organizational processes.   BPMN was developed by the Business Process Management…continue reading →