




VPasCode Deep Dive: Unifying Mermaid, PlantUML, and AI in One Platform
In the world of technical documentation, “Diagram as Code” has moved from a niche developer practice to an industry-standard approach. But for teams juggling multiple diagram types—flowcharts, sequence diagrams, C4 models, and infrastructure maps—the challenge has been tool fragmentation. Visual Paradigm’s VPasCode addresses this head-on by unifying three major text-to-diagram engines in a single, browser-based platform, enhanced with AI capabilities and seamless integration with documentation workflows .
This guide explores VPasCode’s core features, demonstrates realistic examples across its supported syntaxes, and shows how it connects to the broader OpenDocs ecosystem for living documentation.
What Makes VPasCode Different?
VPasCode stands out as a unified Diagram-as-Code platform that supports Mermaid.js, PlantUML, and Graphviz in one interface . Rather than switching between tools depending on the diagram type, teams can standardize on a single editor that automatically detects and renders each syntax .
Key Capabilities at a Glance
| Feature | Description |
|---|---|
| Multi-Engine Support | Full syntax support for Mermaid, PlantUML, and Graphviz in one editor |
| Real-Time Preview | Immediate high-fidelity rendering as you type |
| AI Code Error Fixing | Instantly detects and corrects syntax mistakes |
| AI Diagram Translation | Converts text labels into multiple languages for global teams |
| Zero Setup Required | Browser-based, no installation needed |
| Git-Native | Diagram source files can be version-controlled alongside code |
| OpenDocs Pipeline Integration | One-click send to documentation with version tracking |
Supported Engines: What Can You Build?
VPasCode supports three major open-source text-to-diagram engines :
Mermaid.js Support
Mermaid is ideal for modern, Markdown-inspired diagrams. VPasCode supports:
-
Flowcharts and Mind Maps
-
Sequence and Class Diagrams
-
Entity Relationship Diagrams (ERD)
-
C4 Models
-
Gantt Charts, Timelines, and Kanban Boards
-
User Journeys and Git Graphs
PlantUML Support
PlantUML excels at robust software blueprints:
-
UML Class, Sequence, and Use Case Diagrams
-
C4 Models and ArchiMate
-
Activity and State Diagrams
-
Component and Deployment Diagrams
-
ERD (including Chen notation)
-
Network Layouts and WBS
Graphviz Support
Graphviz handles complex network topologies and dependency structures using the DOT language:
-
Directed and Standard Graphs
-
Organization Charts
-
Cluster Diagrams
-
Data Flow Diagrams
Realistic Examples: Mermaid in Action
Here are practical Mermaid examples that reflect real-world documentation needs, all compatible with VPasCode.
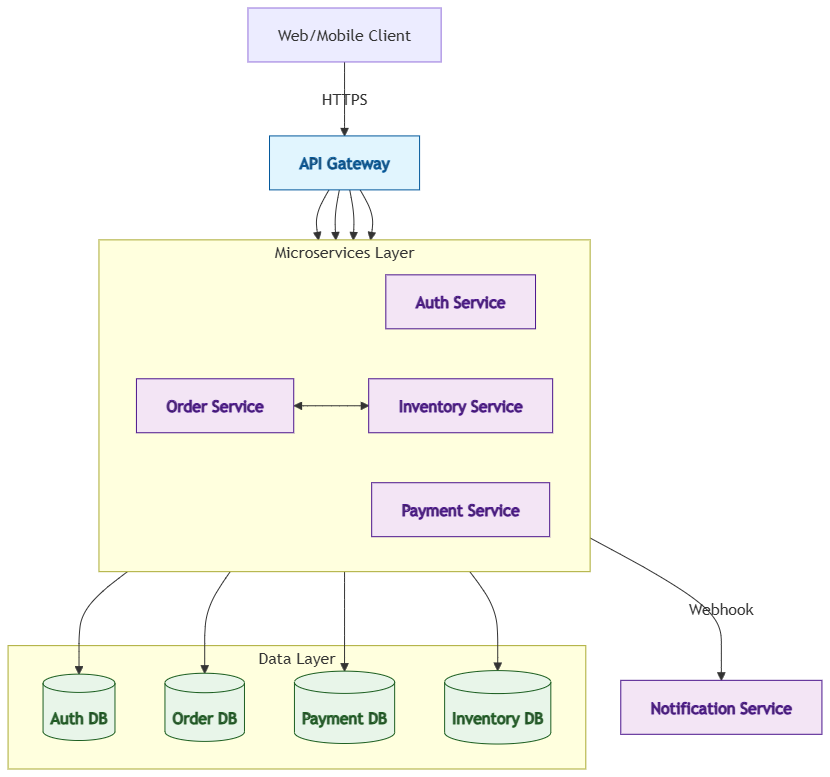
1. Microservice Architecture Flowchart
This diagram shows a typical cloud-native request flow through API Gateway, service mesh, and database layers:
flowchart TB
    Client[Web/Mobile Client] -->|HTTPS| Gateway[API Gateway]

    subgraph Services[Microservices Layer]
        direction LR
        Auth[Auth Service]
        Order[Order Service]
        Payment[Payment Service]
        Inventory[Inventory Service]
    end

    subgraph Data[Data Layer]
        AuthDB[(Auth DB)]
        OrderDB[(Order DB)]
        PaymentDB[(Payment DB)]
        InventoryDB[(Inventory DB)]
    end

    Gateway --> Auth
    Gateway --> Order
    Gateway --> Payment
    Gateway --> Inventory

    Auth --> AuthDB
    Order --> OrderDB
    Payment --> PaymentDB
    Inventory --> InventoryDB

    Order <--> Inventory
    Payment -->|Webhook| Notification[Notification Service]

    classDef gateway fill:#e1f5fe,stroke:#01579b
    classDef service fill:#f3e5f5,stroke:#4a148c
    classDef db fill:#e8f5e9,stroke:#1b5e20

    class Gateway gateway
    class Auth,Order,Payment,Inventory,Notification service
    class AuthDB,OrderDB,PaymentDB,InventoryDB db
Use Case: Architecture documentation for new team members or system design reviews.
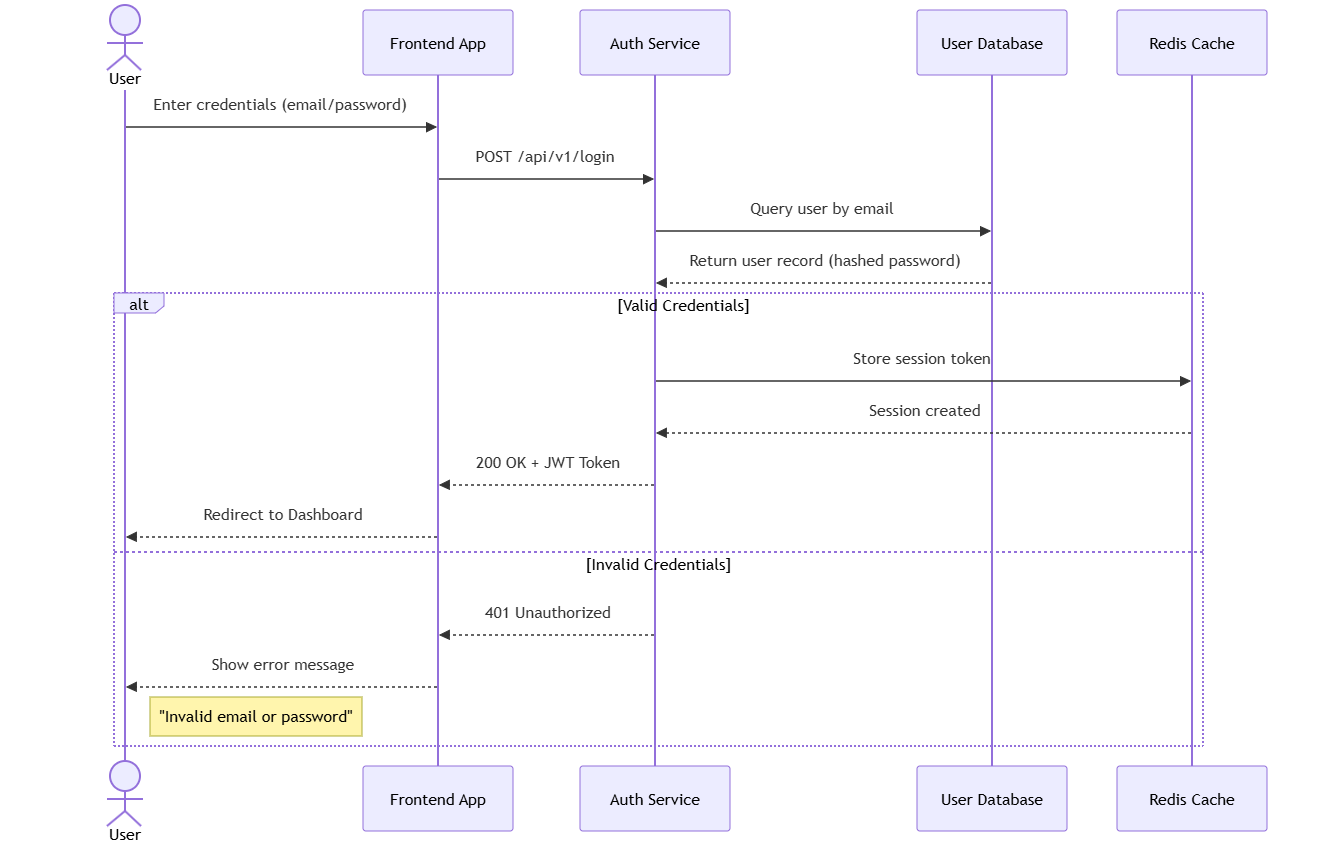
2. User Authentication Sequence Diagram
This sequence diagram captures the login flow with token issuance and error handling:
sequenceDiagram
    actor User
    participant Frontend as Frontend App
    participant Auth as Auth Service
    participant DB as User Database
    participant Cache as Redis Cache

    User->>Frontend: Enter credentials (email/password)
    Frontend->>Auth: POST /api/v1/login

    Auth->>DB: Query user by email
    DB-->>Auth: Return user record (hashed password)

    alt Valid Credentials
        Auth->>Cache: Store session token
        Cache-->>Auth: Session created
        Auth-->>Frontend: 200 OK + JWT Token
        Frontend-->>User: Redirect to Dashboard
    else Invalid Credentials
        Auth-->>Frontend: 401 Unauthorized
        Frontend-->>User: Show error message
        Note right of User: "Invalid email or password"
    end
Use Case: API documentation, security review, or onboarding for backend engineers.
3. CI/CD Pipeline Flowchart
This example models a deployment pipeline with conditional stages:

flowchart LR
    subgraph CI[Continuous Integration]
        Lint[Lint & Test] --> Build[Build Artifact]
        Build --> Scan[Security Scan]
    end

    subgraph CD[Continuous Deployment]
        DeployStaging[Deploy to Staging] -->|Automated| RunTests[Integration Tests]
        RunTests -->|Pass| Approval[Manual Approval]
        Approval -->|Approve| DeployProd[Deploy to Production]
        RunTests -->|Fail| Rollback[Rollback to Previous]
    end

    Scan -->|Pass| DeployStaging
    Scan -->|Fail| Alert[Alert Team]

    classDef ci fill:#e3f2fd,stroke:#1565c0
    classDef cd fill:#fff3e0,stroke:#e65100
    classDef decision fill:#ffebee,stroke:#c62828

    class Lint,Build,Scan ci
    class DeployStaging,RunTests,DeployProd,Rollback cd
    class Approval,Alert decision
Use Case: DevOps documentation, runbooks, and release process guides.
The AI Chatbot Integration: From Prompt to Diagram
One of VPasCode’s most powerful features is its integration with Visual Paradigm’s AI Chatbot . This creates a two-stage workflow that eliminates the “blank page” problem.
Stage 1: Ideation with AI
You can describe a system in natural language, and the AI generates an initial diagram structure . For example:
Prompt: “Create a use case diagram for a food delivery app with customers, delivery drivers, and restaurant owners.”
The AI interprets your intent and produces the underlying PlantUML or Mermaid code, complete with actors, use cases, and relationships .
Stage 2: Refinement in VPasCode
The critical link is the “Open in VPasCode” button . This exports the AI-generated logic into the code editor, where you can:
-
Adjust styling (
skinparam linetype ortho,left to right direction) -
Manually define relationships and stereotypes
-
Add specific elements the AI might have missed
-
Apply company branding and consistent formatting
This hybrid approach solves what Visual Paradigm calls the “Last Mile Problem” of AI generation—the AI gives you a 90% complete draft, and VPasCode lets you perfect the final 10% .
AI Error Fixing: Eliminating Syntax Frustration
One of the primary barriers to adopting Diagram as Code is syntax debugging. A single misplaced character can prevent a diagram from rendering . VPasCode’s AI Code Error Fixing feature addresses this with a seamless workflow:
-
Immediate Detection: When a syntax error occurs (e.g., an invalid connection operator), VPasCode displays a “Failed to Generate Diagram” alert with the specific line number .
-
One-Click Fix: An interface button labeled “Fix by AI” appears in the error notification .
-
AI Processing: A modal window confirms the AI is analyzing the error, comparing it against valid syntax patterns .
-
Automatic Correction: The problematic code is replaced with the correct syntax, and the diagram renders instantly .
This reduces cognitive load and allows users of all skill levels to work with diagram-as-code without memorizing every syntax rule .
Example: Before and After AI Fix
Broken Mermaid Syntax (Line 11):
flowchart LR
    A[Start] -->|Process| B[Task]
    B ---> C[End]
(Invalid operator --->)
After AI Fix:
flowchart LR
    A[Start] -->|Process| B[Task]
    B --> C[End]
The OpenDocs Pipeline: From Code to Living Documentation
VPasCode’s integration with OpenDocs creates what Visual Paradigm calls a “living documentation” workflow . Rather than exporting static images, diagrams are pushed through a pipeline that maintains version history and bidirectional synchronization.
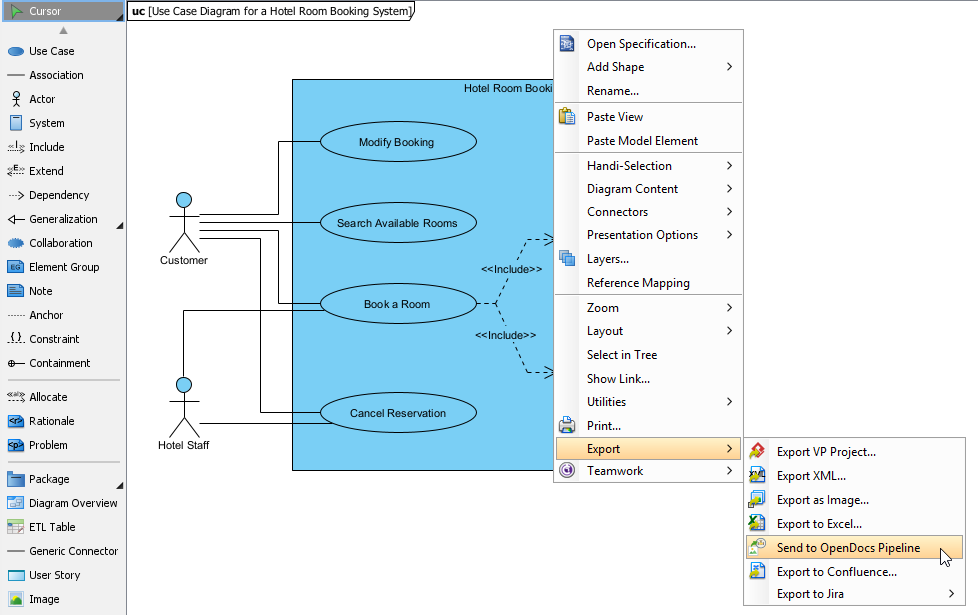
The Five-Stage Workflow
-
Draft in VPasCode: Engineers write or edit diagram syntax in the browser-based editor .
-
Send to Pipeline: Click “Send to OpenDocs Pipeline” with optional context notes (e.g., “Updated for TLS 1.3 compliance”) .
-
Insert in OpenDocs: Technical writers access the Pipeline pane and insert the diagram into live documentation with one click .
-
Edit In-Place: Clicking a pencil icon on an embedded diagram opens the original source in VPasCode for refinement .
-
Auto-Sync Updates: Changes propagate instantly without re-uploading files, eliminating version errors .
Measurable Impact
A case study of NovaStream, a SaaS provider, showed significant improvements after implementing this pipeline :
| Metric | Before Pipeline | After Pipeline | Improvement |
|---|---|---|---|
| Update Cycle Time | 55 min | 8 min | 85% improvement |
| Version Errors | Frequent | Zero | 100% elimination |
| Cross-Team Handoffs | 3 | 0 | 100% reduction |
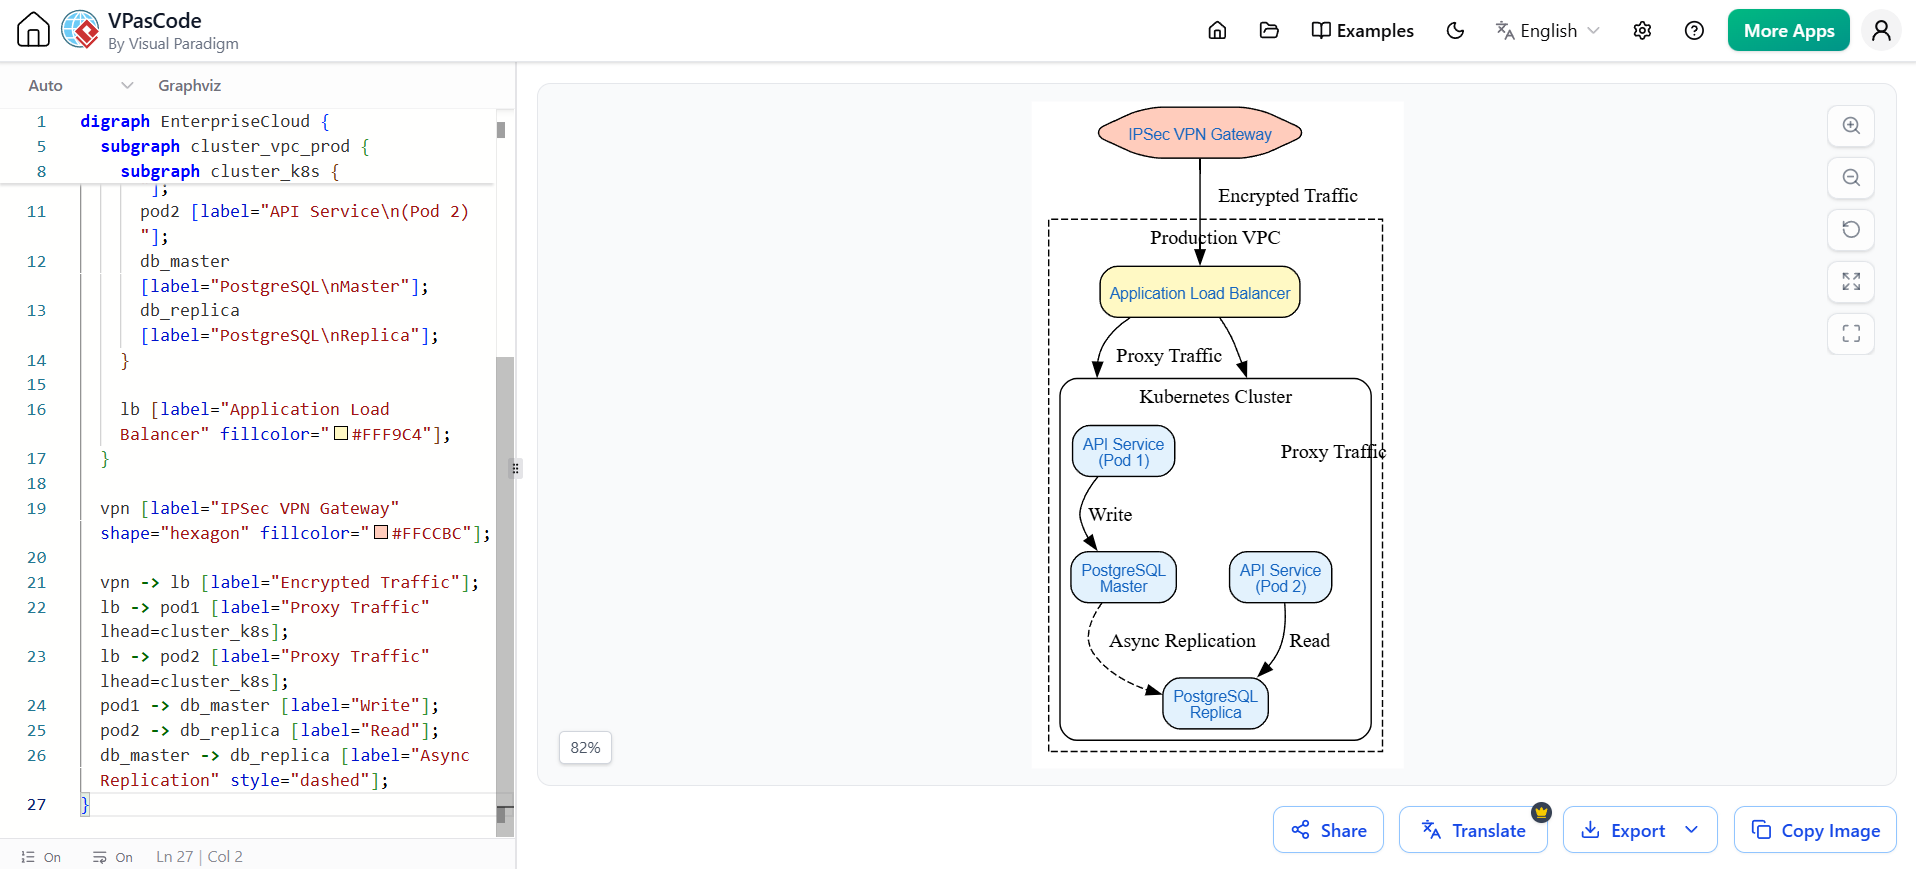
Graphviz Example: Infrastructure Documentation
For infrastructure teams, VPasCode’s Graphviz support enables programmatic representation of cloud architecture . Here’s a realistic example:
digraph EnterpriseCloud {
  compound=true;
  node [fontname="Helvetica,Arial,sans-serif" fontsize=11 shape=box style="filled,rounded" fillcolor="#E3F2FD" fontcolor="#1565C0"];

  subgraph cluster_vpc_prod {
    label="Production VPC"; style="dashed"; fillcolor="#FFF3E0";

    subgraph cluster_k8s {
      label="Kubernetes Cluster"; style="rounded"; fillcolor="#E8F5E9";
      pod1 [label="API Service\n(Pod 1)"];
      pod2 [label="API Service\n(Pod 2)"];
      db_master [label="PostgreSQL\nMaster"];
      db_replica [label="PostgreSQL\nReplica"];
    }

    lb [label="Application Load Balancer" fillcolor="#FFF9C4"];
  }

  vpn [label="IPSec VPN Gateway" shape="hexagon" fillcolor="#FFCCBC"];

  vpn -> lb [label="Encrypted Traffic"];
  lb -> pod1 [label="Proxy Traffic" lhead=cluster_k8s];
  lb -> pod2 [label="Proxy Traffic" lhead=cluster_k8s];
  pod1 -> db_master [label="Write"];
  pod2 -> db_replica [label="Read"];
  db_master -> db_replica [label="Async Replication" style="dashed"];
}
Key Features:
-
Subgraphs: Model hierarchical cloud boundaries (VPCs, Kubernetes namespaces)
-
Global Styling: Consistent colors and shapes defined at the graph level
-
Compound=true: Directs edges to cluster boundaries rather than individual nodes
Getting Started with VPasCode
VPasCode is available as a free tier with real-time preview, URL sharing, and SVG/PNG export . Premium tiers unlock AI capabilities including Code Error Fixing and Language Translation .
Quick Start Steps
-
Visit VPasCode (browser-based, no installation)
-
Choose your syntax: Mermaid, PlantUML, or Graphviz
-
Write code in the left panel, watch the preview render in real-time
-
Send to OpenDocs Pipeline to embed in documentation
-
Commit to Git alongside your application code
Summary
VPasCode represents a significant evolution in Diagram-as-Code tooling by:
-
Unifying three major syntaxes in one platform
-
Accelerating creation with AI-powered generation and error fixing
-
Eliminating documentation drift through the OpenDocs pipeline
-
Enabling version control and Git-native workflows
Whether you’re documenting microservices with Mermaid, modeling system architecture with PlantUML, or mapping cloud infrastructure with Graphviz, VPasCode provides a single interface that bridges the gap between code and clarity.
This post is also available in Deutsche, Español, فارسی, Français, English, Bahasa Indonesia, 日本語, Polski, Portuguese, Ру́сский, Việt Nam, 简体中文 and 繁體中文.
