


How To Create A Candlestick
What Is A Candlestick
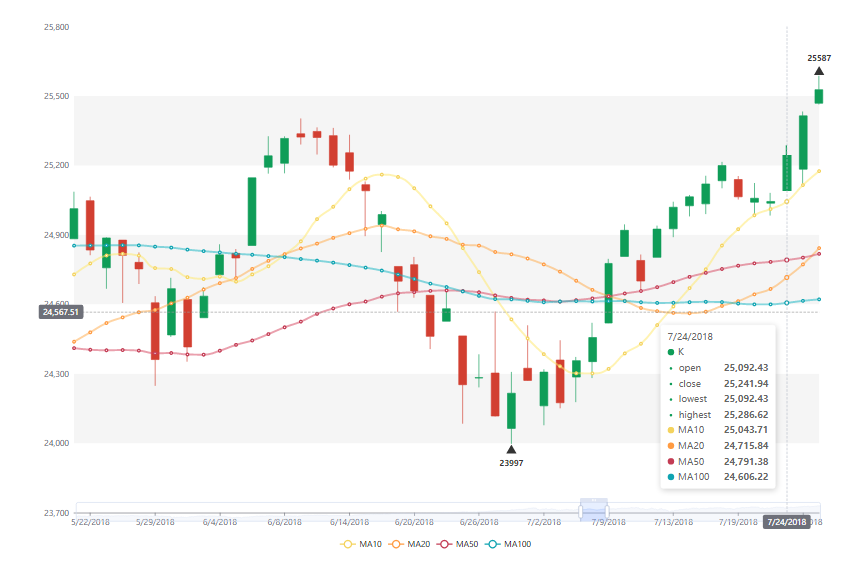
Candlestick chart, which is also called K-line, is a kind of financial chart. It is usually used to show movement of data like currency or price of derivatives. Red and green are used to show whether it is ascending or descending, while they will be different in different places.
How To Create A Candlestick
Edit Data
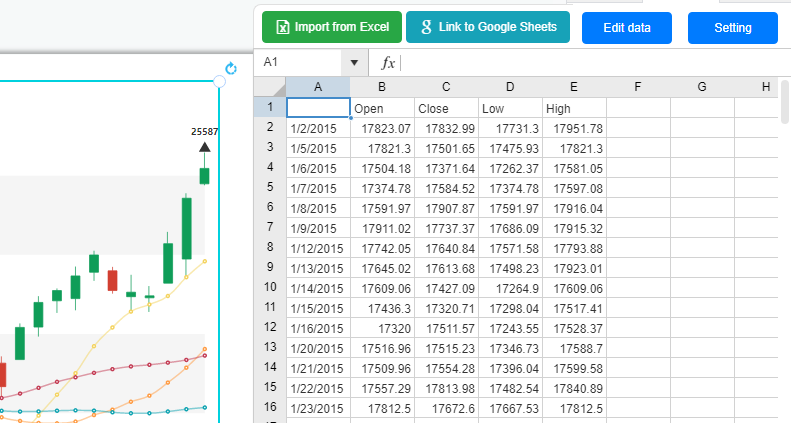
We can edit the data directly by the spreadsheet under Panel-Chart.
We can also choose to import the data from Excel or link to Google Sheet to customize the data.
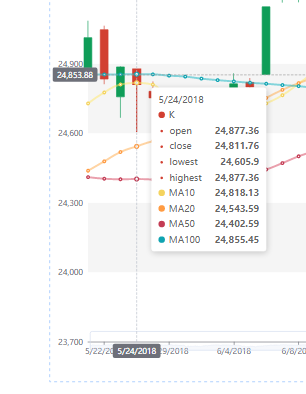
When we point to the chart, we can know the data for each day.
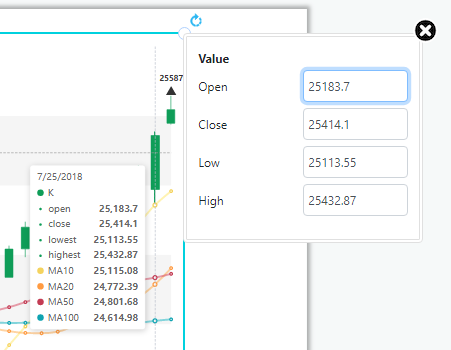
When clicking the point, a box will come out and we can edit the data by entering the value.
There are also some auxiliary lines to help us find the data of the point.
Customize the Chart
Color of the lines can be changed under Panel-Chart.
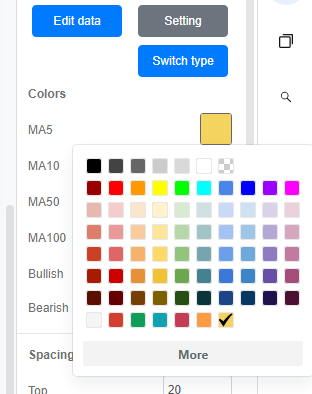
Other elements, such as the X and Y-axis, split line and area and legend, can also be changed under the same panel.
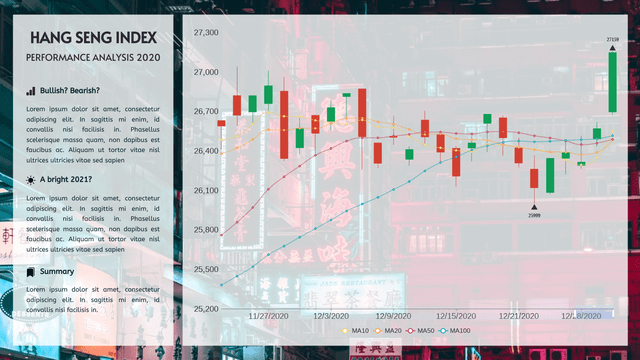
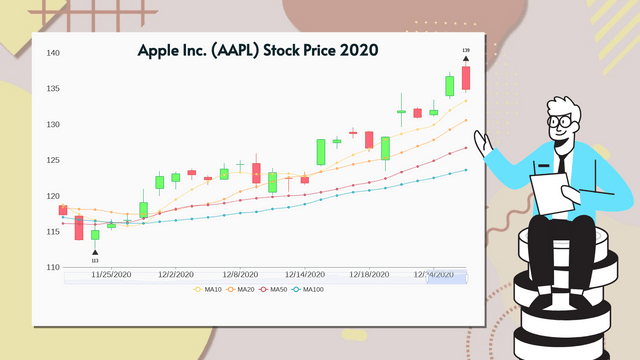
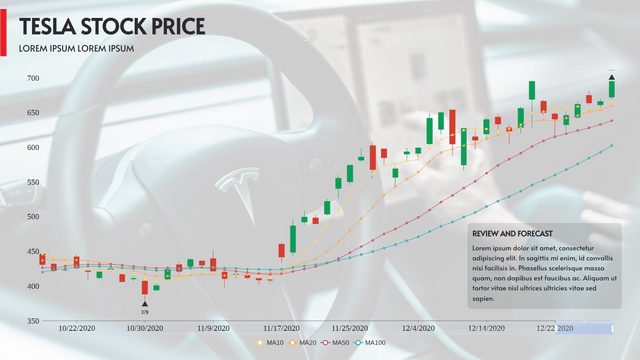
Templates Of A Candlestick
This post is also available in Deutsche, Español, فارسی, Français, English, Bahasa Indonesia, 日本語, Polski, Portuguese, Ру́сский, Việt Nam, 简体中文 and 繁體中文.
